


Abstract
A wide range of techniques for registration of medical images has been devised in recent years. The aim of this study is to quantify the overall spatial registration error of 3 different methods for image registration: interactive matching, surface matching, and uniformity index matching as described by Woods. Methods: MRI and ethylcysteinate dimer-SPECT images of the brain were registered for 15 patients. The matching error was assessed by determining intra- and interobserver variability of registrations. Quantification of the registration error was based on the mean spatial distance of 5000 voxels between 2 image positions. The mean position after repeated registrations in each patient was used as the gold standard. To evaluate the coherence of the 3 different registration methods, intermethod variability was determined. Results: Interactive matching showed an intraobserver/interobserver variability of 1.5 ± 0.3 mm/1.6 ± 0.3 mm (mean ± SD). The time demand for this method was 11 ± 5 min. Surface matching revealed a variability of 2.6 ± 1.1 mm/3.8 ± 1.0 mm and a time demand of 26 ± 12 min. Reproducibility of Woods' algorithm was 2.2 ± 0.8 mm with a time demand of 9 ± 3 min. In 4 of the 15 cases, Woods' method failed. The mean deviation between all 3 methods was 2.3 ± 0.8 mm. Conclusion: With a suitable user interface, interactive matching had the lowest registration error. The influence of subjectivity was shown to be negligible. Therefore, interactive matching is our preferred technique for image fusion of the brain.
Several methods for image registration have been devised in recent years to bring images of different modalities into spatial agreement. Interactive matching is performed by entering transformation parameters into the registration system or by user guided realigning of multimodality data on the computer (1–4). Most automated methods are based on corresponding surfaces (5–8) or gray-level distributions (9,10).
Despite increasing capabilities of automated registration methods, interactive image registration shows an accuracy that is comparable or superior with those of automated techniques (1–4). Automated methods based on surface matching, mutual information, gray-value correlation, Woods' algorithm, joint entropy, and external or internal markers were compared in several studies (11–14). In these studies, the algorithm according to Woods et al. (10) was the most accurate (11–14). In our institution, 2 commercially available workstations have been used for image registration: Hermes workstation (Nuclear Diagnostics AB, Haegersten, Sweden) and VoxelQ workstation (Picker International, Cleveland, OH). On these workstations, 1 interactive and 2 widely used automatic methods for image registration (surface matching and Woods' algorithm) are available. The aim of this study was to quantify the accuracy of these 3 methods by a 3-dimensional calculation of error.
MATERIALS AND METHODS
Patients and Image Acquisition
From March 1997 to March 1999, 42 patients were examined with MRI and ethylcysteinate dimer (ECD)-SPECT with a maximal interval of 2 wk between both examinations. All patients with findings normal for age (n = 15) were included in this retrospective study. The age of patients ranged from 25 to 74 y (mean age, 58 y).
MRI examinations were performed on a 1.5-T Magnetom Vision scanner (Siemens AG, Erlangen, Germany). In our routine MRI protocol for brain examinations, images were acquired with a T1-weighted MPRAGE (magnetization-prepared rapid gradient echo) sequence (repetition time, 11 ms; echo time, 4.9 ms). One hundred twenty-eight contiguous sagittal slices with 1.3-mm thickness were recorded into a 256 × 256 matrix with a pixel size of 1.0 mm2. Images were resampled to a set of 64 strictly transverse (not dependent on any special morphological features) slices with a thickness of 2.0 mm.
All patients were administered 650 MBq [99mTc]ECD intravenously for the perfusion brain SPECT scan. SPECT images of the brain were acquired on a triple-head gamma camera equipped with fanbeam collimators (Prism 3000 XP; Picker International). Acquisition parameters included a 15% energy window centered on 140 keV, a rotational radius of 13 cm or less, 120 projection angles over 360°, and a 128 × 128 matrix with a pixel width of 2.1 mm in the projection domain. Data collection started 60 min after injection. Projection images were reconstructed by filtered backprojection and filtered by a low-pass filter. For uniform attenuation correction, Chang's first-order method was used. Pixel size within reconstructed SPECT images was 2.5 mm. The resolution given as full width at half maximum (FWHM) was 6 mm. According to our routine reconstruction protocol, images were uniformly resliced by drawing a line connecting the anteriormost aspect of the frontal pole to the posteriormost aspect of the occipital pole, which approximates the line connecting the anterior and posterior commissures.
Image Registration
In all cases, intrasubject registration was performed by means of a rigid body transformation. The MRI study was defined as the primary fixed dataset, and the SPECT study was reoriented. In rigid body motion there are 6 degrees of freedom: translation and rotation along 3 orthogonal axes. Definition and orientation of axes are shown in Figure 1. Image scaling was determined from the known pixel size and slice thickness of both studies. Single steps for transformations were not restricted by the resolution of any of the modalities. Transformations could be performed even in subvoxel steps.

Definition and orientation of axes for translations (X, Y, and Z) and rotations (XY, XZ, and YZ).
Error Calculation
Each set of registration parameters defines a certain position of the transformed dataset in 3-dimensional space. The mean spatialdistance I between n corresponding voxels yi and xi of 2 image positions (Fig. 2) is given by:

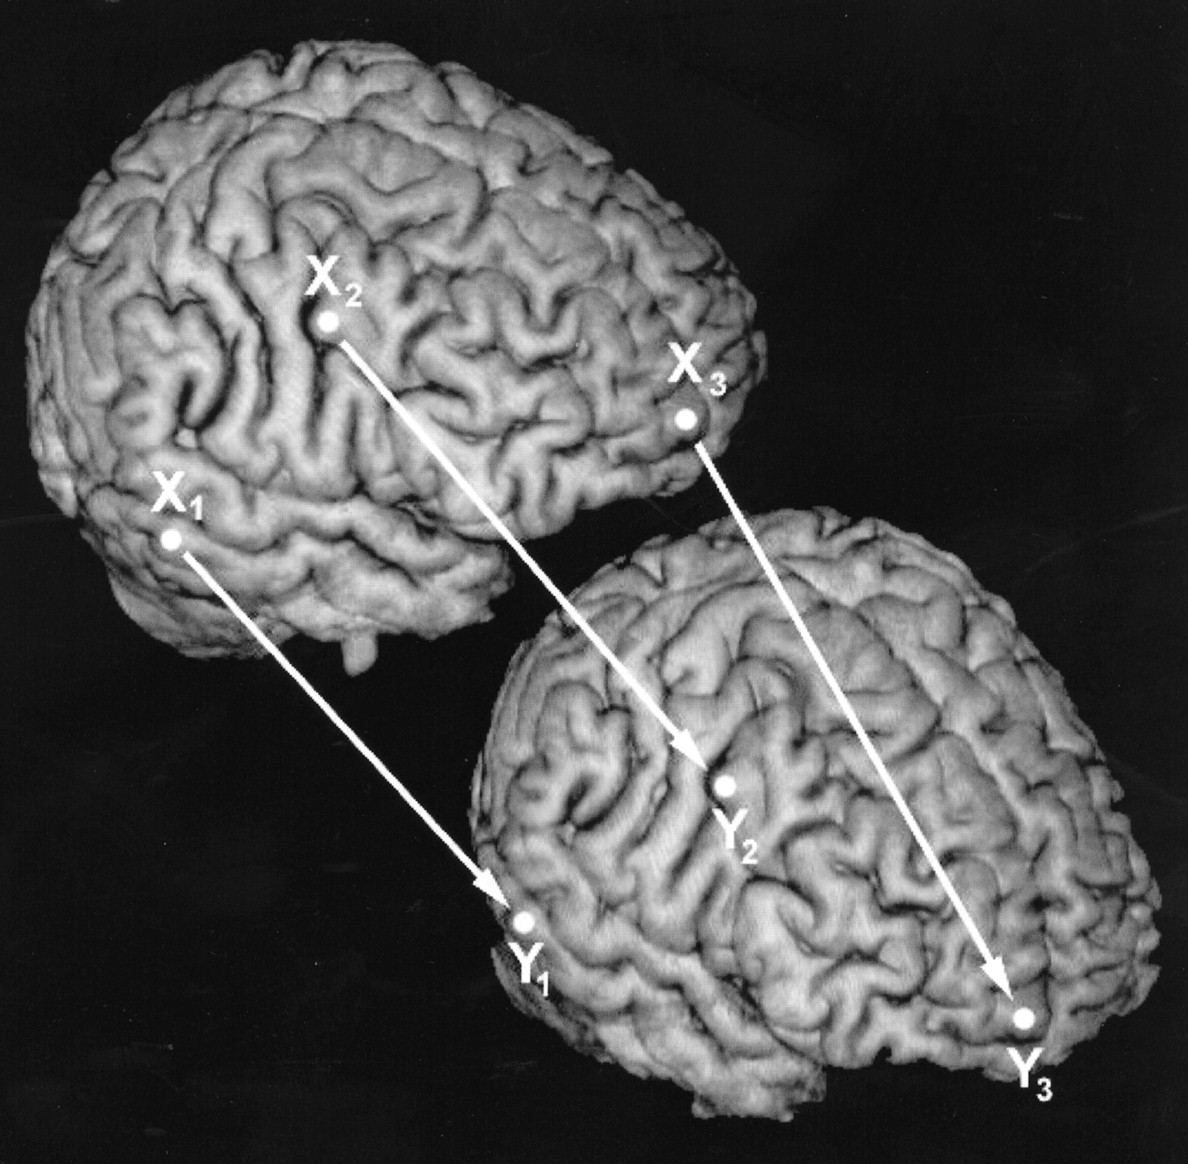
Given 2 brain positions, one defined by the gold standard and the other by a single registration trial, registration error for this trial is calculated as average distance between corresponding voxels X and Y.
An average position of the 3-dimensional dataset was calculated to evaluate variability of results for repeated application of 1 registration method in 1 patient. The distance I between this average position and the position after each individual registration was determined (Fig. 3). Intra- and interobserver variability was assessed by averaging related I values (Table 1).
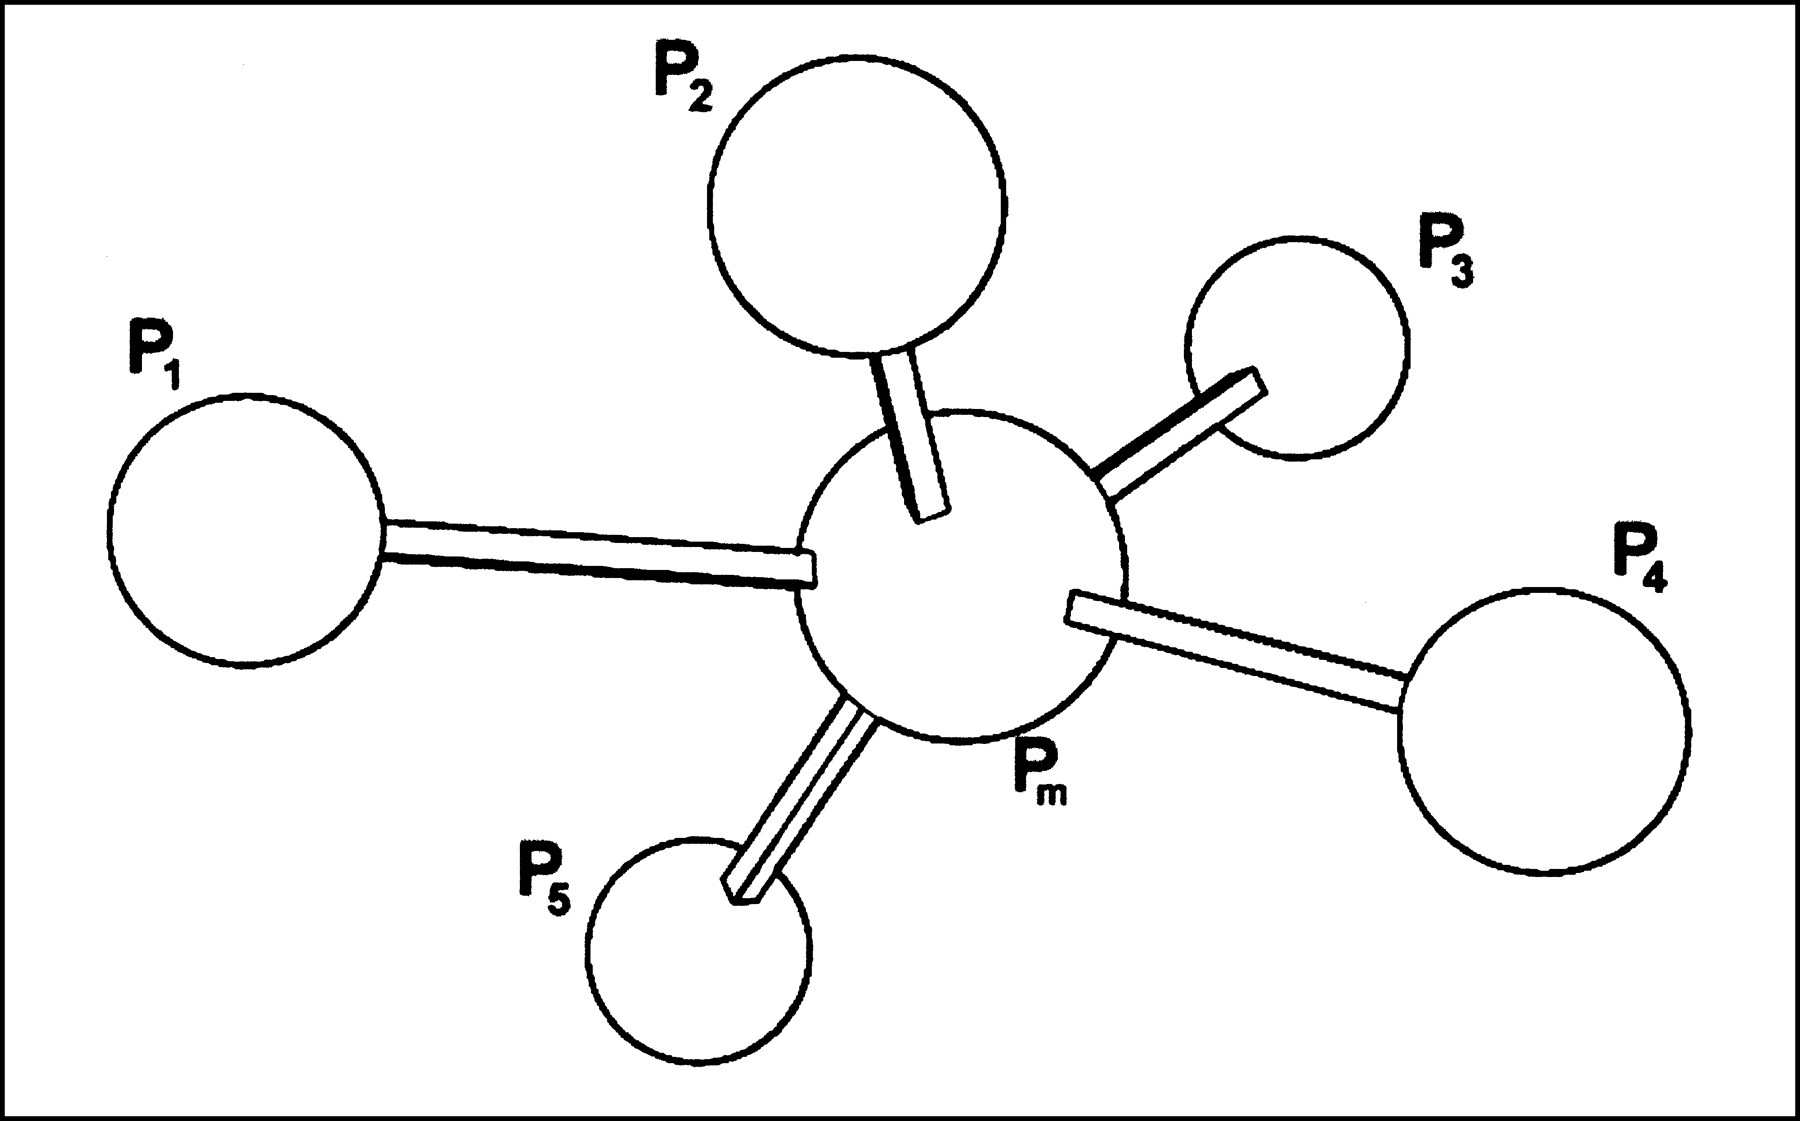
Definition of gold standard Pm. Pm is defined as mean position resulting from different positions P1–P5 representing repeated registrations.
Spatial Registration Error
To evaluate the coherence of the different registration methods, 15 registrations (all 3 matching methods with 5 attempts each, 1 observer) in each of 11 patients (11 patients for whom all 3 matching methods were successful) were compared. According to intra- and interobserver variability, the mean position of these 15 registrations was determined, and the resulting I values were averaged.
I was calculated for a subset of 5000 voxels isotropically distributed over the brain volume. Selection of these voxels was done by random generation of voxel coordinates leading to a Monte Carlo simulation. This method has been shown to be appropriate for random selection of points (15). To determine the number of voxels necessary for obtaining a stable result, variability of the mean spatial distance I depending on the number of voxels was analyzed in 5 randomly chosen patients. After using 5000 voxels, variation of I was <0.01 mm. Therefore, these 5000 voxels can be considered representative for the entire brain volume. Deciding whether a voxel was located inside or outside the brain was done by a SPECT-based threshold mask representing the brain contour. The threshold was determined by adapting the maximum fronto-occipital brain diameter in SPECT to that measured in MRI.
Because 2 different registration systems were compared, conventions about the handling of images had to be considered. Initial alignment of images and center of rotations were different on both systems. Therefore, the resulting influence on translation parameters was corrected. The order of rotations was the same on both systems.
Interactive Matching
Interactive matching was performed on a VoxelQ workstation (system specifications: Sun Ultra Sparc1, 167 MHz, 128-MB random-access memory [RAM]). A sagittal, coronal, transverse, and oblique (freely adjustable) slice is displayed simultaneously on a split screen with 4 view ports (Fig. 4). Gray-scale MR images are overlaid with color-coded SPECT images in each view port. The window levels and widths of MRI and SPECT images can be adjusted independently to get adequate image contrast for registration. Images can be zoomed to use the full resolution of 450 × 450 pixels per view port. For image registration, the SPECT image is moved in relation to the MR image (translation and rotation) with the computer mouse. This must be done in all orientations. For better visual control, each transformation during this process is immediately updated in all 4 view ports. Fine-tuning of this transformation in subvoxel steps can be done by arrow keys until the best fit is achieved. Finally, registration was controlled by visual inspection of each slice in any orientation with special attention to structures such as basal ganglia, corpus callosum, interhemispheric fissure, and gyral surfaces.

User interface for interactive matching. Gray-scale MR images are overlaid with color-coded SPECT images in each of 4 view ports. SPECT image is moved (translation and rotation) in relation to MR image until a best fit is achieved in all view ports.
For all 15 datasets, interactive matching was repeated 5 times by an experienced observer (trained radiologist) to assess intraobserver variability. In each repetition, the order of the 15 datasets was chosen randomly.
To evaluate interobserver variability, matching of 5 randomly selected datasets was repeated by 5 other operators. Two operators were experienced in image fusion (1 trained senior radiologist and 1 trained nuclear medicine physician) and 3 were less experienced (2 radiology and 1 nuclear medicine residents who perform image fusion only occasionally). Images were presented randomly to the observers so as not to introduce any bias in the process as a result of image order. The same 5 datasets were presented to the 5 observers.
Surface Matching
Surface matching was performed on the same VoxelQ workstation in all 15 cases. In a first step, the brain surface had to be segmented in both studies. Segmentation of MR images was done manually by outlining the brain contour in each slice with the computer mouse. Segmentation of SPECT images was performed with a threshold-based, region-growing algorithm. After segmentation of both studies, the algorithm according to Pelizzari et al. (5) uses a nonlinear least-square error function to determine translational and rotational parameters that best fit the SPECT brain surface onto the surface defined by the MRI contour. To test the influence of manual segmentation on the matching result, segmentation of the brain surface and surface matching were repeated 5 times by the same observer in all 15 cases. For evaluation of interobserver variability, segmentation was performed by 5 different users in 5 cases. Surface and interactive matching were performed by the same operators.
Woods' Algorithm
This iterative algorithm is based on the fact that certain structures and organs have a similar uniformity of pixel values in different modalities, yet it does not depend on similarity of absolute pixel values. As a first step, the MRI dataset is divided into 256 gray-level classes. Each gray-level class c comprising nc voxels is then projected on the SPECT dataset, and the SD of SPECT pixel values in each class is minimized by iterative change of transformation parameters.
In detail, the error function
 is minimized, where gv denotes the gray level of a SPECT voxel v and
 represents the mean gray level of all SPECT voxels belonging to class c. Minimization was done using the simplex method. Unsegmented MRI datasets including skull and skin structures were used for Woods' algorithm, which is implemented on a Hermes workstation (system specifications: 300-MHz Pentium II processor, 128-MB RAM). To exclude obvious misalignment by this method, matching results were checked visually. Wong et al. (16) showed a misalignment of >4° rotation or >3-mm translation to be reliably detectable by visual inspection. In our study, 4 patients with an obvious misalignment (rotation > 19°, translation > 25 mm) for this method were excluded.
To test the robustness of this method, registration was repeated 5 times, starting at different initial alignments for all patients. The initial alignment was changed randomly by a computer program between 5 and 50 mm (mean, 28 mm) translation and 3° and 30° (mean, 17°) rotation along each axis.
To test the influence of using segmented versus unsegmented MRI datasets in Woods' algorithm, nonbrain structures were interactively removed in 5 cases (the first 5 cases from the alphabetical list of patient names). Registration results of edited MR images were compared with those resulting from unsegmented MRI data.
RESULTS
Interactive Matching
We found an average intraobserver variability of 1.5 ± 0.3 mm for interactive matching (Table 1). This value represents the average spatial distance between 5000 corresponding voxels of the brain. The position of corresponding voxels was defined by the mean and individual position of the brain after repeated registrations. SDs of single registration parameters are shown in Table 2. The overall interobserver variability was 1.6 ± 0.3 mm (experienced observers, 1.5 ± 0.3 mm; inexperienced observers, 1.7 ± 0.4 mm). There was no improvement of the matching accuracy with successive interactive sessions during the study. In 1 patient, the maximum spatial distance between 2 corresponding voxels in the matching trial with the worst registration result was 5.6 mm/5.8 mm (Table 1). This maximum deviation occurred in the frontal (34%), occipital (25%), and upper parietal (19%) part of the brain as well as in the cerebellum (22%). It always occurred on the brain surface. Distribution of this maximum deviation was analogous for all performed registration methods. The average time demand for interactive matching was 11 ± 5 min, including image loading, interactive registration, and final visual inspection.
SD of Single Registration Parameters
Surface Matching
Reproducibility of surface matching after repeated segmentation showed an intraobserver variability of 2.9 ± 1.1 mm and an interobserver variability of 3.8 ± 1.0 mm. The average distance from the mean position was 3.5 ± 1.0 mm for experienced observers and 4.0 ± 1.3 mm for inexperienced observers. The maximum possible error was 10.5 mm/11.7 mm (Table 1). The time demand for the whole registration process was 26 ± 12 min. About 70% of the time was used for manual segmentation of the brain in MRI, 10% for automatic segmentation of SPECT images, and 20% for computing the transformation.
Woods' Algorithm
Analysis of the 4 patients who were excluded by visual inspection revealed a rotational misregistration of 5°–40° and a translational misregistration of 2–37 mm. For the remaining 11 cases, Woods' algorithm revealed a reproducibility of 2.2 ± 0.8 mm. The maximum possible error was 8.2 mm (Table 1).
Of the 5 cases in which segmented and unsegmented MRI data were used for registration, 1 case showed an obvious misalignment with segmented and unsegmented data. In the remaining 4 cases, the average reproducibility was 2.3 ± 0.7 mm for segmented and 2.1 ± 0.8 mm for unsegmented data. After putting segmented and unsegmented data together, the overall reproducibility was 2.3 ± 0.8 mm. The time demand was 9 ± 3 min. Most of this time was necessary for computing the transformation.
Coherence of Registrations
The average distance between the mean positions of the 3 registration methods was 2.3 ± 0.8 mm (Table 1).
DISCUSSION
Defining a gold standard for multimodality image registration in vivo is an elementary problem because true registration parameters of clinical data are never exactly known. Every possible reference system that can be used to evaluate the accuracy of image registration suffers from its specific limitations: It is difficult to give a precise estimate of the true registration error in view of the fact that fiducially based registration itself has inherent measurement errors (10). External markers are responsible for registration errors primarily associated with inaccurate localization. Turkington et al. (17) reported an average marker position difference of 1.4 mm for surface-attached markers. Sipila et al. (18) encountered a locating error of 2 mm for external markers placed on a phantom. Even for markers screwed into the outer table of the patient's skull, a fiducial registration error of 1.7 mm was found (14). Furthermore, markers screwed to the skull do not prevent the brain from moving inside the skull. In addition, every registration method based on external markers can be used only prospectively.
Simulated data (e.g., simulated PET from MRI data), as used by Strother et al. (11), can be used to create image pairs for which the correct transformation is defined as a gold standard. Using such simulated data, an error of 2.4 mm for surface matching and 1.3 mm for Woods' algorithm was reported (11). In comparison with studies using original patient data (14,17,19), these good results may be caused by the higher level of similarity between MRI and simulated PET images.
Matching an arbitrarily transformed study back onto the original can be used only to evaluate intramodality image registration. In contrast with patient data, phantoms for the assessment of registration accuracy usually have a better contour contrast, thereby leading to better registration results. To measure the registration error retrospectively in patients, we assessed the reproducibility of image registration by evaluating the intra- and interobserver variability.
For quantifying the error of image registration, some authors use the variability of single transformation parameters to compare repeated registrations (12,17). However, single parameters do not represent any clinically relevant measure for the registration accuracy. Therefore, we calculated the average and maximum spatial distance between 5000 corresponding brain voxels. A similar approach was chosen by Strother et al. (11) and Black et al. (19).
Habboush et al. (3) evaluated the accuracy of interactive MRI–SPECT image registration using images with a voxel size of 2.45 × 2.45 × 2.45 mm3. In this study, an interobserver variability (3 observers, 2 patients) of 2.7 mm based on the distance of 3 test points within the brain was found. Pietrzyk et al. (1) matched MRI with PET data in 2 cases and used MR images with a voxel size of 1 × 1 × 2 mm3. They found an average SD of 1.3 mm for the translations and 1.0° for the rotations. In our study, interactive matching revealed an interobserver SD of 0.6 mm and 0.9°. Possible reasons for the higher accuracy in our study are the resolution of MRI data, on the one hand, and the user interface for interactive matching, on the other. Because the whole registration procedure is based on visual control, simultaneous display of different image orientations with a real-time update during matching was essential. Another important feature was the possibility to zoom images, which allowed subvoxel manipulations.
In contrast with automated methods, the main limitation of interactive matching is the operator dependence. However, the results of less experienced operators were even better than those of surface matching and Woods' algorithm in our study.
Our results with automated registration methods are comparable with those published in the literature. West et al. (14) reported errors of 2.0 mm for Woods' algorithm and 2.8–3.8 mm for different surface matching methods after registration of MRI and PET in a multicenter study. Black et al. (19) investigated MRI–PET image registration of monkey brains and found an error of 2.4 mm for Woods' algorithm. Turkington et al. (17) reported translational errors of 2–4.5 mm and up to 2° rotational error for surface matching of MRI–PET image pairs obtained from volunteers.
In contrast with other authors (10,11,14), we used unsegmented MRI data for Woods' algorithm in this study. However, we found only minor differences between registration results using segmented and unsegmented MR images in 4 exemplary patients. Because of these results, the use of unsegmented images is considered to be appropriate.
The principle of automated matching algorithms is the minimization of an error function, leading to the global minimum in the best case. Local minima in the error function, in which an automatic algorithm can stop before the global minimum is reached, are a possible source for insufficient registration. To assess this problem, multiple starting points for the registration can be used (20). In our study, we repeated registration with Woods' algorithm 5 times, starting at different initial alignments, which resulted in a variability of matching results of 2.2 ± 0.8 mm. Because of these relatively constant values over 11 patients, we consider local minima less probable to be responsible for the variation of matching results. This variation is more likely caused by a discretization error of transformation parameters during the error calculation, thus, leading to an unfair disadvantage for Woods' algorithm. Another possible problem is the error function itself with its limited ability to extract and evaluate image features that are relevant for registration. Even if the global minimum of such an error function is found, the corresponding registration can obviously be wrong, as shown in 4 of our patients. As described by Wong et al. (16), a rotational misregistration of >4° and a translational misregistration of >3 mm are reliably detectable by visual inspection. In our 4 excluded cases, these values were exceeded.
When evaluating only the reproducibility of different matching methods, a systematic error within each of the methods cannot be assessed. Therefore, we investigated the intermethod variability of the 3 different matching methods. This difference was in a comparable range with the variability of each single method, indicating the absence of a severe systematic error in any of the registration methods.
The mean registration error of the 3 registration methods in our study was below the resolution of SPECT given as FWHM. However, the maximum possible registration error was between 6 and 12 mm and, therefore, exceeds the FWHM resolution.
CONCLUSION
In this study, surface matching revealed the lowest registration accuracy and the highest time demand. Woods' algorithm showed a sufficient accuracy; however, visual inspection is indispensable to detect obvious misregistration that occurred in 4 of our 15 cases. With an optimized user interface, interactive matching showed the lowest registration error. The influence of subjectivity, which is often claimed as a disadvantage of interactive techniques, has been shown to be negligible. Therefore, interactive matching is our preferred technique for image fusion of the brain.
Footnotes
Received Aug. 6, 1999; revision accepted May 5, 2000.
For correspondence or reprints contact: Thomas Pfluger, MD, Department of Diagnostic Radiology, Klinikum Innenstadt, University of Munich, Ziemssenstrasse 1, D-80336 Munich, Germany.


