


Abstract
Lung volume reduction (LVR) is an effective therapy for end-stage emphysema. Preliminary and postprocedure imaging is usually limited to CT for anatomic delineation of the location and severity of the most acutely affected lung zones. The purpose of this study was to investigate the potential of using a new quantitative gas trapping index (GTI) derived from a 133Xe ventilation scan to assess the severity of emphysema. Methods: Using the equilibration and washout phases of a 133Xe ventilation study, a GTI was compared with visual National Emphysema Treatment Trial (NETT) CT scoring, semiautomated CT densitometry, and 99mTc perfusion scintigraphy in 28 patients being evaluated for LVR. The GTI was calculated as the percentage of 133Xe gas retention in a 3-min washout image compared with the peak equilibrium image for 6 lung zones. Results: The GTI correlated best with the percentage of perfusion (−0.39, P < 0.0001) and the CT density scoring with the percentage of severe emphysema (0.36, P < 0.0001). There was less correlation with visual NETT CT scores (0.25, P < 0.001). Conclusion: This GTI, based on widely available 133Xe imaging, shows good correlation with other quantitative measures of emphysema that are anatomically based. Because this GTI provides a more functional assessment of gas trapping and airway disease, these results suggest that additional study is warranted to investigate its use as a functional measure of emphysema before and after LVR.
Lung volume reduction (LVR), by either surgical resection or bronchoscopic occlusion, is an effective mode of therapy for patients with end-stage emphysema. Imaging of the lungs is performed with CT before LVR to identify the location of the most severely affected lung segments for resection and to identify other pathology. The severity of emphysema depicted on the CT is most commonly scored visually using the National Emphysema Treatment Trial (NETT) criteria (1). Computerized lung density scoring of CT is also actively being investigated as a method for quantifying emphysema (1–4). Although CT has been correlated with clinical and physiologic outcome measures, it provides only structural information on the severity and distribution of emphysema without providing physiologic information on lung function. Functional evaluation of the response to LVR is currently performed using a variety of clinical measurements including pulmonary function testing and 6-min-walk exercise testing (5–7).
Functional imaging with ventilation and perfusion lung scintigraphy (VQ scan) can be used to assess regional perfusion and gas trapping on a zone-by-zone basis in the lungs. Studies have used only the perfusion study to localize hypoperfused lung segments as potential sites of LVR. Perfusion scintigraphy has been shown to be accurate in predicting improvement in forced expiratory volume in 1 s status after LVR and to complement CT for preoperative assessment for LVR (8). Perfusion scintigraphy, however, has not been widely applied to either postinjection or postoperative evaluation of LVR.
We have previously demonstrated that the washout phase of the 133Xe ventilation study can be used to assess functional changes in both large and small airways before and after LVR (9). Ventilation scintigraphy, however, is not used routinely as a method to localize diseased areas of the lungs as target sites for LVR. Because gas trapping is a primary physiologic manifestation of emphysema, we theorized that imaging areas of 133Xe gas trapping could provide a quantitative method to localize areas of severe emphysema for LVR.
This study had 2 goals. The first was to assess the technical feasibility of measuring 133Xe gas trapping in patients with severe emphysema being evaluated for LVR. The second was to compare a 133Xe gas trapping index (GTI) with perfusion lung scintigraphy and CT methods currently in use to detect areas of emphysema suited for LVR.
MATERIALS AND METHODS
We performed a retrospective study of 36 patients (22 men, 14 women) with severe emphysema who were being evaluated for LVR at Temple University Hospital between 2005 and 2006. Approval for this retrospective study was granted by our institutional review board. Each patient was selected on the basis of having had a quantitative VQ scan for clinical purposes within 3 mo of a high-resolution, inspiratory CT scan of the thorax.
Eight patients were excluded because of extensive fibrotic lung disease. The remaining patients (n = 28) included 17 men and 11 women (mean age, 63.4 ± 6.7 y). The GTI and computerized CT emphysema density scores were quantified by a fellow in training in nuclear medicine. The preoperative CT images of the chest were visually scored by 2 staff physicians using the NETT criteria. The CT visual scores were the mean value of 2 independent readings. If any pair of independent visual CT scores differed by a value of more than 1.0 in a lung zone, a consensus reading was performed and the consensus value was used.
Each patient underwent a 133Xe ventilation scan, which consisted of upright inhalation and imaging of 455–740 MBq of 133Xe gas with four 4-s posterior images (washin phase), followed by closed-system rebreathing of the gas mixed with oxygen for six 30-s frames (equilibrium phase), and followed by six 30-s frames while allowing the 133Xe gas to wash out of the patient's lungs (washout phase) as previously described (9). The patient was then injected and imaged supine with 111–148 MBq of 99mTc-macroaggregated albumen (MAA). The lung perfusion images were acquired in the anterior, posterior, and right and left anterior and posterior oblique views. All images were acquired using a low-energy, high-resolution collimator and 128 × 128 word mode matrices. The 133Xe images were acquired using the 80-keV photopeak and the 99mTc images were obtained using the 140-keV photopeak; both used a 20% window setting.
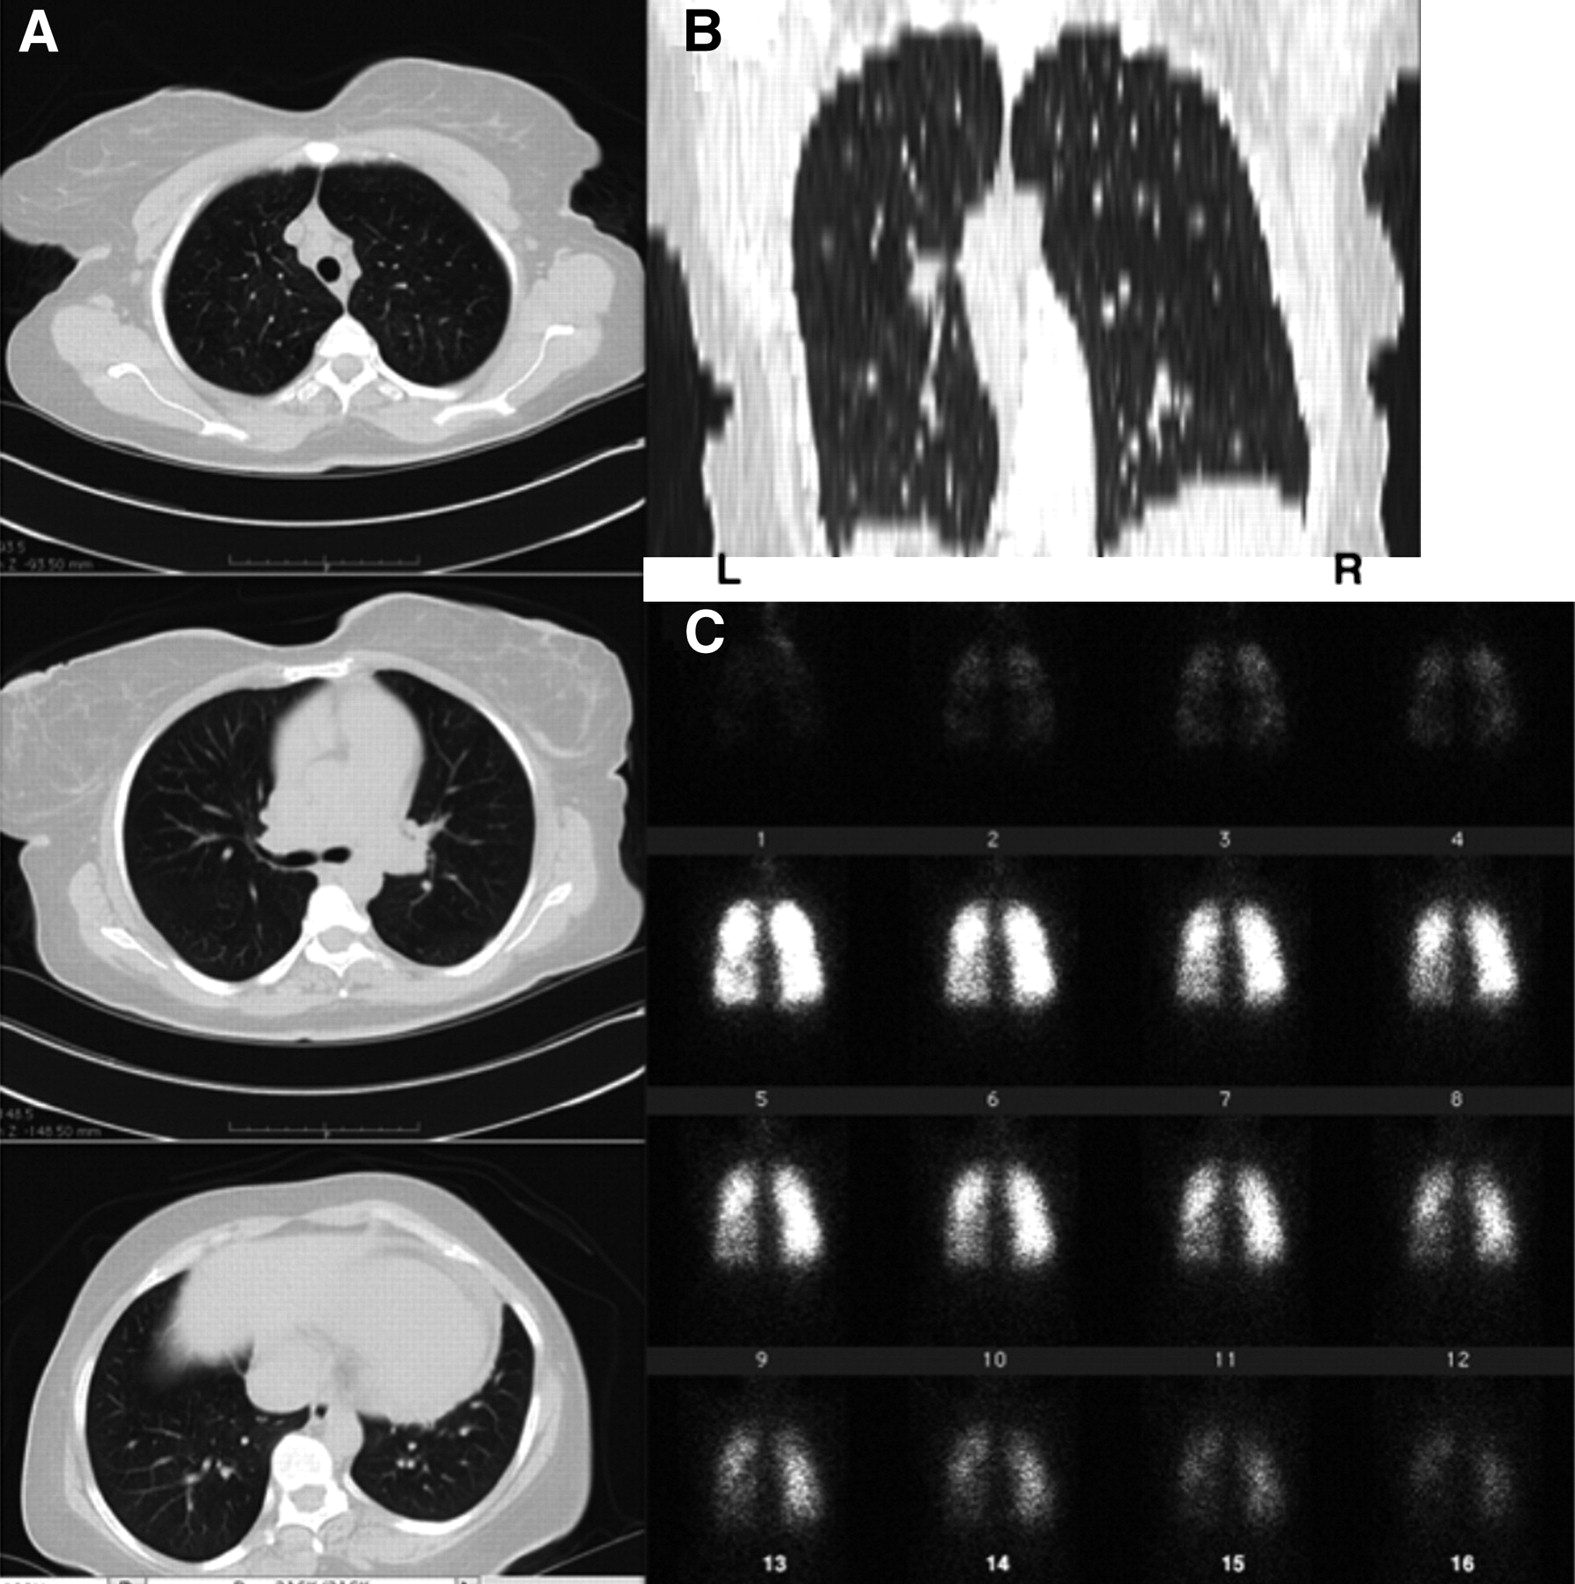
The equilibrium-phase image with the maximum total counts was chosen as the reference frame to calculate the GTI (100% peak 133Xe inhaled). This image was then divided into 3 regions of equal height from apex to lung base for each lung, subdividing the lungs into 6 zones: left upper, left middle, left lower, right upper, right middle, and right lower lung. Quantitative analysis was performed using a rectangular region of interest (ROI) over each lung zone. The washout phase, consisting of frames 11 through 16 (Fig. 1), was further subdivided into 3 components: minute 1, minute 2, and minute 3 (frames 12, 14, and 16, respectively). The same ROIs applied to the equilibrium reference frame were applied to the washout-phase images. Because LVR is performed on the most severely affected lung segment, the GTI was calculated as the percentage of gas retained in the 3-min washout image reflecting severe gas trapping.

(A) Selected transaxial CT images in upper, middle, and lower lung zones. These were graded with NETT scores of 4 for extensive emphysema involvement in bilateral upper and middle lung zones, with sparing of lung bases. (B) Coronal reformatted CT image with left and right inverted to match posterior 133Xe images in C. (C) 133Xe images illustrate washin phase (frames 1–4), equilibrium phase (frames 5–10), and washout phase (frames 11–16). Good agreement is seen in areas of gas trapping in washout images in right upper (GTI, 0.54) and middle (GTI, 0.40) lung zones, with areas of low density in CT coronal image. 133Xe study, however, showed more severe gas trapping in right than in left upper (GTI, 0.24) and left middle (GTI, 0.23) lung zones.
To quantify lung perfusion, the anterior and posterior 99mTc-MAA perfusion images were analyzed by dividing the image into the same 6 equal ROIs as for the ventilation images. The geometric mean counts were used to calculate the percentage of perfusion per lung zone compared with the geometric mean of total lung counts.
Chest CT scans were obtained with the patient supine without intravenous contrast during full inspiration and expiration. The CT examinations were performed on a 16- or 64-detector scanner (Somatom 16 or 64; Siemens) using a high-resolution, multislice helical protocol consisting of a 5-mm slice thickness, 0.75-mm collimation, 120 kV, 140 mAs (effective), a 0.5-s rotation time, and a 512 × 512 matrix. The CT field was set to encompass the lungs from lung apices through the costophrenic recess.
NETT visual, semiquantitative CT scores of emphysema were obtained by visual grading of the percentage of severity of emphysema per lung zone based on a 4-point scale from the inspiratory CT. With this score a grade of 0 indicates no emphysema; a score of 1, 0%–25% lung zone involvement; a score of 2, 25%–50% involvement; a score of 3, 50%–75%; and a score of 4, greater than 75% involvement. The lungs were divided into upper, middle, and lower zones using the NETT criteria, specifically apex to inferior aspect of aortic arch representing the upper zone, anteroposterior window to most inferior pulmonary vein representing the middle zone, and most inferior pulmonary vein to lung base representing the lower zone.
The CT images were also analyzed using the semiautomated lung density software previously described (10–12). For the CT density scoring, the lungs were subdivided into upper, middle, and lower zones, in the same manner as used for the NETT visual scores to calculate an average percentage of severe emphysema and average lung density per zone. The percentage of severity threshold was set as 19.1 mL of air per gram of lung tissue for severe emphysema. After creating an ROI around the lung tissue for each CT slice, the CT density software generated both an average lung density per ROI as well as the percentage of lung tissue per ROI that exceeded 19.1 mL of air per gram of lung tissue. This corresponds to −950 HU and above, which defines severe emphysema. This threshold was applied to voxels within the range of −1,024 to −950 HU based on the data from Gevenois et al., which showed that a −950-HU threshold correlated best with histologic quantification of emphysema (13).
Statistical Analysis
The GTI for each lung zone was compared with the percentage of perfusion, visual NETT score per zone, percentage of severe emphysema per zone, and average lung density per zone using Pearson correlations. A correlation coefficient of less than 0.2 indicates a negligible relationship; values of 0.2–0.4 indicate a slight but definite relationship; values of 0.4–0.7 indicate a moderate relationship; and values greater than 0.7 indicate a strong relationship. Statistical analyses were performed using V9.1 software (SAS Institute).
RESULTS
A total of 168 lung zones were analyzed (6 zones in 28 patients). For all combined lung zones, the GTI correlated best with the percentage of perfusion (−0.39, P < 0.0001) and CT digital density score with percentage of severe emphysema (0.36, P < 0.0001). There was only a slight correlation with the visual CT score (0.25, P < 0.001) as well as the mean lung density (0.33, P < 0.0001) (Table 1).
Correlation of 133Xe Index by Lung Zone with Each Parameter Studied
There were differences in the degree of correlation when comparing individual lung zones. The right upper zone correlated moderately well with the percentage of perfusion, mean lung density, and percentage of severe emphysema (−0.66, P < 0.0001; 0.72, P < 0.0001; and 0.57, P < 0.01, respectively). Similarly, the right middle zone correlated moderately well with the percentage of perfusion, mean lung density, and percentage of severe emphysema (−0.58, P < 0.001; 0.41, P < 0.03; and 0.60, P < 0.05, respectively). There was poor correlation, however, in the right lower lung zone. The left upper, middle, and lower zones correlated moderately with the percentage of perfusion (−0.48, P < 0.01; −0.45, P < 0.02; and −0.41, P < 0.03, respectively) but only slightly with mean lung density and percentage of severe emphysema.
DISCUSSION
Emphysema is unique among the forms of chronic obstructive pulmonary disease as it involves both permanent destruction of alveoli and small-airway disease (5,14). The tissue damage in emphysema is caused by chronic inflammation, which eventually causes a decrease in lung elastic recoil, progressive hyperinflation, and gas trapping because of closure of small airways. LVR is an effective treatment because resection or occlusion of the most damaged and hyperinflated lung improves ventilation of the remaining lung. Studies have shown that LVR results in an increase in effective lung volume (15). Accurate identification of areas of dead space (i.e., areas of gas trapping) is of paramount importance, and imaging is considered central for identifying target sites for LVR (16).
Studies have demonstrated that heterogeneous emphysema, which is predominantly in the upper lung zones, predicts a better response to LVR (3,17–19) and that the volume of severe emphysema present before LVR correlates with the magnitude of improvement (20). A scintigraphic ratio of decreased perfusion in the upper to the lower lung regions, however, was not predictive of response to therapy in a large randomized study of LVR (21).
CT images characterize emphysema by areas of abnormally low attenuation (22,23). Studies have shown that the severity and extent of emphysema can be underestimated by CT, compared with pathologic grading (24). Extensive lung fibrosis can make visual CT scoring more subjective and difficult and require manual correction of ROIs to exclude fibrosis when using semiautomated CT densitometry. For these reasons, patients with extensive fibrosis were excluded from this study. Use of a GTI may offer an advantage to CT, especially when fibrosis is present.
Perfusion imaging adds no value over CT for evaluating emphysema as the two reflect similar structural changes (25). It has been shown that measuring the rate of 133Xe gas washout reflects both large- and small-airway function (9) and that a mean transit time can be correlated with functional improvement after LVR (26).
CT and 133Xe imaging look at 2 related, but different, properties: airspace destruction versus gas trapping. In this study we have shown that a 133Xe GTI can quantify gas trapping and provide good correlation with CT visual and computer scoring (Fig. 1). In some cases 133Xe gas trapping was discordant with CT (Fig. 2). The lack of a high correlation of the GTI with CT is likely because the GTI reflects not only parenchymal damage but also small-airway disease. The 133Xe GTI therefore may serve better to select patients who are not candidates for LVR (27).

(A) Selected transaxial CT images in upper, middle, and lower lung zones. These were graded with NETT scores of 4 for extensive emphysema involvement in bilateral upper and middle lung zones, with sparing of lung bases. (B) Coronal reformatted CT image with left and right inverted to match posterior 133Xe images in C. (C) 133Xe images illustrate washin phase (frames 1–4), equilibrium phase (frames 5–10), and washout phase (frames 11–16). Visual NETT CT scoring was 2 in all lung zones and interpreted as bilaterally symmetric. 133Xe washout images show, however, asymmetric gas trapping, which is focal in the left upper lung zone (GTI = 0.19) and the right middle (GTI = 0.20) and the right lower (GTI = 0.22) lung zones.
Planar (2-dimensional) 133Xe imaging was used in this study rather than SPECT, as the former is more practical and widely available. We recognize this as a limitation of the study. Any correlation between the scintigraphic GTI and CT is inherently limited because the 133Xe scans are planar images, and the CT studies are cross-sectional. In addition, because the 133Xe study was performed with the patient upright and the CT studies with the patient supine, this may have further contributed to differences in measurements between 133Xe and CT. In future investigations, SPECT ventilation scans could be used and might provide a better correlation with CT (27). There are, however, practical limitations in performing SPECT on a patient on a 133Xe rebreathing system. Use of a dual-head camera may permit more rapid SPECT image acquisition and permit more accurate geometric mean quantification.
We note that poor correlations were found involving the left middle, left lower, and right lower lung zones. On the left, this poor correlation may be because the heart was included in the scintigraphic ROIs whereas the cross-sectional CT measurements excluded the heart. The poor right-lower-lung correlation may result from use of an ROI that did not reflect the different position of the diaphragm at the lung–liver interface during the washout phase of the ventilation study, compared with the single breath hold during CT.
All patients were able to successfully complete the VQ scan, including all 3 phases of the ventilation study. We have used a modification of the original 133Xe ventilation study, which specifies an initial single, large inspiration followed by 25 s of breath-holding (28). We believe the use of a timed, computerized acquisition of four 4-s images at the patient's own respiratory rate improves patient acceptance and adequately demonstrates initial regional ventilation.
CONCLUSION
The purpose of this study was not to establish a high correlation with the current CT measures of severe emphysema. Rather, it was to look at the technical feasibility of obtaining a new physiologic measure of gas trapping in emphysema using a simple, clinically available, and quantitative score. The 133Xe GTI described is such a measure. This index can be calculated using equipment readily available in all nuclear medicine departments. The achieved correlations show that the index has the potential to give additional physiologic information on regional gas trapping and airway obstruction. On the basis of these preliminary results, further study of its value in evaluating patients before and after LVR is warranted.
Footnotes
-
COPYRIGHT © 2008 by the Society of Nuclear Medicine, Inc.
References
- Received for publication October 26, 2007.
- Accepted for publication January 16, 2008.


Jump to section
Related Articles
Cited By...
- No citing articles found.