Article Text

Statistics from Altmetric.com
Endothelial function and dysfunction
The endothelium, although only a monolayer of cells, plays a pivotal role in vascular haemostasis by regulating vascular tone, thereby controlling blood flow to end organs.1 It also plays important roles in maintaining balance between anti- and pro-coagulant activities, contributing to thrombo-resistance and controlling cellular adhesion, underlying smooth muscle proliferation, and vessel wall inflammation. In addition to local conversion of angiotensin I to angiotensin II, endothelial cells produce and release a number of vasoactive substances, including nitric oxide, endothelium derived hyperpolarising factor, prostacyclin, endothelin, and vasoconstrictor prostanoids, that regulate vascular tone. Endothelial cells can also respond to circulating vasoactive substances such as bradykinins, serotonin, adenosine, and thrombin.
Alterations in endothelial function precede the development of atherosclerotic changes in larger blood vessels, which are the common underlying pathogenetic mechanisms of a large number of diseases affecting all major organs. Endothelial dysfunction should actually be considered as endothelial activation, where there is a switch from nitric oxide mediated vasodilatation and silencing of cellular processes to activation by redox signalling. Prolonged and repeated exposure to vascular risk factors may eventually overwhelm the anti-inflammatory, vasodilatory and antiproliferative effects of normal endothelium and lead to endothelial activation and dysfunction, ultimately leading to loss of endothelial cell integrity, apoptosis and their release into the circulation. Changes in the microvasculature, through its pivotal roles in initiating and perpetuating atherosclerotic diseases in the larger conduit vessels, play an important part in the end organ damage from vascular diseases.
Understanding the importance of the endothelium in health and disease not only affords the opportunity for early detection of diseases in at-risk patients, but also provides a means for risk stratification, development of interventions to prevent disease progression and to alleviate diseases subsequent in the pathophysiological process, and the development of novel techniques to assess response to treatment.
Coronary microvascular dysfunction: clinical scenarios
It is a well known fact that myocardial ischaemia may occur in the absence of overt atherosclerotic diseases in the epicardial coronary vessels demonstrable by coronary angiography. Myocardial ischaemia in these settings is often associated with abnormalities of the coronary microcirculation and, therefore, is thought to be due to coronary microvascular dysfunction. There are four main clinical settings in which coronary microvascular dysfunction may be seen (table 1): (1) microvascular dysfunction without epicardial coronary artery disease (CAD) or myocardial disease; (2) microvascular dysfunction in the presence of myocardial diseases; (3) microvascular dysfunction in the presence of obstructive CAD; and (4) iatrogenic coronary microvascular dysfunction.2
Clinical classification of coronary microvascular dysfunction
Acute coronary syndrome may occur in patients without significant epicardial CAD on coronary angiography. Angina pectoris can occur in patients with normal epicardial coronary arteries and abnormal functional test results. This is referred to as syndrome X or microvascular angina and is more commonly seen in women.w1 Microvascular dysfunction has also been documented in patients with obesity, diabetes, hypercholesterolaemia, hypertension, and in smokers in the absence of myocardial or epicardial CAD. Microvascular dysfunction may be found in cardiomyopathy, in valvular diseases such as aortic stenosis, in patients with heart failure, and in cardiac transplant recipients. Furthermore, it has been suggested that coronary microvascular dysfunction is the final common pathogenetic pathway responsible for disease progression in a range of cardiomyo-pathies.w2 Coronary microvascular dysfunction is thought to be the mechanism underlying the persistence of angina despite successful revascularisation and in patients early after coronary artery bypass surgery. Up to 30% of patients after successful revascularisation had persistent angina, which may support the hypothesis that persistent microvascular dysfunction in these settings contribute to myocardial ischaemia. Coronary microvascular function may also be impaired in patients with epicardial CAD in the non-stenotic vascular bed. Although multiple mechanisms may explain the no reflow or slow reflow phenomenon during acute myocardial infarction (AMI) or percutaneous coronary intervention despite patent epicardial coronary arteries, loss of microvascular integrity is considered the most important.
Several pathophysiological mechanisms, including structural and functional aberrations of the microvasculature as well as extravascular changes, may account for coronary microvascular dysfunction (table 2). Different mechanisms may be important in different clinical scenarios and more than one mechanism may be in play in a particular situation.
Pathogenetic mechanisms of coronary microvascular dysfunction
Coronary microvascular dysfunction: significance
It has been suggested that the presence and the degree of microvascular and endothelial dysfunction are related to the risk of subsequent cardiovascular events.3 4 Although patients with acute coronary syndrome in the absence of significant epicardial CAD have a lower risk of cardiovascular mortality compared with those with obstructive epicardial CAD, their prognosis is not entirely benign, especially when endothelial dysfunction is present.5 Patients with no reflow phenomenon during AMI or percutaneous coronary intervention have worse cardiovascular outcomes compared with those who do not. In a study of patients after successful single vessel angioplasty followed up over a median of 7.7 years, coronary endothelial dysfunction predicted disease progression and adverse cardiovascular events.3 Coronary microvascular function was examined in a mixed group of patients with and without CAD. Endothelial dependent vascular responses, but not endothelium independent responses, in addition to patient age, body mass index, and CAD, were predictive of acute cardiovascular events on follow-up.6 In 157 patients with mild, non-obstructive CAD, all major adverse cardiac events on follow-up, including myocardial infarction, coronary revascularisation or cardiac death, occurred in patients with severe coronary endothelial dysfunction.7
Assessment of coronary microvascular function
As a result of the small size of the coronary microcirculation and the limited resolution of available imaging techniques, direct visualisation and morphological assessment of human coronary microvasculature in vivo is not possible with current techniques. Therefore, assessment is usually based on evaluating its physiological and functional properties.8 Both non-invasive and invasive methods are available (table 3). In general, these techniques may be grouped into three categories: (1) techniques for the assessment of inducible myocardial ischaemia; (2) myocardial perfusion defect; and (3) assessment of response of coronary flow to maximal hyperaemia. In the absence of obstructive epicardial CAD, inducible myocardial ischaemia or myocardial perfusion defect or impaired coronary flow reserve (CFR) may be used as indicators of coronary microvascular dysfunction.
Available methods to assess coronary microvascular function
Theoretical principles of assessment
Indicator or tracer dilution techniques are the principles behind assessment of coronary flow at rest and its response to maximal hyperaemia. In general, an input function (usually in the form of an injected indicator or tracer) is related to an observable output by a transfer function. The indicator used may include (table 3) radioisotopes, x-ray contrast, saline or ultrasound microbubbles, with the nature of the output observable depending on the input indicator. The transfer function usually takes the form of a declining (or rising) exponential, which can be measured, depending on the indicator used, either invasively or non-invasively. Furthermore, the response of the transfer function to maximal hyperaemia is used as a measure of coronary microvascular function.
The coronary microvasculature controls total coronary resistance and is the key to regulating myocardial blood flow. Myocardial blood flow can increase three- to fivefold with maximal vasodilatation, which is predominantly a microvascular function. Measuring the myocardial blood flow during pharmacologically induced maximal hyperaemia is the basis for the non-invasive assessment of coronary microvascular function. Therefore, the term myocardial flow reserve, instead of CFR, is generally preferred. However, most current techniques do not allow measurement of the contribution to total myocardial blood flow by microvasculature in isolation. They measure the total impact on myocardial blood flow by all three main compartments of the coronary circulation.2 In patients with significant epicardial coronary disease, microvascular function cannot be measured independent of the contribution of epicardial coronary arteries to the total coronary resistance by most available techniques.
Non-invasive methods
Coronary microvascular function by single photon emission computed tomography, computed axial tomography, and magnetic resonance imaging
Single photon emission computed tomography (SPECT) stress myocardial perfusion imaging is widely used for non-invasive screening for CAD and can be used to measure relative myocardial blood volume. However, measurement of absolute myocardial blood flow either at rest or at maximal hyperaemia is not possible with this technique. Therefore, SPECT myocardial perfusion imaging is not routinely used to measure myocardial flow reserve. Furthermore, spatial resolution is usually very low and recording time long.
First pass magnetic resonance myocardial perfusion imaging with intravenous gadolinium allows assessment of myocardial blood flow for detection of myocardial ischaemia. Myocardial perfusion defects detected may be due either to epicardial coronary disease or microvascular dysfunction or disruption (figure 1). However, images are usually of low signal at conventional field strength due to the need for rapid acquisition sequences. Cardiac computed tomography (CT) scan with intravenous contrast agents allows quantification of myocardial blood flow with better spatial resolution and shorter acquisition time. However, repeated doses of intravenous contrast are necessary for measurement of myocardial flow reserve. Furthermore, retrospective rather than prospective gating may be necessary for such measurements. Therefore, the high radiation dose necessary will preclude the routine use of CT scanning in assessing coronary microvascular function.
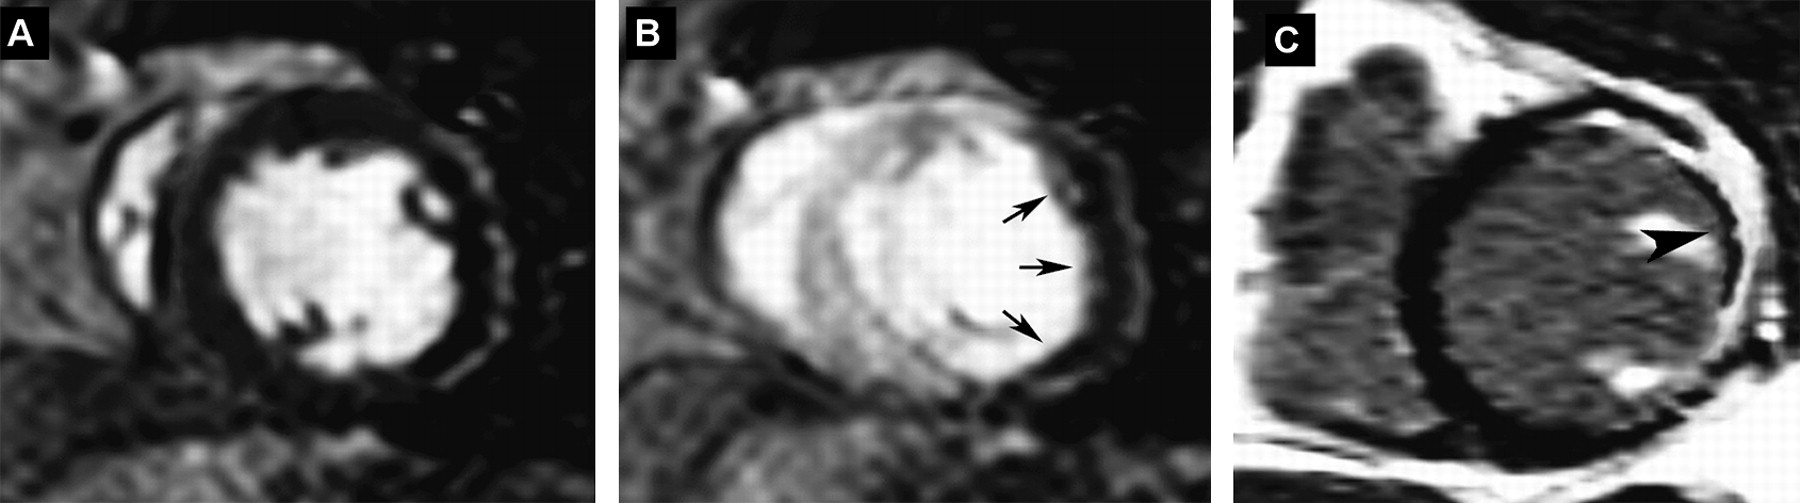
(A, B) First pass magnetic resonance myocardial perfusion imaging with intravenous gadolinium. In panel A gadolinium is seen highlighting both the left and right ventricular cavities. In panel B, left ventricular myocardial opacification is seen in the interventricular septum. However, there is lack of enhancement of a large part of the lateral and posterolateral walls (arrows) indicating lack of myocardial perfusion. Although it can be due to microvascular disease, the transmural nature and the extensiveness of malperfusion is more suggestive of obstructive epicardial disease. (C) Delayed contrast enhancement showing transmural scarring in the lateral wall with microvascular obstruction post-coronary angioplasty of the proximal left circumflex artery. Note the transmural hyper-enhanced areas in the lateral wall indicating non-viable myocardium. There is a layer of hypo-enhanced myocardium (large arrowhead) in the subendocardial region indicating microvascular disruption despite patent epicardial coronary artery. Figure courtesy of Dr Arnold CT Ng.
Coronary microvascular function by positron emission tomography
Positron emission tomography (PET) is considered the current gold standard in the quantification of myocardial blood flow in absolute terms (ml/g/min) using the same indicator dilution principle. Positron emitting substances, such as 82rubidium, 13N-ammonia or 15O-water, are used as tracers (input function) and the output observable is their extraction and retention in the left ventricle while allowing for the natural decay of the radioisotopes, spillover of radioactivity between the myocardium and left ventricular cavity, and partial volume related underestimation. In animal studies, there was good agreement between myocardial blood flow measurement in absolute terms by PET scan with 15O labelled water, 13N-ammonia and that by radiolabelled microspheres.w3 Furthermore, myocardial blood flow measurement by PET scan with 15O labelled water was shown to be reproducible in human controls and the reproducibilities of such measurements with either of the three tracers have been demonstrated to be acceptable for serial measurements.9 PET scanning, with its ability to measure myocardial blood flow in absolute terms and hence the assessment of myocardial flow reserve, has allowed assessment of coronary microvascular function, detection of subclinical CAD, improved characterisation of disease burden, and identification of balanced myocardial ischaemia.9 However, PET scanning is still underutilised in clinical practice and its clinical use is limited to sites with PET scans and cyclotrons or generators.
Coronary microvascular function by echocardiography: Doppler echocardiography
Doppler echocardiography has been used to assess coronary microvascular function by measuring CFR. CFR is a dimensionless index relating the coronary blood flow at maximal hyperaemia to that at basal level. If it can be assumed that the cross sectional area of the epicardial coronary arteries remains unchanged, CFR will be given by the ratio of coronary flow velocity at maximal hyperaemia to that at the basal state. Coronary flow velocities can be measured with Doppler echocardiography.
Coronary flow velocity can be measured either with transthoracic or transoesophageal echocardiography. With the guidance of colour Doppler with the colour aliasing velocities lowered to highlight low velocity flow, the mid to distal part of the left anterior descending artery may be visualised in the modified low parasternal view; the posterior descending artery may be visualised in a modified apical two chamber view; and the left circumflex artery may be seen in the apical four chamber view. However, the image quality of the coronary flow obtained with transthoracic echocardiography is often suboptimal and the technique can be challenging. The use of high frequency transducers, second harmonics imaging, and intravenous echo contrast has helped to improve the feasibility of measuring CFR with transthoracic echocardiography. The mid to distal left anterior descending artery has traditionally been the most commonly interrogated artery with transthoracic echocardiographic examination of CFR. CFR measured with transthoracic stress echocardiography has been found to correlate well with CFR measured invasively with Doppler flow wires and other techniques.10 With transoesophageal echocardiography, the left main coronary artery, proximal parts of the left anterior descending artery (figure 2), the left circumflex artery (figure 3), and the right coronary artery can be imaged. However, only the proximal part of the left anterior descending or circumflex arteries may be reliably interrogated with pulsed wave Doppler to obtain blood flow velocity (figure 3).

Visualisation of the proximal left coronary artery with transoesophageal echocardiography (left panel). With the colour aliasing velocity on colour Doppler lowered to highlight low velocity flow (right panel), coronary artery flow in the proximal left anterior descending artery (LAD) can be visualised where alignment with the Doppler beam is satisfactory for interrogation of the coronary flow. Flow in the left circumflex artery (LCx) is visualised as red flow towards the transducer. AO, ascending aorta; LA, left atrium.

With rotation of the transducer, the left circumflex artery flow may be aligned for pulsed wave Doppler examination of coronary flow. Note the predominantly diastolic flow characteristic of coronary artery flow.
Coronary flow is a biphasic flow with diastolic predominance, and obtaining the full spectral display throughout the whole cardiac cycle may not always be possible due to cardiac motion. CFR is usually calculated as the ratio of peak diastolic flow velocity with maximal hyperaemia to the peak diastolic velocity at basal state. However, both the time–velocity integral and the average velocity of coronary flow by pulsed waved Doppler have been used to calculate CFR. Although intravenous dobutamine and dipyridamole have been used as vasodilators to induce maximal hyperaemia, intravenous adenosine is the most widely utilised agent due to its ease of use and very short half-life.
As mentioned earlier, the use of CFR as an indicator of coronary microvascular function is contingent upon the absence of epicardial coronary stenosis. Therefore, without first excluding epicardial coronary disease, CFR measured with Doppler echocardiography cannot be used to measure only the coronary microvascular function. Furthermore, even in the absence of significant epicardial coronary artery stenosis, the traditional cut-off value of a CFR <2 cannot be used interchangeably to indicate impaired coronary microvascular function. Another drawback of CFR—being a ratio—as a measure of coronary microvascular function is that it is very dependent on the flow velocities at the basal state. Flow velocities at the basal state are very much affected by factors such as the presence of traditional vascular risk factors, food intake, hormonal status, concomitant medications, and age. Therefore, CFR as a measure of coronary microvascular function may be more suited to assessing response to an intervention or following progress in a patient than to comparing results across patients.
Coronary microvascular dysfunction as assessed by CFR and measured with transthoracic echocardiography has been shown to be of prognostic value in patients with non-ischaemic dilated cardiomyopathy. In a study of 129 patients with dilated cardiomyopathy and normal epicardial coronary arteries, a CFR ≤2 by transthoracic dipyridamole stress echocardiography was an independent predictor of death or spontaneous disease progression over a median follow-up period of 22 months.11 In a group of 1130 patients with known or suspected CAD, but with normal dipyridamole stress echocardiography by wall motion criteria, a CFR ≤2 (found in 27% of patients) was also found to be an independent predictor of death or myocardial infarction over a relatively short follow-up period of 16 months.12
Coronary microvascular function by echocardiography: myocardial contrast echocardiography
Contrast echocardiography with microbubbles has been used to evaluate myocardial perfusion and hence to measure CFR. Echo contrast agents are commercially available microbubbles of inert gases of sizes and rheology similar to that of red blood cells and can be administered intravenously. Since the microbubbles stay within the vascular space, the intensity of the echo signals reflects the concentration of the microbubbles in the vascular space. Therefore, myocardial perfusion can be measured by plotting the intensity–time curve at the myocardium of interest.
Successful myocardial contrast echocardiography (MCE) depends on both the contrast agents and the techniques used to visualise the small amount of microbubbles in the myocardium. Intermittent high mechanical index imaging (>1.0) gated to the ECG was initially used in MCE. The technique is challenging as respiratory and transducer movement in between images may result in significant image shifts and some form of background subtraction is usually necessary. ‘Destruction–replenishment’ imaging with continuous intravenous infusion of echo contrast is currently the preferred method. It is achieved by continuous low mechanical index (<0.2) imaging with a transient high mechanical index ‘flash’ to destroy all the microbubbles in the myocardium (figure 4). The rate of replenishment is then measured as the increase in image intensity with time at the region of interest (figure 5).

Low mechanical index continuous imaging with myocardial contrast echocardiography. (A) Echo contrast is slowly infused intravenously so that there is left ventricular as well as myocardial opacification. (B) A high mechanical index flash is delivered to destroy microbubbles accumulated in the myocardium. (C) Immediately after the flash and (D) later after the flash, increasing myocardial opacification is seen with time, which can be measured.

Myocardial contrast echocardiography. An area of interest is drawn in the interventricular septum, with the resulting time–intensity curve taking the shape of a rising exponential starting from low levels immediately after the high mechanical index flash is delivered.
The intensity–time curve of myocardial contrast can be approximated by an exponential function:
where A (in decibels) is the plateau intensity and β (s-1) is the rate of increase in intensity and represents microbubble velocity. The plateau intensity (A) reflects non-linearly to myocardial blood volume, and the product, Aβ (in decibels/s), approximates myocardial blood flow and has been found to correlate well with invasive measurements in humans (figure 6).

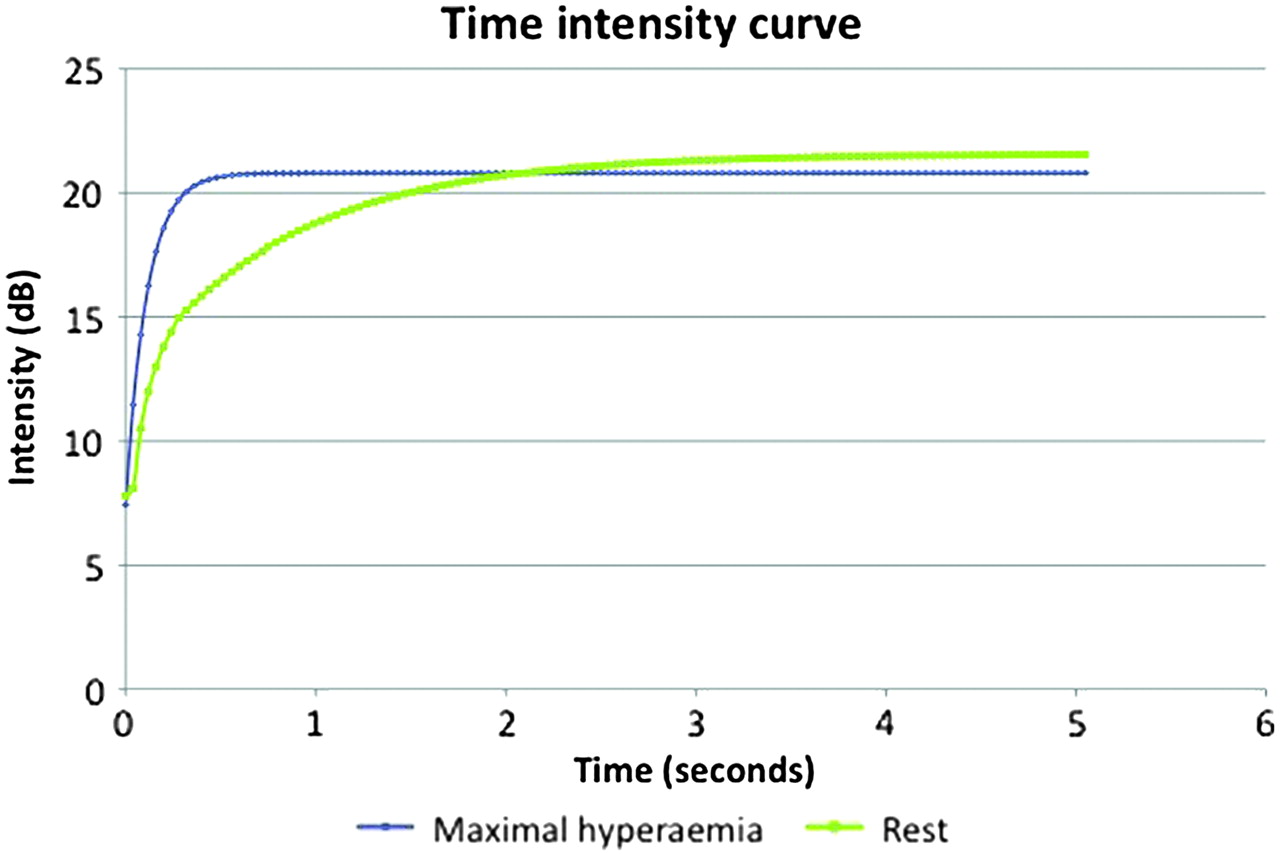
The resulting time–intensity curves at rest and at maximal hyperaemia with myocardial contrast echocardiography. The rate of rise of the time–intensity curve at maximal hyperaemia is more rapid than the resting curve.
This is an illustration of the basic principles of indicator dilution techniques behind assessment of coronary microvascular function. The input function is an intravenous infusion of microbubbles and the ‘flash’ destruction of microbubbles in the myocardium, and the output observable is the echodensity of the myocardium due to the appearance of microbubbles in the coronary microcirculation, whereas the transfer function takes the form of a rising exponential.
Thus, the measured myocardial blood volume is an indicator of the integrity and density of the microvasculature as the microbubbles remain entirely within the vascular space. The ratio of β during maximal hyperaemia to that at rest provides an approximation of CFR. More recently, absolute myocardial blood flow, in ml/min/g, has been measured by MCE in a volumetric model and has been validated against PET.13
In the clinical scenario of iatrogenic coronary microvascular dysfunction, MCE is useful in assessing microvascular integrity. Coronary microvascular dysfunction is thought to be an important mechanism associated with no reflow or slow reflow despite patent epicardial coronary arteries. Successful myocardial reperfusion is dependent on the integrity of the coronary microvasculature in addition to patency of the infarct related artery. MCE allows assessment of myocardial perfusion and hence, in the presence of a patent infarct related artery, any perfusion defect in the myocardium subtended by the artery is indicative of loss of microvascular integrity and microvascular dysfunction. Due to its high spatial resolution, MCE allows the assessment of the spatial extent of no reflow, which has been shown to correlate with the infarct size and outcome.w4 However, the extent of no reflow on MCE immediately after reperfusion may underestimate the final infarct size due to reactive hyperaemia. It is thought that 48 h post reperfusion is the suitable time to assess infarct size by contrast echocardiography as any dynamic changes will have subsided and the extent of no reflow correlates better with infarct size then. The region of no-reflow on MCE corresponds to the region of infarction and therefore scarring and lack of viability. Myocardial perfusion defect size as an indicator of microvascular function as assessed by MCE after successful reperfusion of ST elevation myocardial infarction was found to be a powerful predictor of left ventricular function on follow-up.w5
Invasive methods
Coronary microvascular function can be assessed invasively in the cardiac catheterisation laboratory with the use of either a Doppler flow wire or a temperature and pressure sensor tipped coronary wire inserted into the coronary artery. It can also be assessed by TIMI (Thrombolysis in Myocardial Infarction) frame count or myocardial blush score; both of these measures tend to be used in the setting of AMI or after successful reperfusion. Invasive methods have an added advantage of being able to confirm the lack of epicardial CAD during the assessment of coronary microvascular function.
A high frequency (14 MHz) intracoronary Doppler flow wire can be inserted into the proximal part of the coronary artery to allow the measurement of CFR. Both intracoronary and intravenous injection of adenosine or other stressors have been used to induce hyperaemia to measure CFR. However, with this technique, only velocity but not flow can be measured. Another limitation in the measurement of CFR is its high test–retest variability and sensitivity to haemodynamic changes, mostly due to the variability in the baseline flow velocity. CFR can change significantly with changes in heart rate and contractility, independent of changes in microvascular function, as a result of changes in baseline velocities. In some studies, the coefficient of variation of CFR measurements may be up to 20%.
Index of microcirculatory resistance
As pre-arterioles and arterioles, rather than the large conduit epicardial coronary arteries, are responsible for most of the resistance to coronary flow, a measure of the resistance of the former will give an indication of their function. Microvascular or microcirculatory resistance is derived by the pressure drop across the microcirculation divided by flow. With maximal hyperaemia, the pressure in the distal epicardial coronary artery (proximal to the microcirculation) can be assumed to be the pressure drop, given that the pressure distal to the microcirculation can be assumed to be zero. However, absolute coronary flow cannot be easily measured in the catheterisation laboratory and, therefore, true microcirculatory resistance cannot be measured in the clinical setting. The transit time can be measured by intracoronary thermodilution and has been found to correlate well with coronary flow.14 15 CFR can be measured as the ratio of the transit time at rest to that at maximal hyperaemia. Similarly, intracoronary thermodilution is another illustration of the indicator dilution principle where the input function is a bolus injection of cold saline and the output observable is a change in the temperature distal to the site of injection.
An index of microcirculatory resistance (IMR) has been proposed and can be measured with a dual temperature and pressure sensor tipped coronary wire (Radi Medical Systems, St Jude Medical, St Paul, Minnesota, USA). IMR is obtained by the product of distal coronary pressure and transit time at maximal hyperaemia by intracoronary thermodilution (figures 7 and 8) and is found to correlate well with true microvascular resistance measured in an animal model.16

Evaluation of index of microcirculatory resistance (IMR) with a dual temperature and pressure sensor tipped coronary wire in a patient with normal coronary microvascular function. At maximal hyperaemia with intravenous adenosine infusion, the mean proximal pressure (Pa mean) was 103 mm Hg and the mean distal pressure (Pd mean) was 93 mm Hg, corresponding to a fractional flow reserve of 0.9, signifying the lack a haemodynamically significant epicardial coronary stenosis. Note the intracoronary thermodilution curves obtained by rapid injections of 3 ml of saline at room temperature proximally. The mean transit time at basal state (Bas) was 0.39 s and the mean transit time with maximal hyperaemia (Hyp) was 0.13. The coronary flow reserve was 3, which was given by the ratio of the transit time at basal state to that at maximal hyperaemia. IMR is given by the product of the distal pressure and the transit time at maximal hyperaemia. In this case, it was 93×0.13=12.09, indicating normal microvascular function.

Evaluation of index of microcirculatory resistance (IMR) with a dual temperature and pressure sensor tipped coronary wire in a patient with coronary microvascular dysfunction. In this example, please note a fractional flow reserve of 0.85 and coronary flow reserve of 1.8. The mean transit time at rest was 0.72 s and at maximal hyperaemia was 0.4. IMR was 28.8 units, signifying slightly impaired microvascular function.
Unlike CFR measurements, IMR is associated with much lower variability and is not significantly affected by changes in haemodynamic conditions.17 Another advantage of IMR measurement is that microvascular function can be assessed in the presence of epicardial CAD. As the distal coronary pressure falls with proximal epicardial coronary stenosis, the transit time lengthens, therefore IMR is relatively unchanged.18 Furthermore, fractional flow reserve can also be measured and can further help to distinguish epicardial coronary disease from microvascular dysfunction.
IMR immediately after successful primary angioplasty for AMI has been found to be predictive of myocardial viability and recovery of left ventricular function at 6 months follow-up.w6 In a study of 29 patients with acute ST elevation myocardial infarction undergoing primary angioplasty, the peak creatinine kinase was found to correlate with IMR measured immediately after successful angioplasty, but not with other measures of microvascular dysfunction including CFR and TIMI frame count. Only IMR correlated significantly with measures of left ventricular function at 3 month follow-up.19 Therefore, it can be seen that IMR provides a relatively simple measurement in the catheterisation laboratory of coronary microvascular function, which has clinical utility in the acute setting as well as serving as a predictor of longer term outcome.
TIMI frame count and myocardial blush score
The myocardial blush grade (or TIMI myocardial perfusion grade) is a visual assessment of myocardial reperfusion, usually after reperfusion therapy for AMI.20 The score has been found to be an independent predictor for adverse outcomes. However, its subjective nature, need for an experienced observer, and lack of reproducibility has limited its widespread use. Corrected TIMI frame count is the number of cine frames needed for the intracoronary contrast to reach standardised specific distal landmarks of a coronary artery, usually an infarct related artery in the setting of AMI.21 It allows standardisation of TIMI flow grades and facilitates comparisons of angiographic data between trials. Reduction in flow early after successful reperfusion in the infarct related arteries and also the non-culprit vessels was found to be due to coronary microvascular dysfunction. Both myocardial blush score and corrected TIMI frame count have been used to evaluate the use of distal protection devices, thrombectomy devices, pharmacological approaches, and success of tissue reperfusion in the setting of AMI. However, myocardial blush score and TIMI frame count give, at best, a semiquantitative assessment of coronary microvascular function and do not allow quantitative measurement of flow, flow velocities or myocardial blood volume. Both myocardial blush score and TIMI frame count utilise the indicator dilution principle where the input function is an intracoronary injection of x-ray contrast and the output observable is opacification of the myocardium supplied and the appearance of contrast in the distal coronary artery, respectively.
Measurement of peripheral endothelial function as surrogates
As endothelial dysfunction is a systemic process, assessment of endothelial function in the peripheral circulation may be used as a surrogate of coronary endothelial function. This approach is attractive as it is less invasive, and good correlation has been demonstrated between responses to acetylcholine in the coronary circulation and in the forearm vessels.22 The most widely adopted technique is the assessment of flow mediated dilatation of the brachial artery.w7 With high frequency ultrasound transducers, the diameter of the brachial artery can be measured under different haemodynamic states. Both endothelial dependent (post-ischaemic hyperaemic flow after forearm occlusion with sphygmomanometer cuff) and endothelium independent (glyceryl trinitrate) dilatation of the brachial artery can be studied to give an indication of endothelial function. Flow mediated dilatation of the brachial artery as a measure of endothelial function has been adopted widely in the serial evaluation of the impact of risk factor modification, lifestyle changes, and pharmacologic intervention on endothelial function. Its non-invasiveness also permits its use in the paediatric population where endothelial dysfunction may be detected in the absence of established vascular diseases. Other techniques such as venous occlusion plethysmography, laser Doppler fluximetry or measurement of circulating markers of endothelial function have been developed, but their discussion is beyond the scope of this article.
Conclusions
Although the coronary microcirculation cannot be imaged clinically, its importance is firmly established. It is where the earliest manifestations of vascular diseases occur, and its function can be adversely affected by the mere presence of vascular risk factors. Early coronary microvascular dysfunction may be reversible with risk factor modification, and it has been found to be of prognostic value in a wide range of cardiovascular diseases. Coronary microvascular dysfunction can be assessed invasively and non-invasively utilising, in general, indicator dilution techniques. Our ability to assess coronary microvascular function has opened up new opportunities to detect early dysfunction and may allow early intervention before irreversible changes set in. Furthermore, assessment of coronary microvascular function may refine risk stratification, allow monitoring of response to treatment and, perhaps more importantly, open new windows for possible therapeutic intervention. Although routine assessment of coronary microvascular function in all patients may not be possible or advisable, the judicious use of techniques mentioned in this article to measure coronary microvascular function in appropriate clinical situations may further enhance patient care and improve outcome.
Coronary microvascular dysfunction: key points
Microvascular function is pivotal in controlling blood flow to end organs and plays a key role in vascular haemostasis.
Microvascular function is an important prognostic factor in a wide range of diseases.
Microvascular dysfunction can be seen in the absence of overt diseases in conduit arteries.
Microvascular dysfunction can be detected in the presence of vascular risk factors and may be reversible on lifestyle modification and treatment of risk factors.
Coronary microvascular dysfunction may lead to myocardial ischaemia, the classical example being syndrome X.
Coronary microvascular dysfunction can be present in different clinical scenarios.
Visualisation of coronary microcirculation is not possible with current imaging techniques.
Assessment of coronary microcirculation depends on the assessment of its functional aspects.
Both invasive and non-invasive methods are available to assess coronary microvascular function.
Methods of assessment of coronary microvascular function generally utilise the principles of indicator or tracer dilution.
Most available methods do not assess coronary microvascular function in isolation. They assess the total impact of both epicardial coronary disease and microvascular dysfunction on coronary flow.
Index of microcirculatory resistance is a novel index measured with a temperature and pressure sensor tipped coronary wire. It can be used in the presence of epicardial coronary disease.
Assessment of coronary microvascular function may allow early identification of at risk patients, monitoring of treatment or open new therapeutic intervention.
You can get CPD/CME credits for Education in Heart
Education in Heart articles are accredited by both the UK Royal College of Physicians (London) and the European Board for Accreditation in Cardiology—you need to answer the accompanying multiple choice questions (MCQs). To access the questions, click on BMJ Learning: Take this module on BMJ Learning from the content box at the top right and bottom left of the online article. For more information please go to: http://heart.bmj.com/misc/education.dtl
RCP credits: Log your activity in your CPD diary online (http://www.rcplondon.ac.uk/members/CPDdiary/index.asp)—pass mark is 80%.
EBAC credits: Print out and retain the BMJ Learning certificate once you have completed the MCQs—pass mark is 60%. EBAC/ EACCME Credits can now be converted to AMA PRA Category 1 CME Credits and are recognised by all National Accreditation Authorities in Europe (http://www.ebac-cme.org/newsite/?hit=men02).
Please note: The MCQs are hosted on BMJ Learning—the best available learning website for medical professionals from the BMJ Group. If prompted, subscribers must sign into Heart with their journal's username and password. All users must also complete a one-time registration on BMJ Learning and subsequently log in (with a BMJ Learning username and password) on every visit.
References
- ↵
Key reference in the discussion of endothelial function and dysfunction in general.
- ↵
This is the landmark review paper on coronary microvascular dysfunction, especially on the clinical scenarios where coronary microvascular dysfunction may be seen.
- ↵
- ↵
- ↵
- ↵
- ↵
- ↵
A comprehensive review of methods for assessing coronary microvascular function.
- ↵
- ↵
- ↵
- ↵
- ↵
- ↵
A landmark paper on a novel technique.
- ↵
- ↵
A landmark paper on a novel concept with wide applications.
- ↵
Study demonstrating a much lower variability for IMR than for CFR.
- ↵
- ↵
- ↵
- ↵
- ↵
Supplementary materials
Supplementary Data
This web only file has been produced by the BMJ Publishing Group from an electronic file supplied by the author(s) and has not been edited for content.
Files in this Data Supplement:
- Data Supplement - Manuscript file of format pdf
Footnotes
Competing interests In compliance with EBAC/EACCME guidelines, all authors participating in Education in Heart have disclosed potential conflicts of interest that might cause a bias in the article. The authors have no competing interests.
Provenance and peer review Commissioned; internally peer reviewed.