Article Text

Abstract
Background The diagnosis of cardiac amyloidosis (CA) is challenging owing to vague symptomatology and non-specific echocardiographic findings.
Objective To describe regional patterns in longitudinal strain (LS) using two-dimensional speckle-tracking echocardiography in CA and to test the hypothesis that regional differences would help differentiate CA from other causes of increased left ventricular (LV) wall thickness.
Methods and results 55 consecutive patients with CA were compared with 30 control patients with LV hypertrophy (n=15 with hypertrophic cardiomyopathy, n=15 with aortic stenosis). A relative apical LS of 1.0, defined using the equation (average apical LS/(average basal LS + mid-LS)), was sensitive (93%) and specific (82%) in differentiating CA from controls (area under the curve 0.94). In a logistic regression multivariate analysis, relative apical LS was the only parameter predictive of CA (p=0.004).
Conclusions CA is characterised by regional variations in LS from base to apex. A relative ‘apical sparing’ pattern of LS is an easily recognisable, accurate and reproducible method of differentiating CA from other causes of LV hypertrophy.
- Cardiac amyloidosis
- 2D speckle tracking echocardiography
- myocardial strain
- cardiac function
- cardiac remodelling
- diastolic dysfunction
- hypertension
- hypertensive heart disease
- imaging and diagnostics
- echocardiography
- CT scanning
- MRI
- myocardium
- myocardial function
- diastolic function
- ventricular function
- heart failure
- heart failure treatment
- heart failure with normal ejection fraction
- EBM
- contrast echocardiography
- tissue Doppler
- stress echocardiography
- Doppler
- echocardiography (three-dimensional)
- Doppler ultrasound
Statistics from Altmetric.com
- Cardiac amyloidosis
- 2D speckle tracking echocardiography
- myocardial strain
- cardiac function
- cardiac remodelling
- diastolic dysfunction
- hypertension
- hypertensive heart disease
- imaging and diagnostics
- echocardiography
- CT scanning
- MRI
- myocardium
- myocardial function
- diastolic function
- ventricular function
- heart failure
- heart failure treatment
- heart failure with normal ejection fraction
- EBM
- contrast echocardiography
- tissue Doppler
- stress echocardiography
- Doppler
- echocardiography (three-dimensional)
- Doppler ultrasound
Background
Cardiac amyloidosis (CA) is an infiltrative cardiomyopathy characterised by deposition of β-pleated fibrils in the myocardium and usually portends a poor prognosis.1 The diagnosis is challenging and relies on a high degree of clinical suspicion, a combination of imaging techniques and often an endomyocardial biopsy.2 Symptoms early in the disease course are vague and non-specific, which often leads to a delay in diagnosis. Echocardiography remains the preferred imaging study for the initial assessment of cardiac involvement; however, findings suggestive of CA, such as increased wall thickness, impaired systolic and diastolic function and reduced myocardial tissue velocities, are regularly attributed to more prevalent pathologies.
More contemporary echocardiographic techniques play an adjunctive role in the diagnosis of CA.3 Specifically, strain and strain rate imaging parameters obtained by tissue Doppler techniques have been shown to be significantly reduced in primary amyloidosis with cardiac involvement in comparison with patients without cardiac involvement.4 Furthermore, two-dimensional (2-D) speckle tracking of global radial, circumferential and longitudinal strain (LS) analysis can help to differentiate CA from hypertensive heart disease and hypertrophic cardiomyopathy (HCM). However, the specificity of this technique is diminished because any myopathic process can result in a reduction in global strain parameters. Patients with left ventricular hypertrophy (LVH) or HCM and impaired left ventricle (LV) systolic function may have reduced global strain in the same range as patients with CA, making it difficult to differentiate these entities solely on the basis of this measurement.
In our echocardiography laboratory, a pattern of regional differences in LS of the LV has been noted among patients with CA. The aims of this study were (1) to describe the pattern of regional LS in patients with CA using 2-D speckle-tracking echocardiography and (2) to assess whether this pattern is specific to CA and helps to differentiate patients with CA from patients with other causes of increased LV wall thickness.
Patients and methods
Patient population
This was a case–control study involving consecutive patients referred to the Cleveland Clinic Foundation (CCF) echocardiography laboratory with a presumptive diagnosis of CA between October 2010 and March 2012. Study patients were identified from the echocardiography database using the search term ‘amyloid’ and its variants and from a clinical database maintained at our local amyloid outpatient clinic. Medical records of all these patients were reviewed to confirm the diagnosis of CA. A confirmatory diagnosis consisted of either (1) an endomyocardial biopsy consistent with CA,5 or (2) a positive non-cardiac biopsy for amyloidosis and cardiac magnetic resonance imaging (CMR) with classic features,6 or (3) a positive non-cardiac biopsy with characteristic non-strain-based echocardiographic parameters together with a consistent clinical history and ECG findings.5 As the clinical challenge relates to the correct identification of amyloidosis among the larger group of patients with LVH, as comparator groups, we identified 30 patients matched for mean LV wall thickness: 15 patients with HCM and 15 patients with aortic stenosis (AS). Consecutive patients were identified using the echocardiographic database over a 1-month period using the search terms, ‘HCM’, ‘severe aortic stenosis’ and their variants. In addition, patients had to have had a clinic visit with a cardiologist at the CCF with confirmation of the diagnosis.
Among these patients, only those who had an echocardiogram performed on a Vivid 7 or Vivid 9 ultrasound system (GE Medical, Milwaukee, Wisconsin, USA) with adequate-quality 2-D images were included. Only patients with studies done on the GE systems were included as only such images are amenable to speckle-tracking-based strain assessment. Adequate 2-D quality was defined as absence of dropout or artefacts and inadequate visualisation of no more than two segments. The study protocol was approved by the institutional review board of the CCF.
Echocardiography
The complete echocardiogram was reviewed for each included patient with the following measurements prospectively performed according to the American Society of Echocardiography (ASE) guidelines7: ejection fraction (EF) using the biplane Simpson's method from apical two- and four-chamber windows, left atrial volume index using a biplane area–length formula, end-diastolic interventricular septal (IVS) and posterior wall (PW) thickness and LV internal dimension in diastole. LV mass index was calculated based on modelling the LV as a prolate ellipse.7 Mean LV wall thickness was calculated as (IVS+PWT)/2. Diastolic parameters, including peak early (E) and late (A) diastolic mitral inflow velocity and its ratio (E/A), deceleration time (DT) and average of the medial and lateral mitral annular diastolic velocities (e'), were also measured according to ASE guidelines.8
LS measurements were performed offline using automated software (EchoPAC Version 110.0.0. Advanced Analysis Technologies; GE Medical Systems) as described previously.9 In brief, using three standard apical views, the LV endocardium was manually identified and tissue speckles were automatically tracked frame by frame throughout the cardiac cycle. A ‘bull's-eye’ plot illustrating segmental LS values was automatically generated (figure 1). Strain analysis was deemed unacceptable if two or more segments did not track adequately after two manual adjustments of the endocardial borders. Strain values from all segments were averaged to obtain a global LS value. Also, the strain values for the six basal, six mid and six apical segments of the LV were averaged to obtain three ‘regional’ LS values. The apex-to-base gradient in regional LS was examined using absolute strain values as well as a relative apical LS calculated as:
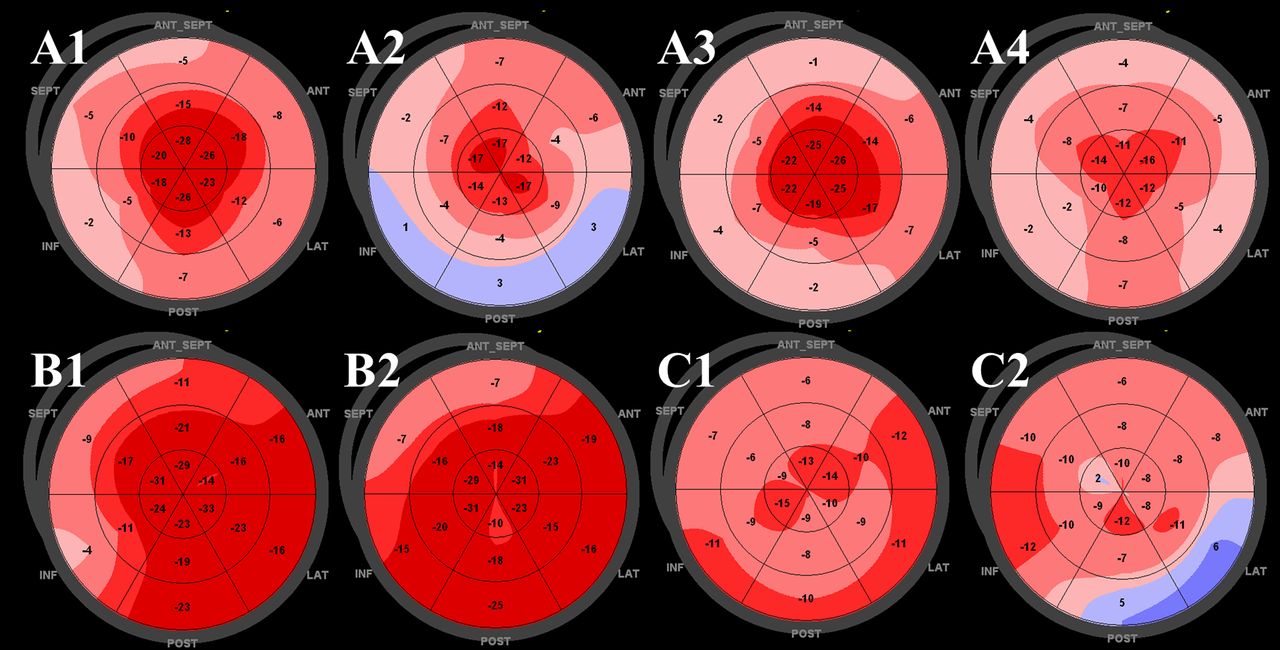
Representative two-dimensional speckle-tracking longitudinal strain patterns (‘bull's eye plots’) for each subgroup. (A1–4) Apical sparing pattern in patients with cardiac amyloidosis. (B1,2) Isolated impairment of septal longitudinal strain (LS) in septal hypertrophic cardiomyopathy. (C1,2) Patchy reduction in longitudinal strain in left ventricular hypertrophy related to aortic stenosis.
Electrocardiograms
ECGs were available in 98% of patients. Low voltage was defined as QRS amplitude of ≤0.5 mV in all limb leads or ≤1 mV in all precordial leads. A pseudoinfarct pattern was defined as the presence of Q waves in two consecutive leads in patients with documented normal coronary arteries, or non-occlusive coronary artery disease without a history of myocardial infarction.10 ECGs were read by an experienced reader who was blinded to the underlying diagnosis.
Cardiac magnetic resonance
CMR imaging was used to assess the potential mechanism for the apical sparing seen with strain analysis. Patients with CA who had CMR imaging as part of their clinical investigation were identified. All CMR studies were performed on a 1.5T Philips Achieva System (Andover, Massachusetts, USA), using an eight-channel surface cardiac coil. Balanced steady-state free precession cine images were obtained in three long-axis planes (horizontal, vertical and three-chamber) and 8–12 contiguous short-axis planes to cover the LV using segmented breath-hold acquisitions and the following parameters: inplane resolution of 2.0×1.8 mm, slice thickness of 8 mm, TR/TE of 2.8/1.4 and flip angle of 60 degrees. Cine images were analysed using Syngo imaging (Siemens AG Medical Solutions (Malvern, Pennsylvania, USA)).
All CMR results were read by an experienced reader (PT) blinded to the underlying pathology of the patients. The LV wall motion was quantified using a visually scored 17-segment LV model, where 1=normal, 2=hypokinetic, 3=akinetic, 4=dyskinetic and 5=aneurysmal. The six basal segments, six mid-segments and five apical segments were averaged at each level and differences between levels were assessed in both pathologies. LV wall thickness was measured in end-diastole in 16 of the 17 standard segments in short-axis views. CMR was used for this analysis as it has better signal-to-noise and contrast-to-noise ratios than echocardiography. In addition, normal reference values for regional wall thickness were recently published for comparison.11
Statistical methods
Summary statistics are presented as mean ± SD or median and 25–75th centiles for continuous data and as frequencies for categorical data. All data were first tested for normal distribution using the Kolmogorov–Smirnov test. Comparisons across multiple groups were performed using one-way analysis of variance for parametric data and Kruskal–Wallis test for non-parametric data with post hoc analysis using Bonferroni correction. Our comparisons consisted of the CA group versus AS and HCM group separately, then the CA group versus a combination of the patients with AS and HCM referred to as the LVH group. Comparisons between two groups were made using independent samples t test or the Mann–Whitney rank sum test. To assess the differences between groups in regional strain measured at different levels of the LV (base, mid and apex), we applied a linear mixed effects model with unstructured covariance for random effects, with LV level (base, mid, or apex) as a covariate and groups (CA, HCM, AS) as fixed effects. This approach allowed for longitudinal assessment of repeatedly measured data within the same individuals that were not bound by a specific structure of variance/covariance matrix. We assessed the impact of LV level and the aetiology of cardiac disease on LS among patients. The model used was: E(Yij│bi) = B1 + B2levelij + B3Group + B4Group×levelij + b1 + b2levelij where B1…n denotes fixed effects, b1…n denotes random effects, leveli denotes LV level and j denotes type of pathology, with contrasts set to compare CA with other patient groups. The difference between groups was tested by Wald statistics. The Akaike criterion was used to assess model comparisons. The sensitivity and specificity of relative apical LS for the diagnosis of CA was assessed using receiver operating characteristic (ROC) curves. Comparison ROC curves were derived to compare the area under the curve (AUC) with relative apical LS versus other techniques used to diagnose CA. To assess if relative LS had a predictive value additional to that of standard markers for detection of amyloid heart disease, we performed both forward and backward logistic regression with multiple covariates and the diagnosis of amyloid as the outcome variable. Interobserver variability for strain measurements was performed in 16 randomly chosen patients (272 segments) by two reviewers (DP, JCP) blinded to each other's measurement and the clinical diagnosis. These measurements were also repeated by one reviewer (DP) blinded to the first measurement and the clinical diagnosis 1 month later for intraobserver variability. Reproducibility was assessed using Bland and Altman analysis for 272 segments.
A p value of <0.05 was considered statistically significant. All statistical analysis was performed using MedCalc Version 11.4.2.0 and SPSS V.18.0.3 (SPSS Inc).
Results
Patient population
The final study population consisted of 55 patients with a confirmed diagnosis of CA, 15 with HCM and 15 with AS. Of note, two patients with CA, three patients with HCM and four patients with AS were previously excluded based on inadequate speckle tracking. An endomyocardial biopsy proven diagnosis was available in 43/55 (78%) patients with CA. Of the remaining 12 patients, seven (13%) were diagnosed by a positive non-cardiac biopsy for amyloidosis with characteristic features on CMR while five (9%) had a positive non-cardiac biopsy for amyloidosis together with moderately increased LV wall thickness without a history of hypertension and a low voltage QRS on ECG. The baseline characteristics of the study groups are described in table 1. The CA group was generally more symptomatic with higher heart rates and lower systolic blood pressure than the control groups.
Clinical characteristics
Electrocardiographic and non-deformation echocardiographic parameters
Echocardiographic and electrocardiographic parameters are presented in table 2. Only 38% of patients with CA had a low voltage ECG while 29% had a pseudoinfarct pattern. The groups were well matched for mean left ventricular wall thickness. Patients with CA displayed typical features such as a reduction in EF, increased wall thickness and advanced diastolic dysfunction.
Echocardiographic and electrocardiographic characteristics
Absolute longitudinal strain
Visual representative examples of ‘apical sparing’ in four patients with CA are illustrated in figure 1 (panel A1–4). This pattern of apical sparing was consistently seen in all patients with CA. Representative plots for patients in the two control groups are also shown (panels B1,2 and C1,2). Of note, in patients with HCM the reduction (in absolute value/less negative) in the basal and mid-ventricular regional LS was typically due to a focal marked reduction in LS in the septum, while strain in the remaining walls was normal. This was in contrast to patients with CA where the majority of (or all) segments in the basal and mid-ventricular regions had reduced LS.
Mixed model analysis confirmed that patients with CA had lower global LS than patients with HCM or AS (p<0.001). Although an apex to base gradient in average absolute regional LS was found in all groups (figure 2), mixed model analysis showed that the gradients were higher in patients with CA than in patients with AS (p<0.001), with no difference seen between the CA and HCM groups (p=0.33). However, average regional LS values at all three ventricular levels were significantly higher in the HCM group than in the CA group (p<0.001 for all regions).

Differences in regional longitudinal strain (LS) between groups. Line graphs representing differences in regional LS with the left ventricle divided into three distinct sections—base, mid and apical regions. CA, cardiac amyloidosis; HCM, hypertrophic cardiomyopathy; LVH, left ventricular hypertrophy.
Relative apical longitudinal strain
The relative apical LS (average apical LS/(average basal LS + average mid-LS) was significantly higher in CA than in all other groups (p=0.001).
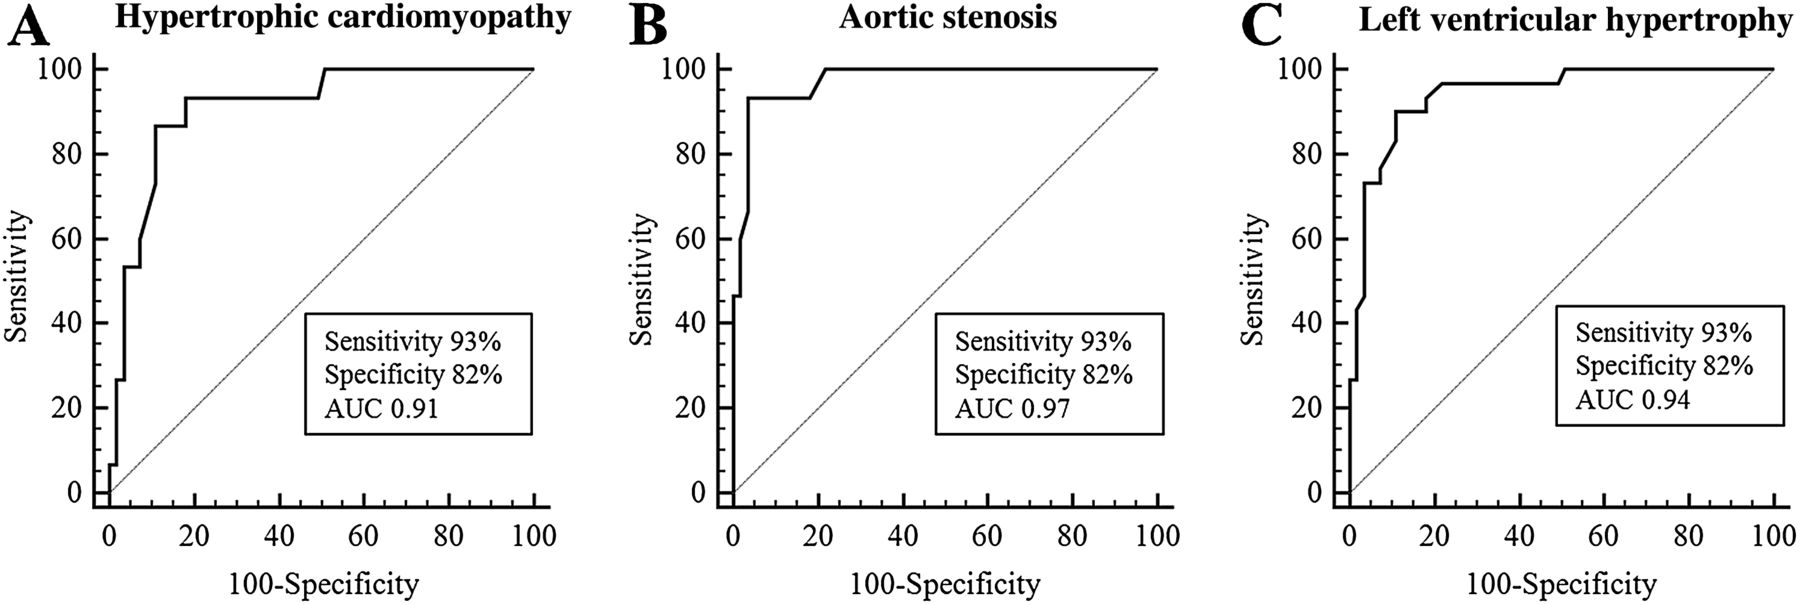
“ROC analysis showed an optimal cut-off value of 1 for the relative apical LS to differentiate CA from HCM (sensitivity 93%, specificity 82%, AUC 0.91), CA from AS (sensitivity 93%, specificity 82%, AUC 0.97) and CA from LVH (sensitivity 93%, specificity 82%, AUC 0.94) (figure 3). This represents significantly higher strain values at the apex compared with the sum of the average LS from the basal and mid-segments.

Receiver operating characteristic curves of relative longitudinal strain for the detection of cardiac amyloidosis. Receiver operating characteristic curves using a cut-off value of 1 for the relative longitudinal strain to differentiate cardiac amyloidosis from (A) hypertrophic cardiomyopathy, (B) aortic stenosis and (C) left ventricular hypertrophy. AUC, area under the curve.
Comparison of ROC curves for detecting CA showed that the AUC using relative apical LS was significantly larger than the other more traditional echocardiographic parameters used for diagnosing CA, including DT (AUC=0.72, p<0.001), E/e′ (AUC=0.65, p<0.001), EF (AUC=0.71, p=0.002) and global LS (AUC=0.85, p=0.044) with an AUC of 0.94 (95% CI 0.89 to 0.99) (figure 4).

Comparison of receiver operating characteristic curves of both non-deformation and deformation echocardiographic parameters to diagnose cardiac amyloidosis. LS, longitudinal strain.
Only relative apical LS was found to be significantly predictive of CA (p=0.004) using multivariable logistic regression analysis with the diagnosis of CA as the outcome variable and the following as predictors: age, gender, New York Heart Association grade, a history of hypertension or diabetes, EF, E/e′, E/A, DT, global LS, peak gradient across the aortic valve, low voltage on ECG and relative apical LS.
Differences between subtypes of CA
Visual relative apical sparing was a feature of both transthyretin (TTR) and amyloid light chain (AL) CA, which is reflected by the similar relative apical LS (p=0.9) (table 3). Only the apical regional strain was different between these types of CA, being significantly lower in patients with TTR amyloidosis (p=0.03) (table 3). However, no difference was seen between the two types of CA in global LS or average basal and mid regional LS. Furthermore, no differences were noted between AL κ and AL λ in any of the strain parameters measured (comparison of relative apical LS, p=0.10; global LS, p=0.19; basal, mid and apical regional LS, p=0.69, p=0.13, p=0.12, respectively).
Longitudinal strain parameters in cardiac amyloidosis
Regional wall thickness and motion by CMR
CMR data were available in 14/55 (25%) patients with CA and 9/15 (60%) patients with HCM. Average basal, mid and apical wall thickness in the CA subgroup was 1.66±0.09 cm, 1.58±0.27 cm and 0.81±0.09 cm, respectively. When the average wall thicknesses at these three ventricular levels were compared with reported normal values,11 the average increase in the basal segments (111%) and mid-wall segments (122%) were significantly greater than the average increase in apical wall thickness (26%) (p=0.005 and p<0.001 for difference between basal vs apical and mid vs apical wall thickness, respectively).
There was a significant difference between average basal, mid and apical wall motion (2.5±0.7, 2.0±0.9 and 1.2±0.4, respectively) in the 14 patients analysed with CA (p<0.001).
Reproducibility
The intraobserver variability for measurement of LS in 272 measured segments showed an absolute bias between the two readings of 0.2±4.2 (mean ± 2SD). The bias for interobserver variability was 0.2±5.2 (mean ± 2SD).
Discussion
This study illustrates that relative sparing of LS in the LV apex as assessed using 2-D speckle tracking is highly sensitive and specific for the diagnosis of CA. In these patients, automatically generated strain plots produce a pattern of relative ‘apical sparing’ which is distinct, easily recognisable and specific. Furthermore, among patients with increased LV wall thickness, relative apical LS has incremental value in predicting CA over more traditional parameters used for this purpose.
The two principal types of amyloidosis which affect the heart are systemic AL/primary amyloidosis and TTR amyloidosis (itself subdivided into hereditary/familial and senile/wild-type amyloidosis). In AL amyloidosis the abnormal protein is produced by a monoclonal plasma cell population while the TTR protein is predominantly synthesised by the liver. Survival after diagnosis with AL CA may be as bad as most aggressive malignancies; however, the disease course is more indolent in TTR CA.12 There is an increasing realisation that the prevalence of CA may be higher than previously expected and, not uncommonly, that the diagnosis can go unrecognised.13 Although a tissue biopsy is required to define the type of CA, the clinical challenge often lies in identifying the disease early and differentiating it from other causes of increased wall thickness. Not surprisingly, there is growing interest in sensitive and specific non-invasive imaging modalities such as CMR to detect CA. Although an excellent modality for the diagnosis of CA, CMR is not without limitations. Many patients with suspected CA have contraindications to CMR such as the presence of pacemakers, claustrophobia or severe renal dysfunction (preventing the use of gadolinium-based agents which are paramount for the diagnosis). Furthermore, image quality in these patients can be significantly degraded, owing to limited breath-holding ability or cardiac arrhythmias. Also, obtaining delayed enhancement imaging which is unique to CMR can be challenging depending on the experience of operators. Thus, echocardiography remains an advantageous test owing to its widespread availability, portability, low risk, lower cost and comparatively higher temporal resolution.
Several traditional echocardiographic criteria have been described for the diagnosis of CA, including increased LV wall thickness, decreased DT and elevated E/e′ ratio. However, these findings may not be as common in CA as initially described, based on more recent studies of patients with confirmed cardiac involvement.14 ,15 Similarly, there is variability in the reported incidence of characteristic ECG findings for CA, with the largest published series describing a low voltage pattern in 47% of patients with CA, which is consistent with our data.10 Therefore, there is now a growing interest in the use of strain imaging to characterise patients with suspected CA, with several studies illustrating that a decrease in peak systolic global LS can be identified even before any of the traditional echocardiographic parameters become abnormal.14 ,16 Other studies have illustrated the prognostic value of reduced strain and its superiority to standard parameters.17 Although these studies are encouraging, a reduction in global LS, like many of the other echocardiographic parameters used, is not a specific finding to CA. Any myopathic process which impairs EF will result in a reduction in global LS. Increasing attention has turned to the use of regional strain assessment as a potential means of overcoming such difficulties. Studies adopting tissue Doppler-derived strain in CA have noted small non-significant differences from apex to base in LS.16 ,17 However, tissue Doppler is sensitive to artefact, particularly in the near field, and therefore may underestimate apical strain. Consistent with our findings, Sun et al observed regional differences in circumferential strain in patients with CA using 2-D speckle tracking, but they did not examine regional LS in CA.9
We identified a higher apex-to-base absolute LS gradient in patients with CA compared with AS but not HCM. However, clear regional and segmental differences could distinguish CA from HCM. Patients with CA had marked reduction in LS in all segments in basal and mid-ventricular wall regions. In contrast, HCM was characterised by a marked reduction in segmental LS at the septum—the site of greatest hypertrophy—with normal/super-normal strain values noted elsewhere. Therefore, in HCM, LS was significantly higher at each level in comparison with CA.
In order to incorporate two important strain features in CA (reduced global LS and the apex-to-base gradient), we next examined relative apical LS expressed using average apical LS as a quotient of the sum of the average mid and basal LS. This method allowed for a clear separation of patients with CA from other patient groups studied. An average apical LS value equal to or more than the sum of the basal and mid-LS was highly sensitive and specific in diagnosing CA. While global LS has previously been demonstrated to be a means of differentiating CA from HCM and LVH,9 we show incremental diagnostic value in the use of relative apical LS. Furthermore, the relative apical LS had incremental diagnostic value over some of the other traditional parameters that may be helpful in identifying CA, such as ventricular morphological parameters, ECG findings, and systolic and diastolic parameters.
Few differences in LS patterns were noted between different types of CA. An apical sparing pattern in LS was consistently found regardless of the subtype of amyloid. However, patients with TTR CA were found to have significantly lower average apical LS than those with AL amyloidosis. Although an interesting finding, we consider this to be an exploratory analysis owing to the small sample size of the subgroups.
Finally, similar to previous studies, the inter- and intraobserver variability for the strain measurements were clinically acceptable.18
Potential mechanisms of apical sparing
In the subgroup of patients with CA who underwent CMR, we noted an approximate doubling of LV wall thickness in the basal and mid-segments compared with a normal reference range; however, there was only a 26% increase in wall thickness at the apex. This may indicate that relatively less amyloid deposition occurs in the apex than in the base. It is possible that with less extracellular protein deposition, there is less resistance to deformation and through a process of dynamic reciprocity, increased myocyte contraction, resulting in relative sparing of apical strain.19 Of note, a greater diversity of myocyte and matrix orientations occurs at the apex compared with the base, which also may have significance for preservation of regional LS.20
Finally, analysis of CMR images in a subgroup of patients with CA showed a significant improvement in regional wall motion score from base to apex. This would suggest that sparing of apical LS is a real phenomenon rather than simply a speckle-tracking epiphenomenon.
Limitations
There are some limitations to consider in this study. First, this is an observational study involving small numbers of patients in groups of unequal sizes. However, given the low prevalence of CA, study numbers compare favourably with previously published studies.4 ,21 Second, the analysis was performed using speckle-tracking-based strain from a single vendor, and hence the findings may not be generalisable to all methods of LS assessment or indeed other vendors. Third, we used AS as a control group representing LVH secondary to increased afterload. This group was used in an attempt to match wall thickness between patients with CA as it is challenging to identify this degree of increased wall thickness in patients with hypertensive heart disease only. Therefore, our findings may not be generalisable to patients with LVH secondary to hypertension. Fourth, as serial echo data are not presented, we have not defined whether sparing of apical strain is an early phenomenon, whether it quantitatively tracks with disease progression, or indeed whether it is affected by disease treatment. Fifth, we have not yet defined whether apical sparing of LS is a characteristic feature of CA specifically or whether it might also be characteristic of other infiltrative cardiomyopathies. Finally, although we used delayed myocardial enhancement imaging data in the diagnosis of CA in a subgroup of patients, we did not perform any additional analysis. This was because objective assessment of regional variability in delayed myocardial enhancement is challenging in these patients given diffuse myocardial involvement and image artefacts due to limited breath-holding capacity.
Conclusions
By aiding disease detection, our findings have direct clinical relevance for those in whom the presence or absence of CA remains an important clinical consideration. A challenging clinical scenario in this regard is the diagnosis of CA in patients with increased LV wall thickness in busy echocardiographic laboratories where many features may be attributed to other more common pathologies. This study has shown that the presence of relative apical sparing is an easily recognisable, accurate and reproducible method of differentiating these entities.
References
Footnotes
DP and PC contributed equally to this work.
Competing interests None.
Ethics approval Ethics approval provided by Cleveland Clinic Foundation institutional review board.
Provenance and peer review Not commissioned; externally peer reviewed.