

Abstract
We provide a comparative in vivo examination of the brain network-based distribution of two hallmarks of Alzheimer's disease (AD) pathology in cognitively normal individuals: (1) Tau, detected with a novel positron emission tomography (PET) tracer known as 18F-AV-1451; and (2) amyloid-β, quantified with 11C-PiB PET. We used a high-resolution graph-based approach to investigate local-to-local and local-to-distributed cortical associations between the maps of Tau, amyloid-β, and gray matter intensity. Our study shows that Tau and amyloid-β deposits are associated with distinctive spatial patterns of brain tissue loss. Moreover, Tau and amyloid-β accumulations have strong network interdigitations in heteromodal and associative areas of the cortical mantle, particularly the inferior–lateral temporal lobe. These findings contribute significantly to our understanding of how these two main hallmarks of AD pathology propagate across the elderly human brain.
SIGNIFICANCE STATEMENT It has been postulated that Alzheimer's disease (AD) pathology interacts and resides within system-level circuits of the human brain, long before the onset of cognitive symptoms. However, a side-by-side comparison of tissue loss, amyloid-β, and Tau deposition in early stages of the disease has been precluded until the recent advent of Tau tracer-based neuroimaging. In this study, we used Tau positron emission tomography and network analyses to disentangle these pathological relationships. We found that Tau and amyloid-β deposits are associated with distinctive spatial patterns of brain tissue loss. Moreover, we uncovered the network interdigitations of Tau and amyloid-β in the cortical mantle. These findings contribute significantly to our understanding of how two main hallmarks of AD pathology propagate across the elderly human brain.
Introduction
Alzheimer's disease (AD) is a degenerative pathology in which misfolded extracellular amyloid-β (Aβ) and intracellular neurofibrillary tangles (NFTs) of Tau proteins abnormally accumulate in the human brain (Ogomori et al., 1989; Arnold et al., 1991; Braak and Braak, 1991a,b; Mattson, 2004; Walsh and Selkoe, 2004; Ikonomovic et al., 2008; Hyman et al., 2012). Tissue loss in AD is likely a complex phenomenon in which both Aβ and Tau may interplay and lead to neuronal death (Ingelsson et al., 2004; Serrano-Pozo et al., 2011; Walker et al., 2013). Aβ and Tau pathologies are anatomically constrained and gradually become widely propagated in AD within system-level networks, such as the default mode network (DMN; Buckner et al., 2009), beginning long before the onset of symptoms (Price and Morris, 1999). Here we seek to characterize the network connectivity properties of Aβ and Tau pathology in clinically normal individuals who are at increased risk for AD because of age.
Advances in neuroimaging technology have enabled the in vivo characterization and early detection of several tissue changes in clinical and preclinical stages of AD. Volume loss of medial temporal lobe (MTL) structures, e.g., hippocampus, is detectable with magnetic resonance imaging (MRI; Jack et al., 1992; Scheltens et al., 1992; Chetelat and Baron, 2003). More widespread cortical abnormalities, based on structural MRI and positron emission tomography (PET) with fluorodeoxyglucose are detected in heteromodal regions of the frontal, parietal, and temporal lobes (Minoshima et al., 1997; Buckner, 2004; Buckner et al., 2005; Bakkour et al., 2009; Dickerson et al., 2009; Sabuncu et al., 2011) and emphasize the distant dissemination of AD pathologic change. More recently, PET techniques sensitive to amyloid deposits have made possible the cross-sectional and longitudinal in vivo analysis of Aβ pathology in humans (Mathis et al., 2003; Klunk et al., 2004; Sojkova et al., 2011; Villemagne et al., 2011; Vlassenko et al., 2011; Johnson et al., 2012; Schöll et al., 2016). These studies have consistently described early Aβ deposition occurring primarily in heteromodal areas that are associated with AD-specific atrophy (Buckner et al., 2005; Becker et al., 2011; Masdeu et al., 2012). Although PET imaging has been able to identify and visualize Aβ deposits for more than a decade (Mathis et al., 2003; Klunk et al., 2004), high-affinity radiopharmaceuticals have been successfully developed for Tau only very recently (Maruyama et al., 2013; Okamura et al., 2013; Chien et al., 2014; Villemagne et al., 2014; Johnson et al., 2016). With the advent of Tau PET, a side-by-side comparison of tissue loss, Aβ, and Tau deposition in the whole brain is now possible.
Here we report an analysis of the anatomical distribution of a novel PET Tau tracer—known as 18F-T807 or 18F-AV-1451 (Avid Radiopharmaceuticals; Chien et al., 2014; Marquié et al., 2015; Johnson et al., 2016)—and its association with Aβ deposition and gray matter (GM) volume in a sample of clinically normal elderly participants from the Harvard Aging Brain Study. To accomplish this, we evaluated spatial covariations between Tau, Aβ, and GM intensities using a graph-based approach (Sepulcre et al., 2013). Specifically, we tested whether each type of pathologic deposit, Tau or Aβ, has a distinct accumulation pattern and a distinct association with an atrophy pattern in the cortical mantle. Moreover, we evaluated spatial relationships both locally and across the brain to gain insights about the network structure that might facilitate the propagation of pathology in the human cortex.
Materials and Methods
Participants.
Data from 88 cognitively normal elderly participants were analyzed in this study. Table 1 shows the participants' demographics. All subjects took part in the Harvard Aging Brain Study (Dagley et al., 2015), using protocols and informed consent procedures approved by the Partners Human Research Committee. Participants had a normal neurological examination, a clinical dementia rating scale score of 0 (Hughes et al., 1982), a Mini-Mental State Examination score above 27, and performance within 1.5 SD on age-and-education-adjusted norms on a battery of cognitive testing (Becker et al., 2011). None of the participants in the Harvard Aging Brain Study had any notable medical or neuropsychiatric illness, a history of drug or alcohol abuse or head trauma, or a family history of autosomal dominant AD.
Demographics of elderly participants
PET acquisition and preprocessing procedures.
All subjects underwent two PET imaging acquisitions at Massachusetts General Hospital on a Siemens/CTI ECAT PET HR scanner (3D mode; 63 image planes; 15.2 cm axial field of view; 5.6 mm transaxial resolution; and 2.4 mm slice interval): (1) 18F-T807 PET (Chien et al., 2014); and (2) 11C-labeled Pittsburgh Compound-B, N-methyl 11C-2-(4-methylaminophenyl)-6-hydroxybenzothiazole (11C-PiB) PET (Mathis et al., 2003). Average lag time between PET acquisitions was 13.96 ± 12.68 (mean ± SD) months. 18F-T807 was prepared at Massachusetts General Hospital (MGH; Shoup et al., 2013) and acquired from 80 to 100 min after a 10.0 ± 1.0 mCi bolus injection in four 5 min frames (Chien et al., 2014). 11C-PiB was prepared at MGH and acquired as described previously (Becker et al., 2011). An 8.5–15 mCi bolus injection followed immediately by a 60 min dynamic acquisition in 69 frames (12 × 15 s, 57 × 60 s) was performed in each imaging session (Mathis et al., 2003; Lopresti et al., 2005; Mintun et al., 2006). The final retention density maps were expressed as the standardized uptake value ratio (SUVR; cerebellar reference) for 18F-T807 PET and the distribution volume ratio (DVR; cerebellar reference) for PiB PET (Logan et al., 1990). Corrections for dead time, random coincidences, scattered radiation, and attenuation were performed for both PET datasets. Finally, using SPM12 (Wellcome Department of Cognitive Neurology, University College of London, London, UK; http://www.fil.ion.ucl.ac.uk/spm) running under MATLAB version 8.0 (MathWorks), all PET data in native space were coregistered with their corresponding anatomical T1-weighted MR images and spatially normalized into MNI/International Consortium of Brain Mapping (ICBM) space using the normalization parameters obtained in the T1-weighted MRI normalization. Of note, we did not apply any a priori cutoff in the 18F-T807 PET or the PiB PET imaging data.
PET imaging constraints.
As recently described, 18F-T807 PET has off-target binding in close proximity to hippocampus, particularly in non-GM areas such as the choroid plexus (Marquié et al., 2015; Johnson et al., 2016). 18F-T807 signal in the choroid plexus spills into the hippocampus region and may confound findings related to Tau deposits in this area. Although we have included 18F-T807 intensities located in corresponding GM voxels to minimize this issue, we cannot entirely ensure the complete separation of the hippocampus signal and adjacent choroid plexus. Therefore, as a note of caution, we have to carefully interpret our findings in the hippocampus area, because it may refer to an area with signal contributions from both hippocampus and adjacent choroid.
MRI acquisition and preprocessing procedures.
Structural MRI acquisition of the whole head (T1-weighted MPRAGE) was performed in each subject on a 3 Tesla Tim Trio system (Siemens; Dagley et al., 2015). We used SPM8 for MRI preprocessing and voxel-based morphometry analysis of the anatomical T1-weighted MR images (Ashburner and Friston, 2000). Briefly, after spatial normalization of all images from native to normalized MNI/ICBM space, images were segmented into GM, white matter, and CSF. Then, the modulated GM images were selected for additional analysis and smoothed using an 8 mm full-width at half-maximum Gaussian kernel. For computational efficiency, particularly for the graph theoretic analyses, we downsampled all MRI and PET neuroimaging data to 6 mm isotropic voxels. Then, we vectorized all individual imaging data and concatenated all subjects in a single voxel-by-subjects matrix for each imaging modality. Of note, in this study, we used a volume strategy to assess brain-mapping relationships between AD-related pathology and neurodegeneration. It will be central for future studies to compare our strategy with thickness approaches, because of recent evidence suggesting important divergence between both methods (Whitwell et al., 2013).
Analytical strategies.
We first analyzed local associations between the measurements across the three modalities 18F-T807, 11C-PiB, and GM intensity maps. In these local-to-local analyses, we performed pairwise partial correlations between modalities within each voxel (same matching MNI/ICBM coordinates; 18F-T807 vs PiB, 18F-T807 vs GM, and PiB vs GM), while controlling for age and the remaining modality. Thus, this partial correlation approach allows us to show independent effects of each neuroimaging modality. The local-to-local analyses aimed to reveal the local associations between the two AD pathological lesions and GM volume loss.
Because Tau and Aβ accumulations and GM intensities may also relate in a local-to-distributed manner, e.g., via large-scale distributed brain networks, we tested for correlations between values in voxels spanning the brain by using partial correlations. In these local-to-distributed analyses, we computed the weighted degree of spatial covariations by quantifying the number and strength of significant correlations between brain voxels (Sepulcre et al., 2013). The local-to-distributed analyses were performed within and between imaging modalities (star-net diagrams in Figs. 3, 6). For example, in the local-to-distributed analysis for Tau, we examined associations (partial correlations) between local intensities of each voxel (seed) of the Tau images and distributed intensities of all voxels across the brain for Tau (within-modality) or Aβ and GM (between modality). All partial correlations of the local-to-distributed analyses were controlled for age and the voxel-level density of the remaining imaging modality, depending on which dependent variable was under analysis. As additional measures of precaution, we used a Lillefor test to check for normality in all voxel-level imaging variables and applied a false discovery rate (FDR) correction (Benjamini and Hochberg, 1995) at a q level of <0.05 to control for the rate of false positives of resulting partial correlations. Therefore, only normally distributed variables and only FDR-corrected (significant) correlations were used in our graph theory approach.
Local-to-local and local-to-distributed correlations between voxel-level measurements from different imaging modalities are two analytical approaches that offer complementary viewpoints. Local-to-local correlations analyze how Tau or Aβ relates to GM at the same spatial coordinates. Conversely, the local-to-distributed approach investigates how Tau or Aβ values in a given voxel, for example, relate to GM values across the brain. We use “weighted degree of connectivity” (defined as the sum of strengths of significant correlations for each seed voxel), which quantifies the extent to which Tau/amyloid accumulation is associated with distributed volume loss. We refer to the areas that exhibit a high weighted degree of connectivity as “hubs.” Therefore, hubs are voxels in which local pathology has disproportionate influence on distributed volume loss or pathology. To complement the hub analysis, we further performed a conventional seed-based analysis at hub voxels in several sections of the study to visualize the spatial patterns of associations (Figs. 4, 7).
Last, to gain additional insights into the pathological networks that underlie AD, we computed a global pathology interaction graph by summing the four graphs that capture all possible interactions between local and nonlocal pathology: Aβ–Aβ, Aβ–Tau, Tau–Tau, or Tau–Aβ. Figure 8I visualizes this network, in which nodes are colored based on the predominant interaction type described above and the layout reflects edge weights in the graph. Proximal nodes in this graph reflect a high amount of pathological interaction between corresponding voxels. We then used the Pajek software (De Nooy et al., 2005) to compute the average betweenness centrality for each voxel type in this graph (see Fig. 8II). Betweenness centrality analysis intends to reveal nodes that play a central role in a hypothetical diffusion on the graph.
Visualization.
All three-dimensional maps were projected onto the left and right cerebral hemispheres of the PALS surface (PALS-B12) provided by Caret software (Van Essen, 2005) using the “interpolated algorithm” and “multi-fiducial mapping.” Maps were then displayed using an r = 0.25 threshold in all local-to-local analyses and a 2–98% Caret threshold for the local-to-distributed degree results. We used Pajek software (De Nooy et al., 2005) to display the network of Figure 8I with a Kamada–Kawai energy layout (Kamada and Kawai, 1989). To obtain an optimal energy layout of the pathology network that takes into account all possible Aβ and Tau associations, we computed the edge weights as a rank reflecting the total number of significant associations for each pair of voxels (Aβ–Aβ, Aβ–Tau, Tau–Tau, and/or Tau–Aβ).
Results
The anatomical distribution of Tau and Aβ
PET measures of Tau and Aβ deposits have differing, specific regional anatomies in the cortical mantle of elderly subjects. Tau accumulations are localized in the temporal lobe area, particularly in ventral, lateral, and inferior temporal regions (Tau average map in Fig. 1I, a–d), whereas Aβ deposits are primarily sited in the lateral and midline frontal and parietal areas (Aβ average map in Fig. 1II, a–d). Some medial temporal regions are also preferentially affected by Tau deposits (Tau average map in Fig. 1I, e,f).

Average maps of Tau and Aβ deposits in cognitively normal elderly patients. I shows the average Tau maps. II shows the average Aβ maps. Color scales represent SUVR units in I and DVR units in II. The insets of the lateral brain view are the same as the cortical surfaces but with a lenient visualization threshold. a–f indicate principal locations of Tau deposits. a–d indicate principal locations of Tau deposits.
Local-to-local associations between Tau, Aβ, and GM
Tau deposits showed negative correlations with GM intensity in the lateral inferior (Fig. 2Ia) and anterior medial (Fig. 2Ib,Ic) temporal lobe and, to a lesser extent, in cingulate cortical areas. In contrast, local-to-local Aβ deposits and GM are spatially associated in a more widespread manner. We found that Aβ deposits have negative correlations with GM in the lateral and ventral temporal, lateral parietal, and frontal cortices of the brain (Fig. 2IIa–IId). Moreover, some medial temporal areas, in the right hemisphere, displayed negative correlations between Aβ deposits and GM (Fig. 2IIe). Figure 2, III and IV, shows scatter plots of local maxima coordinates in the analysis (Fig. 2, stars).

Local-to-local associations of Tau and Aβ with GM intensities in cognitively normal elderly patients. I shows the cortical distribution of voxelwise correlations between Tau and GM maps. II shows the cortical distribution of voxelwise correlations between Aβ and GM maps. Color scales represent negative partial correlation coefficients adjusted by age and Aβ intensities in I and negative partial correlation coefficients adjusted by age and Tau intensities in II. III and IV show the scatter plots of coordinates with local maxima (red stars) in I and II, respectively. a–c indicate Tau deposits with negative correlations with GM. a–e indicate Aβ deposits with negative correlations with GM.
Local-to-distributed associations between Tau, Aβ, and GM
Figure 3 visualizes the local-to-distributed associations between Tau and Aβ and widespread GM intensity. We found that Tau deposits in inferior and medial temporal and orbitofrontal areas exhibit a high number of negative correlations with distributed GM intensities in the human cortex (for location of hubs, see Fig. 3Ia–Ie). In addition, extensive hub areas indicate a large number of negative correlations between local Aβ deposits with dispersed GM (for location of hubs, see Fig. 3IIa–IIh). Compared with the local-to-local approach, the hub-based analysis emphasizes brain wide neurodegeneration and reveals extended areas of negative Tau–GM associations in orbitofrontal areas (Fig. 3Ia,Ic) and negative Aβ–GM associations in midline frontal, precuneus/posterior cingulate, and orbitofrontal cortices (Fig. 3IIa–IIh). Figure 4 shows the seed-based maps of the top hubs found in Figure 3.

Hubs of Tau and Aβ with GM intensities in cognitively normal elderly patients. I shows the cortical distribution of degree of voxelwise correlations between local Tau and widespread GM. II shows the cortical distribution of degree of voxelwise correlations between local Aβ and widespread GM. Color scales represent the degree or number of negative partial correlation coefficients adjusted by age and Aβ intensities in I and the degree or number of negative partial correlation coefficients adjusted by age and Tau intensities in II. a–e indicate local Tau deposits with high degree of connectivity to distributed GM. a–h indicate local Aβ deposits with high degree of connectivity to distributed GM.

Seed-based maps of top hubs from Figure 3. Seed voxels of top hubs of Tau (I) and Aβ (II) are marked with red stars. Color scales represent negative partial correlation coefficients between Tau and GM adjusted by age and Aβ intensities in I and negative partial correlation coefficients between Aβ and GM adjusted by age and Tau intensities in II.
Local-to-local associations between Tau and Aβ
Although Tau and Aβ deposits display distinctive spatial average uptake in our sample (Fig. 1), we found that they have strong positive local-to-local correlations throughout the cortex. For instance, Tau and Aβ are highly correlated in association areas of lateral temporal, frontal and parietal lobes, and precuneus and posterior cingulate regions (Fig. 5Ia–Ic). Interestingly, we did not find significant associations in the MTL but in its inferior–lateral regions. In fact, the inferior–lateral temporal lobe displayed the highest positive correlations in each hemisphere (inset with a stringent r threshold in Fig. 5I, stars mark the local maximum voxels). Figure 5II shows the scatter plots of voxels indicated with the stars in Figure 5I. Of note, we did not find any local-to-local negative significant correlations between Tau and Aβ deposits.

Local-to-local associations between Tau and Aβ in cognitively normal elderly patients. I shows the cortical distribution of voxelwise correlations between Tau and Aβ maps. Color scales represent positive partial correlation coefficients adjusted by age and GM intensities. II shows the scatter plots of coordinates with local maxima (black stars) in I. Insets show a stringent r threshold to highlight the local maximum voxels in lateral and inferior temporal areas. a–f indicate positive correlation coefficients between local Tau deposits and local Aβ deposits.
Local-to-distributed associations between Tau and Aβ
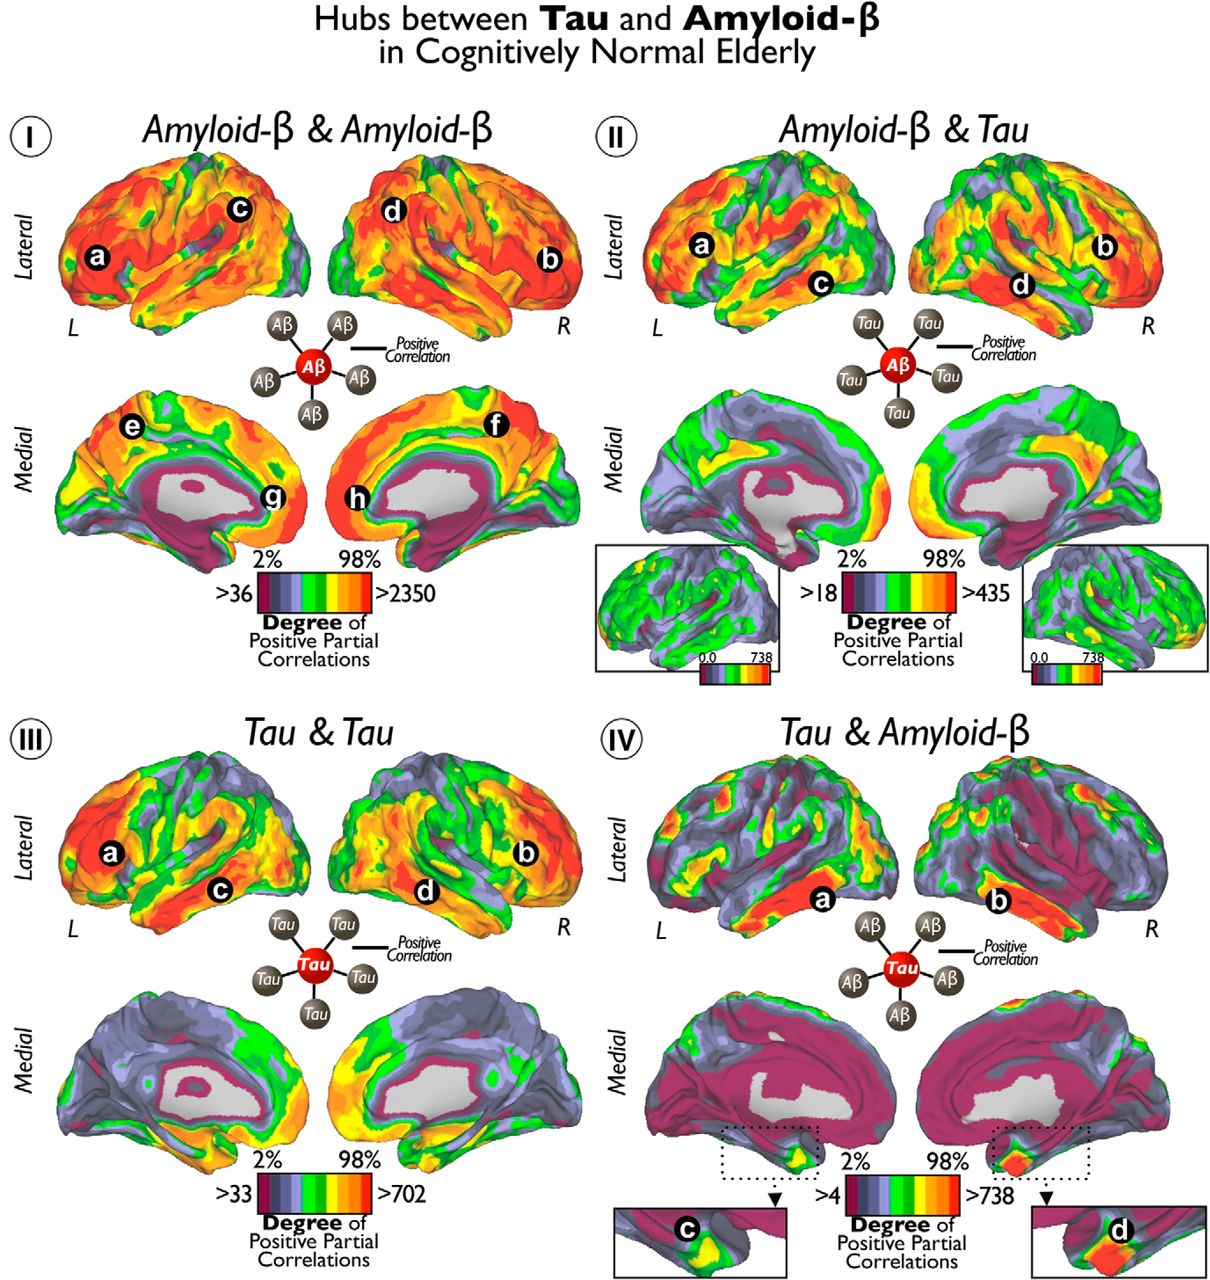
In Figure 6, we visualize the degree of local-to-distributed associations between Tau and Aβ deposits. Four possible relationships arise from how a specific seed voxel value relates to the rest of voxels in the brain. Thus, we calculated the degree of positive correlations for the following seed–target combinations: Aβ–Aβ, Aβ–Tau, Tau–Tau, and Tau-Aβ (Fig. 6I–IV). We found that Aβ deposits in the lateral–ventral frontal, inferior parietal, and lateral temporal areas exhibit a large number of significant associations with distributed Aβ and Tau values (Fig. 6Ia–Id,IIa–IId). To a lesser extent, Aβ in midline structures in the frontal and parietal lobes exhibited associations with widespread Aβ (Fig. 6Ie–Ih) and Tau (Fig. 6II). The degree of Tau–Tau associations was prominent in dorsal areas of the frontal lobe and middle areas of the temporal cortex (Fig. 6IIIa–IIId). Finally, we found that bilateral inferior–lateral temporal cortex (Fig. 6IVa,IVb) and entorhinal cortex congregate a high number of Tau–Aβ-positive correlations (Fig. 6IVc,IVd). Interestingly, degree values of Aβ–Tau were lower than the other intramodality or intermodality degree maps (for visualization purposes, the inset in Fig. 6II shows Aβ–Tau with same degree threshold as whole-brain Tau–Aβ in Fig. 6IV). Figure 7 shows the seed-based maps of the top hubs found in Figure 6.

Hubs of Tau and Aβ in cognitively normal elderly. I shows the cortical distribution of degree of voxelwise correlations between local Aβ and widespread Aβ. II shows the cortical distribution of degree of voxelwise correlations between local Aβ and widespread Tau. III shows the cortical distribution of degree of voxelwise correlations between local Tau and widespread Tau. IV shows the cortical distribution of degree of voxelwise correlations between local Tau and widespread Aβ. Color scales represent the degree or number of positive partial correlation coefficients adjusted by age, GM, and Aβ or Tau intensities depending on the analysis. Insets of the lateral brain view in II are same cortical surfaces with an equivalent threshold as in IV. Inset of the MTL in IV enlarges the view of the entorhinal cortex. Letters indicate principal locations of local Tau or Aβ deposits with high degree of connectivity to other Tau or Aβ deposits.

Seed-based maps of top hubs from Figure 6. Seed voxels of top hubs of Aβ–Aβ (I), Tau–Tau (II), Aβ–Tau (III), and Tau–Aβ (IV) are marked with black stars. Color scales represent positive partial correlation coefficients between Tau and Aβ adjusted by age, GM, and Aβ or Tau intensities depending on the analysis.
Maps of predominant local-to-distributed associations between Tau and Aβ
In the previous analysis (Fig. 6), we showed the absolute degree of local-to-distributed Tau and Aβ associations separately. Figure 8 offers a complementary perspective for the local-to-distributed associations. Based on the predominant association of the connectivity profile, the goal here is to localize the areas in the brain that display preferential patterns for each type of Tau–Aβ relationship (for examples of predominant voxels/nodes, see Fig. 8I).

Hubs of Tau and Aβ network interactions in cognitively normal elderly patients. I shows the pathology network, based on all Tau and Aβ interactions at the brain voxel-level. Network graph is displayed using a Kamada–Kawai energy layout in which the value depends on the total number of significant associations for the pair of voxels (see diagram in middle bottom for an schematic representation). The color partition of the network represents the predominant pathological associations in brain nodes. Column figures show random examples of connectivity profiles with a predominant association between Tau and Aβ (Aβ–Aβ, blue nodes; Aβ–Tau, green nodes; Tau–Tau, red nodes; Tau–Aβ, orange nodes). II shows in a column figure the mean and SD of betweenness centrality in each predominant hub group of I. III shows the projection of the brain nodes of the pathology network in I onto the cortical space.
To visualize the overall association pattern, we display the pathology network topology (computed from all possible Aβ and Tau associations; Fig. 8I). We use a graph-drawing algorithm that positions each node of the graph in a two-dimensional space in which connectivity distances between nodes are minimized. In this particular display, the distance between node pairs reflects the pathology interactions, measured as the number of significant associations between the two modalities at the two voxels. Each node is then colored with the type of predominant local-to-distributed associations of that voxel. For example, an Aβ–Tau node (green) corresponds to a voxel in which the predominant association is between local Aβ and brainwide Tau values. Aβ–Aβ is the majority component of the pathology network (blue nodes). Tau–Tau (red) nodes are less numerous and tend to be located on the periphery of the pathology network, tightly circumscribing the Aβ–Aβ component. The Aβ–Tau component (green nodes) is located in the interface between the Aβ–Aβ and Tau–Tau subnetworks. Remarkably, Tau–Aβ occupies the central position of the pathology network (orange nodes), which also presents the highest betweenness centrality nodes that lie on a disproportionate number of shortest paths between nodes in the network (Fig. 8II). The projection of the color scheme of the network onto the cortical space shows that areas of predominantly Aβ–Aβ and Tau–Aβ associations (Fig. 8III, blue and orange colors) overlap with the hub maps of Figure 6. In contrast, we observe that the Tau–Tau and Aβ–Tau networks exhibit distinctive patterns. A high number of predominantly Tau–Tau areas are located in the MTL, including the parahippocampus (Fig. 8III, red color), whereas predominantly Aβ–Tau areas are in the posterior parahippocampus and cingulate cortex (Fig. 8III, green color). Although a particular type of association can have a high degree in a specific area of the brain (Fig. 6), it may not represent the predominant type of association in that area. For instance, Aβ–Aβ and Tau–Aβ have similar hubness maps and predominant association maps, but Aβ–Tau and Tau–Tau exhibit remarkable differences between them. The Tau–Tau hubness map highlights lateral temporal and frontal areas, whereas the predominant association map features medial temporal areas (compare Figs. 6, 8). The Aβ–Tau hubness map highlights lateral temporal and frontal areas, although with low degree, whereas the posterior parahippocampus and cingulate cortex exhibit predominantly Aβ–Tau associations (compare Figs. 6, Fig. 8).
Discussion
Distinct cortical distribution of Tau and Aβ and the association of each with GM
AD neurodegeneration has been described as not randomly distributed but following large-scale brain systems in the cerebral cortex (Greicius et al., 2004; Seeley et al., 2009; Villain et al., 2010; Raj et al., 2012; Zhou et al., 2012; Sepulcre et al., 2013; Kuchibhotla et al., 2014). Our study had several major findings supporting that Tau and Aβ interrelate to generate stereotypical and large-scale patterns of pathological deposits in the human brain. First, our local-to-local analyses revealed that voxel-level in vivo Tau and Aβ values are associated with brain volume in distinctive patterns. Tau preferentially relates to local tissue loss in the temporal lobe, whereas Aβ seems to have an affinity for local GM atrophy in more dorsal areas and in distributed regions of the parietal and frontal lobes. These results extend previous postmortem histopathological data (Hyman et al., 1984; Kalus et al., 1989; Arnold et al., 1991; Braak and Braak, 1991a,b; Thal et al., 2002) to an in vivo large sample of cognitively normal elderly subjects.
Conversely, by studying local-to-distributed spatial interactions between Tau, Aβ, and GM intensities, we characterized the system/network nature of AD-related pathology. We first examined how Tau and Aβ accumulation in a specific region relate to GM elsewhere in the brain, regardless of anatomic location. For instance, Tau in the MTL and orbitofrontal systems is strongly associated with widespread GM volume loss, whereas Aβ in frontal and parietal midline, as well as orbitofrontal and some temporal areas, is related to brainwide GM volume loss. Interestingly, we observed several regions in which there is a disagreement between the local-to-local and local-to-distributed results. In particular, Aβ deposits in the midline surface of the brain are strongly associated with atrophy in the rest of the cortex but not with local-to-local atrophy. In contrast to Tau, in which both local-to-local and local-to-distributed maps were similar, this result suggests that Aβ deposits in the midline components of the DMN may secondarily affect distant connected areas, even at a greater level than the local degeneration itself.
Identification of specific brain regions in which pathology networks interact
Although our findings show unambiguous differences between Tau and Aβ deposits and GM intensities, they also reveal several convergence zones that may suggest potential interactions in the spatial domain. For instance, our results show that Tau and Aβ deposits strongly correlate in inferior–lateral temporal areas and entorhinal cortex of the human brain. The predominance of linked Tau and Aβ deposits within the inferior–lateral temporal area might be explained by the high density of Tau protein in dystrophic neurites in the inferior–lateral and posterior temporal areas (Marquié et al., 2015). Our local-to-distributed approach provides more insight on this issue. It is the Tau accumulation in inferior–lateral temporal areas and entorhinal cortex that relates to massive Aβ elsewhere in the brain (Fig. 6IV). In this sense, the inferior–lateral temporal and entorhinal cortex seem to be critical regions for linking both pathologies at the large-scale level, in which spreading mechanisms of pathology, possibly involving Tau aggregation in neuritic plaques (Medina and Avila, 2014), might take place.
One way to investigate the interactions between the Tau and Aβ pathologies in the human brain is to use graph theory. Graph theory provides tools for the analysis and visualization of complex associations. In our graph theoretic analysis, we aimed to elucidate whether Tau and Aβ deposits show features of connectivity in the topological space. If Tau and Aβ deposits were appearing in unrelated systems of the human brain, we would expect to see high spatial associations within the same type of pathology (Tau–Tau or Aβ–Aβ) and little and/or just peripheral spatial interactions across the different pathologies (Tau–Aβ or Aβ–Tau). In this scenario, Tau and Aβ interactions would only emerge as a result of the peripheral confluence of the distinct brain networks. In contrast, if Tau and Aβ deposits were appearing in common brain systems, then Tau and Aβ interactions would exist beyond the periphery of the pathology network and exhibit a core component (such as in Fig. 8I, orange nodes). In this study, we described strong peripheral connectivity between areas of predominantly Tau–Tau or Aβ–Aβ associations, supporting the hypothesis of the confluence of two independent pathology subnetworks. At the same time, our analyses have also revealed a core subnetwork that reflects a central cross-pathology association. Tau–Aβ interactions exist in the middle of the network, corresponding to core voxels in which local Tau values are associated with widespread Aβ deposits. These findings suggest an intimate dependency between Tau and Aβ, at the core of the pathology network.
It has been postulated that AD pathology may spread in the human brain in a spatially distinct pattern (de Calignon et al., 2012; Walker et al., 2013; Kuchibhotla et al., 2014), through the accumulation of intraneuronal NFTs, for instance in the MTL, and the production of extraneuronal Aβ in its distant projected neurons (Pearson and Powell, 1989), such as areas of the cerebral cortex in the DMN. Once the progression of pathology reaches highly connected heteromodal regions of the DMN, it may generalize and speed up significantly. This model provides an explanation for the mismatch between preferential Tau deposits in MTL regions during the early phase of the disease and widespread Aβ deposits, which would result from disease progression in the DMN. Interestingly, this perspective suggests that we should be able to detect the intermediate regions of spreading, in which fingerprints of progression may appear. In this study, our results revealed the existence of a core subnetwork reflecting the relationship between Tau in the inferior–lateral temporal lobe and widespread Aβ across the cortex. We believe that this subnetwork might be reflecting the intermediate fingerprint of the pathology spreading process and offers clues about the large-scale dependency of the two pathological hallmarks. Therefore, although much work remains to be done, we think that these findings have implications to understanding how Tau and Aβ interact to propagate across the human brain.
Our findings provide in vivo support for the network nature of AD pathology, although they cannot establish whether one pathology initiates the other. By studying large-scale spatial associations between pathology deposits and GM intensities, we aimed to shed light on the pathogenesis of AD, while offering possible avenues for early detection and monitoring disease treatments. Moreover, there are five limitations in this study: (1) this is a cross-sectional study and, therefore, longitudinal multimodal data including in vivo Tau, Aβ, and structural imaging will be essential to confirm and extend the findings reported in this work; (2) we consider our cohort at risk of preclinical AD just by virtue of age; (3) it is important to remark that some individuals of our sample may have primary age-related tauopathy potentially independent of Aβ accumulation (Crary et al., 2014; Jack, 2014; Mungas et al., 2014); (4) all our partial correlation analyses of PET data were done with voxel-level GM intensity correction but not with a partial volume correction approach; and (5) some uptake of our Tau tracer might be located in the choroid plexus. Therefore, findings in the proximity of the choroid plexus should be taken cautiously.
Conclusions
Our results suggest that, during the preclinical stages of AD, Tau and Aβ deposits are associated with distinctive spatial patterns of brain tissue loss. Moreover, Tau and Aβ accumulation show strong spatial interdigitations at the network level in heteromodal and associative areas of the cortical mantle, particularly the inferior–lateral temporal lobe and entorhinal cortex. These analyses further point to regions in which Tau and Aβ might interact both locally and at a large scale, leading to the progression of the disease, which in turn produces the final map of neurodegeneration.
Footnotes
This research was supported by National Institutes of Health Grants K23-EB019023 (J.S.), R01-AG046396 (K.A.J.), R01-AG027435-S1 (R.A.S. and K.A.J.), P50-AG00513421 (K.A.J. and R.A.S.), P01-AG036694 (R.A.S. and K.A.J.), K25-EB013649 (M.R.S.), and K23-AG049087 (J.P.C.), Massachusetts Alzheimer's Disease Research Center, Alzheimer's Association Grants NIRG-11-205690 (J.S.), IIRG-06-32444 (R.A.S. and K.A.J.), and ZEN-10-174210 (K.A.J.), BrightFocus Foundation/American Health Assistance Foundation Grants A2012333 (M.R.S.) and A2013003 (J.P.C.), and the American Brain Foundation/American Academy of Neurology (J.P.C.). We thank the investigators and staff of the Harvard Aging Brain Study and the Massachusetts Alzheimer's Disease Research Center, the individual research participants, and their families and caregivers. We also thank the PET Core of Massachusetts General Hospital, and the Athinoula A. Martinos Center for imaging support.
The authors declare no competing financial interests.
- Correspondence should be addressed to Jorge Sepulcre, 149 13th Street, Suite 5.209, Division of Nuclear Medicine and Molecular Imaging, Department of Radiology, Massachusetts General Hospital, Charlestown, MA 02129. sepulcre{at}nmr.mgh.harvard.edu


