


Abstract
Assessing cellular proliferation provides a direct method to measure the in vivo growth of cancer. We evaluated the application of a model of 3′-deoxy-3′-18F-fluorothymidine (18F-FLT) kinetics described in a companion report to the analysis of FLT PET image data in lung cancer patients. Compartmental model analysis was performed to estimate the overall flux constants (KFLT) for FLT phosphorylation in tumor, bone marrow, and muscle. Estimates of flux were compared with an in vitro assay of proliferation (Ki-67) applied to tissue derived from surgical resection. Compartmental modeling results were compared with simple model-independent methods of estimating FLT uptake. Methods: Seventeen patients with 18 tumor sites underwent up to 2 h of dynamic PET with blood sampling. Metabolite analysis of plasma samples corrected the total blood activity for labeled metabolites and provided the FLT model input function. A 2-compartment, 4-parameter model (4P) was tested and compared with a 2-compartment, 3-parameter (3P) model for estimating KFLT. Results: Bone marrow, a proliferative normal tissue, had the highest values of KFLT, whereas muscle, a nonproliferating tissue, showed the lowest values. The KFLT for tumors estimated by compartmental analysis had a fair correlation with estimates by modified graphical analysis (r = 0.86) and a poorer correlation with the average standardized uptake value (r = 0.62) in tumor. Estimates of KFLT derived from 60 min of dynamic PET data using the 3P model underestimated KFLT compared with 90 or 120 min of dynamic data analyzed using the 4P model. Comparison of flux estimates with an independent measure of cellular proliferation showed that KFLT was highly correlated with Ki-67 (Spearman ρ = 0.92, P < 0.001). Ignoring the metabolites of FLT in blood underestimated KFLT by as much as 47%. Conclusion: Compartmental analysis of FLT PET image data yielded robust estimates of KFLT that correlated with in vitro measures of tumor proliferation. This method can be applied generally to other imaging studies of different cancers after validation of parameter error. Tumor loss of phosphorylated FLT nucleotides (k4) is notable and leads to errors when FLT uptake is evaluated using model-independent approaches that ignore k4, such as graphical analysis or the SUV.
Metabolic imaging of cellular proliferation with PET can measure tumor growth (1,2), which decreases early in response to cancer therapy (3). Thus, PET of cellular proliferation may provide a convenient and early measure of therapeutic response.
The most direct indicator of cellular proliferation is DNA synthesis, which can be measured using radiolabeled thymidine or its analogs. 2-11C-Thymidine (TdR) is regarded as a gold standard in PET because it is a natural metabolic substrate that is rapidly incorporated into DNA through the exogenous or salvage pathway for pyrimidines. After the introduction of 11C-thymidine 3 decades ago (4), our group has reported extensive work on the development and validation of TdR for imaging cellular proliferation using PET (5–10). However, the short half-life of the label and the competing thymidine catabolism in vivo (11,12) have limited widespread implementation of TdR as an imaging agent. Static imaging of TdR does not accurately reflect cellular proliferation because labeled metabolites contaminate the images (9). Accurate interpretation of TdR uptake to determine the rate of DNA synthesis requires rapid blood sampling, metabolite analysis, and mathematical modeling of the PET image data, which has been primarily performed in a research setting.
The introduction of 3′-deoxy-3′-18F-fluorothymidine (FLT) for imaging DNA synthesis offers several practical advantages (12). FLT is an analog of thymidine labeled with 18F at the 3′-hydroxyl site. The remainder of the molecule is indistinguishable from thymidine. It is not a substrate for thymidine phosphorylase, but it is a good substrate for thymidine kinase and therefore reflects metabolism by the DNA salvage pathway. In addition, 18F offers the advantage of a longer-lived label with high specific activity, and the radiosynthesis of FLT involves a simple nucleophilic displacement and deprotection similar to that for FDG. FLT enters the exogenous DNA pathway as a specific substrate for thymidine kinase 1 (TK1), which is used to provide nucleotides for DNA synthesis and is selectively upregulated during the S phase of cell division (13–15). The phosphorylated products of FLT are nucleotides retained in tissues at a rate proportional to TK1 activity, somewhat analogous to FDG uptake indicating hexokinase activity in energy metabolism (13). The only other recognized catabolism of FLT in humans is its glucuronidation. FLT-glucuronide is produced and exported by the liver and is otherwise restricted to the blood pool and bladder. Furthermore, FLT and FLT-glucuronide are easily measured in blood (16–18).
Very little FLT is incorporated into DNA because it is a chain terminator. Unlike thymidine, less than 1% of FLT is incorporated into DNA (19,20). Although phosphorylated TdR predominantly labels DNA, FLT metabolism only labels the intracellular nucleotide pool, which is subject to reversible breakdown. Nevertheless, our in vitro studies (13,14,21) and imaging experience with FLT (16,22) provide compelling evidence that FLT is a valid thymidine surrogate.
In this report, we provide a detailed analysis of FLT PET by applying a compartmental model to data from a series of 17 patients with non–small cell lung cancer (NSCLC). We also investigated FLT kinetics in a proliferating normal tissue, bone marrow, and a normal tissue with a low proliferation rate, muscle. The patient studies were analyzed to investigate the performance of a quantitative model of FLT kinetics in human PET studies for a wide variety of proliferative states.
Because FLT is not incorporated into DNA, it is necessary to validate FLT uptake with an independent measure of the DNA synthetic rate. The protein biomarker Ki-67, identified by MIB-1 antibody staining, participates in the DNA replication complex where it is bound to DNA (23) and is a simple measure of proliferation. The Ki-67 protein has been shown to be essential for cell cycle progression (24), and thus MIB-1 immunohistochemistry (IHC) of biopsy specimens has provided an independent proliferation assay for correlation to FLT PET data (16–18,25). In previous studies we have reported a high correlation of FLT uptake in lung cancer using simple, model-independent measures of tracer uptake, such as maximum standardized uptake value (SUV) or graphical analysis, to Ki-67 labeling (16).
Recent reports of FLT imaging have used simple measures, such as SUV or model- independent graphical analysis, for estimating uptake of FLT in various tumors using a variety of static imaging times and intervals (17,18,25,26). Compartmental model analysis is necessary to fully characterize the kinetics of FLT uptake into tissue. There is variability in these analyses when selecting a static image during the active uptake phase of FLT. Compartmental modeling should estimate the overall flux of FLT without the bias inherent in the SUV and allow the detection of more subtle changes in tumor status throughout therapy. The result would be less variability in the imaging parameter and a better correlation to patient outcome than model-independent measures of uptake.
Preliminary analysis of our compartmental FLT model in a companion report (27) showed that, with the type and quality of data collected in PET, the model can provide reliable estimates of FLT transport (K1) and overall flux (KFLT). The model simulations suggested accuracy estimates of FLT flux and FLT transport into tissues, with a SE for flux of <5% and a transport error of approximately 15%.
MATERIALS AND METHODS
Patients
Seventeen patients with 18 biopsy-proven or clinically suspected NSCLCs were prospectively studied. All patients had CT of the chest before FLT PET imaging. These studies were conducted following protocols approved by the University of Washington Human Subjects and Radiation Safety Committees. All patients provided signed informed consent. Data from 10 of these patients have appeared in an earlier report (16).
Surgery and Histopathologic Analysis
Surgical resection of tumor specimens occurred within 1 wk of FLT scanning for all patients except one, who underwent surgical resection at 47 d. One patient had 2 histologically different primary NSCLCs resected, 1 from each lung at 2 different operations. Histologic specimens were available for pathologic and IHC evaluation. All tumor specimens were reviewed by a pathologist who was unaware of the PET results to assess tumor type and differentiation.
A representative formalin-fixed, paraffin-embedded section from each specimen was labeled using monoclonal antibody MIB-1 (Immunotech; 1:100) after microwave antigen retrieval in citrate buffer. Antibody binding was detected using the Vectra Elite kit with FeCl3 intensification and hematoxylin counterstain. MIB-1 recognizes the Ki-67 antigen, a Mr 345,000 and Mr 395,000 nuclear protein common to proliferating human cells (23). Human lymph node tissue was used as a positive control for proliferating cells. The primary antibody was omitted on sections used as negative controls. All cells with nuclear staining of any intensity were defined as positive. Proliferative activity was defined as the percentage of nuclei stained with MIB-1 per total number of nuclei in the sample. The fraction of labeled tumor cells, defined as the Ki-67 labeling index (Ki-67 LI), was assessed over 4 microscopic fields, 3-mm diameter in the field (estimated 2,000 nuclei), that contained the highest average fraction of labeled cells. The Ki-67 LI is analyzed as a categorical variable due to the method of scoring the fraction of cells stained with the MIB-1 antibody. The categories are determined as 5% intervals with complete staining of every cell as 100%. This Ki-67 IHC method has been used by our group as a tissue correlate to PET measures (16,28).
Radiosynthesis
FLT was prepared according to the method developed by Grierson and Shields (29). The specific activity was >37 GBq/mmol at the time of injection. Before administration of each dose, quality control testing for pH and radiochemical purity was completed. The radiochemical purity was >98% for all FLT injections. All of the doses administered were shown to be free of endotoxin, <0.4 IU/mL (Limulus Amebocyte Lysate; Associates of Cape Cod Inc.). Sterility testing for anaerobic and aerobic bacterial contamination was performed on samples of all of the batch dose after radioactive decay (24 h). FLT was administered by intravenous injection of a 10-mL solution of isotonic saline containing <10% (v/v) ethanol USP. Patient dose was based on the patient’s weight (2.6 MBq/kg), with a 185-MBq maximum.
Imaging Protocol
The PET studies were performed on an Advance PET tomograph (General Electric Medical Systems) providing 35 image planes over a 15-cm axial field of view with a 4.25-mm slice spacing (30). The image study design, injection procedure, and imaging parameters for this group of patients have been described elsewhere (16). Briefly, images were acquired with the following sequence: eight 15-s, four 30-s, six 60-s, two 5-min, and ten 10-min time frames. Images were reconstructed by the method of filtered backprojection using a 10-mm Hanning cutoff filter. Nine patients were dynamically imaged for 120 min, with the remaining patients imaged for 90 min.
Blood Sampling and Metabolite Analysis
Seven patients had either 24 or 30 arterial blood samples assessed for radioactivity throughout the 90 or 120 min of imaging, respectively. The remaining patients had limited venous sampling at 1, 5, 10, 15, 20, 30, 45, 60, 90, and 120 min after injection. Venous samples were used to calibrate image-derived cardiac input functions from left ventricular regions of interest (ROIs) to generate an arterial input function. For each blood sample, 0.1 mL plasma and 0.1 mL whole blood were assayed for radioactivity.
FLT catabolism primarily occurs in the liver to produce a glucuronide conjugate, which is exported to the blood and eventually is cleared by the kidneys (19,20). 18F-FLT and 18F-FLT-glucuronide metabolite appears to be the only observed labeled species in blood during the imaging studies. Because FLT has negligible serum protein binding (31), all of the activity associated with FLT in blood was assumed to be available for tissue uptake. We developed a simple solid-phase extraction chromatography (SepPak; Waters Corp.) for the separation of FLT from FLT-glucuronide. An aliquot (0.5 mL) of the plasma from arterial and venous samples was assayed for the relative amount of FLT and FLT-glucuronide. To minimize the number of metabolite determinations, we applied an empiric curve fit similar to approaches we have used in comparable settings (32). The fraction of total activity present as FLT versus the time after injection was fitted to a monoexponential curve with a scaling factor using a nonlinear least-squares regression (NLR) optimization procedure:
 Eq. 1 The 3 floating variables were s, a scale factor; c, an offset value; and k, a rate parameter. These variables were fit to the FLT assay data for each patient. The curve provides a continuous function describing the fraction of the total plasma activity associated with FLT versus metabolites. The fractional FLT curve was applied to the total blood activity curve to provide a metabolite-corrected FLT input function used for further modeling analysis on individual patient datasets.
PET Image Processing
ROIs for tumor, marrow, and muscle were identified on images summed between 30 and 60 min, an interval when transport of the radiotracer from blood to tissue is predominantly unidirectional. ROI construction with Alice image processing software (Hayden Image Processing Group) was aided by referencing the closely aligned CT images. The ROIs from contiguous slices were combined to create volumes of interest (VOIs) for each tissue type. Tumor and vertebral marrow VOIs were constructed on summed FLT images by creating a perimeter region at 50% of the maximum pixel value of the entire volume. All pixels within this region for each slice were included in the volume. VOIs were applied to the dynamic image set for data extraction. Marrow regions typically covered 15 slices with a total volume of approximately 30 mL. No marrow ROI dimension was <2 cm so that partial-volume correction was not required. Tumor regions were placed on all of the planes containing portions of the lesion that were >50% of the tumor maximum pixel value. Tumors were variable in diameter ranging from 1.5 to 7.7 cm. Those with less than twice the reconstructed resolution of approximately 10 mm in any direction (n = 10), as determined from CT scans, had partial-volume correction applied using a measured recovery coefficient (33) as described in a prior report (16). Muscle VOIs from the arm or back were generated from aligned transmission and CT scans and typically covered 15 slices resulting in a 100- to 200-mL VOI and did not require partial-volume correction.
Quantitative Analysis
Model-independent estimates of FLT uptake were assessed by the SUV and by a modified graphical analysis. The SUV was determined from the activity in each region obtained from the 30- to 60-min summed FLT image (Ci) and normalized to the injected dose and the patient’s weight using the following formula:
 Eq. 2 The modified graphical determination (34) of FLT flux corrects for blood metabolites, which are confined to the blood pool. This graphical determination of flux may be valid for a short interval after injection, when the approximation of unidirectional transfer of FLT from blood to tissue holds (35,36). The method assumes that phosphorylated FLT nucleotides are retained in the tissue. In the plot of normalized uptake [Ci(t)/Cb (t)] versus normalized time [∫0tCpFLT(τ)dτ/Cb(t)], the slope of the linear portion of the curve estimates the flux of FLT (KFLT) into the tissue region and occurs after the equilibration phase. The onset of pseudoequilibration of the tissue compartment has been assumed to be 5 times the clearance half-life of the free precursor pool, roughly estimated by 0.693/(k2 + k3) (35). From the initial evaluation of FLT kinetic parameters, this time was approximately 15 min, which was used as a lower boundary for graphical analysis. Significant deviation from linearity for graphical analysis was observed after 50 min for most tumor regions. Therefore, 15 and 50 min were chosen as the time boundaries for the linear fit in the graphical analysis.
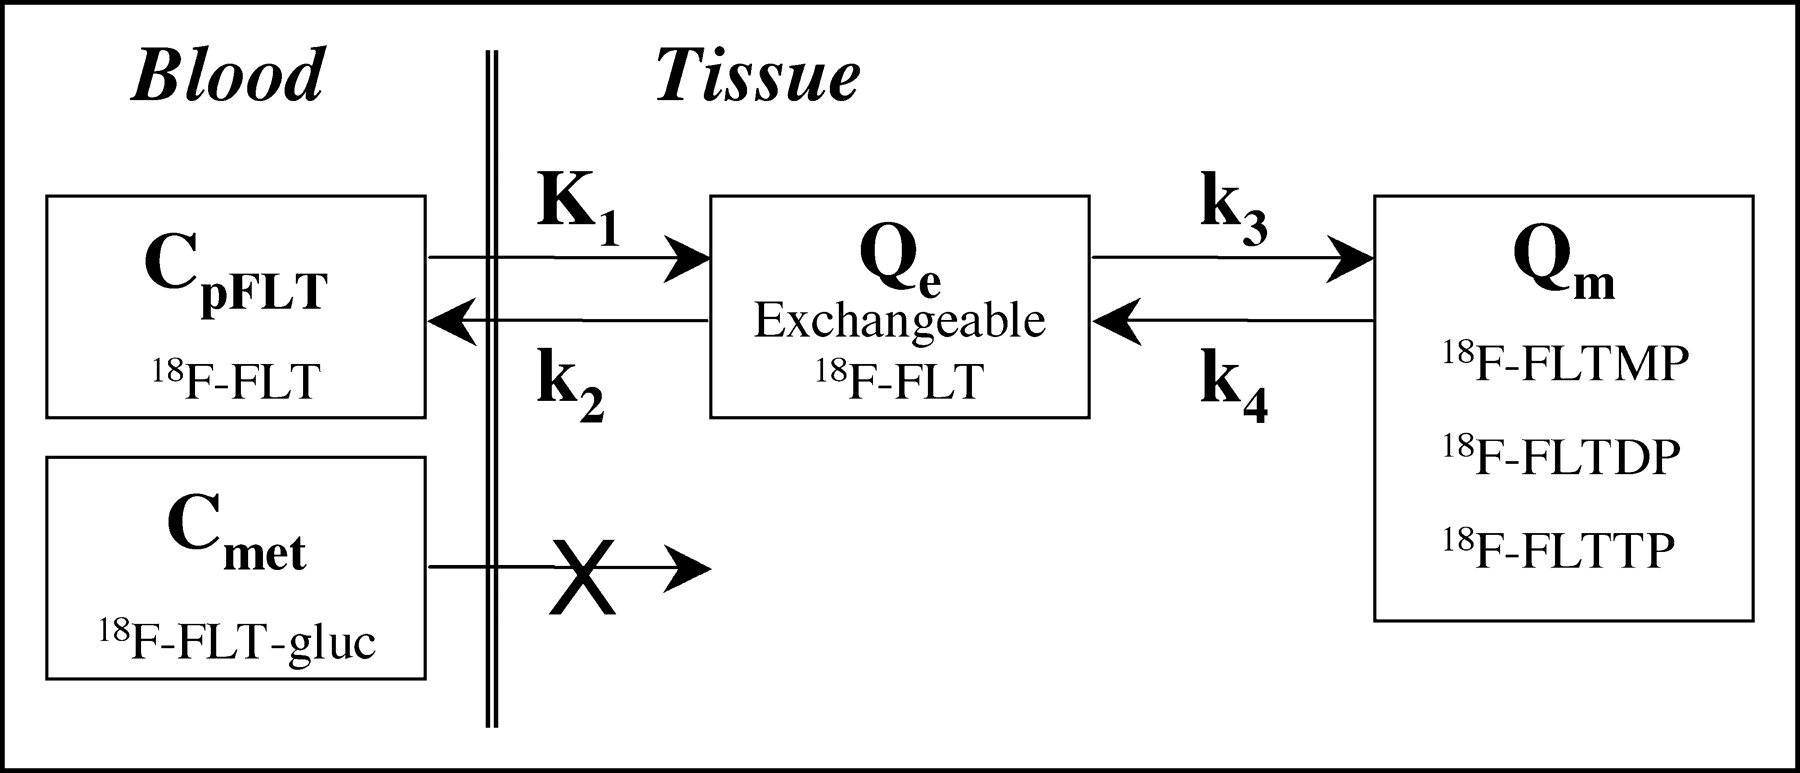
For each time frame of the dynamic imaging sequence, the average MBq/mL within the VOI was used for compartmental model analysis. The regional VOI activity curves, the metabolite-corrected arterial input curve, and the total arterial activity curve were fitted to the FLT compartmental model (Fig. 1) using the weighted Levenberg–Marquart least-squares minimization algorithm as implemented in a software package designed for PET data analysis (PMOD version 2.5; PMOD group, Zurich, Switzerland (37)). The 2-tissue compartment, 4-rate parameter model (4P) is described in a companion report (27) and is illustrated in Figure 1.

Kinetic model of FLT metabolism is comprised of an exchangeable tissue compartment and a compartment of trapped FLT phosphate nucleotides. Four rate constants describe kinetic transfer rates between the 2 compartments. FLTMP = FLT-monophosphate; FLTDP = FLT-diphosphate; FLTTP = FLT-triphosphate; FLT-gluc = FLT-glucuronide; Qe = exchangeable tissue compartment; Qm = compartment of trapped FLT phosphorylated nucleotides; CpFLT = concentration of FLT in arterial plasma; Cmet = concentration of metabolites in arterial plasma.
The individual rate constants, K1, Vd (=K1/k2), k3, and k4 and the regional Vb, the fraction of vascular activity in the tissue VOI, were allowed to float during the optimization process. Starting values and ranges of the parameters appear in Table 2 of the companion report (27). The residuals were weighted by the inverse variance of the total counting rate in each frame of data, based on the SD of the total uncorrected counts and the duration of the time frame (38). Model parameters were estimated by minimizing the weighted residual sum of the square error (WRRS) between the model solution and the PET measurement. For the datasets > 90 min, model optimization was also performed with the first 90 min of data to generate a complete set of estimates with the same duration. The FLT flux, KFLT, was estimated by compartmental modeling using parameters derived from fitting the FLT input function and the total blood activity curve to the tissue time–activity curve data:
 Eq. 3
Eq. 3
Once thymidine is incorporated into DNA, it is retained for the duration of the imaging period. However, phosphorylated nucleotides of FLT (FLT-monophosphate, FLT-diphosphate, FLT-triphosphate) can be dephosphorylated back to FLT with the potential to leave the imaging region (21). The loss of image signal through this process, described by k4, should be identifiable and distinct from other rate constants (27), so that the inclusion of k4 should improve the fit of the model to the data. We tested this hypothesis with patient datasets from 90 to 120 min of imaging using the corrected Akaike Information Criteria (AICc) (39) by comparing a 4P (including k4) model and a 3-parameter (3P; no k4) model on identical patient tumor data. The most appropriate model is not necessarily the model producing the smallest WRRS, since adding more parameters generally decreases WRRS. The AICc score applies a penalty for additional parameters, which balances the error from fitting the model to the data and minimizing the number of parameters in the model. A lower AICc score for a model that includes k4 would indicate that the 4P model accounts for the data better than a 3P model with a higher AICc score.
To test the effect on parameter estimates of using a simpler model (3P) and the shorter imaging period described in one report (17), we analyzed the first 60 min of each dataset using a 3P model (k4 fixed to 0) and compared the results with the full dataset analyzed using the 4P model. We expected the 3P model to underestimate KFLT compared with a longer imaging acquisition applying a 4P model that accounts for label loss (36,40). The effect of blood metabolite levels on KFLT estimation was also examined by fitting the tissue curves with the total blood activity curve.
Statistical Analysis
To assess the relationship between an independent assessment of cellular proliferation and various PET measures of FLT uptake, correlations of Ki-67 LI were made between flux parameters from the 4P model (120 and 90 min of data), the 3P model (60 min of data), graphical analysis (15- to 50-min interval), and the average SUV (30–60 min of data). The correlations between FLT PET uptake values or model estimations and the categoric variable Ki-67 LI were tested using the nonparametric rank correlation by Spearman (ρ). Comparisons between groups of the continuously distributed variables were made using standard parametric statistical tests (2-tailed paired Student t test). Statistical analyses were performed using the statistical software JMP (SAS Institute).
RESULTS
Blood and Tissue Activity Curves
Typical blood and plasma activity curves appear in Figure 2A. There were no differences in FLT concentrations between plasma and whole blood. Arterial and venous blood samples were compared for 6 patients. The average deviation between the total whole blood and plasma activity concentration was 5% ± 8% (mean ± SD, n = 127 samples). There were no significant differences for blood-to-plasma ratios between arterial (mean ± SD, 0.96 ± 0.07) and venous (mean ± SD, 0.97 ± 0.08) samples over the 2-h study period. Metabolite analysis of several blood samples provided the fraction of activity present as FLT. A typical result is shown in Figure 2B.

Blood sampling for FLT was acquired through either venous or arterial catheters at various times after injection. (A) Several patients (n = 6) had both blood and plasma activity determined from each sample. (B) Activity in blood after injection of 18F-FLT is comprised of both FLT and a labeled metabolite (FLT-glucuronide) determined by an independent assay. (C) Combining total activity in blood and the FLT fraction permits generation of an input function for FLT used to quantitate FLT tissue retention. %ID/g = percentage injected dose per gram.
A typical FLT input function (Fig. 2C) is derived from the blood activity in Figure 2A and the metabolite-correction function in Figure 2B. The proportion of FLT and metabolites of FLT in blood showed a predictable time course, with an approximately 5% coefficient of variation (COV) over the set of patient analyses (range, 0.2%–8.1% COV). The average fraction ± SD of the total activity present as labeled metabolites was 25% ± 5% at 60 min (n = 17) and 30% ± 6% at 120 min (n = 9).
An example FLT patient image for 30–60 min after injection and tissue time–activity curves are shown in Figure 3. They demonstrate the anticipated variation in FLT uptake between different tissues. Proliferative normal tissues such as bone marrow showed rapid early uptake and high persistent retention. Muscle showed a much reduced and largely reversible uptake, which mirrored the blood activity a few minutes after injection. Tumor showed uptake between muscle and marrow and often showed a late decline in uptake, similar to the tumor curve in Figure 3A.
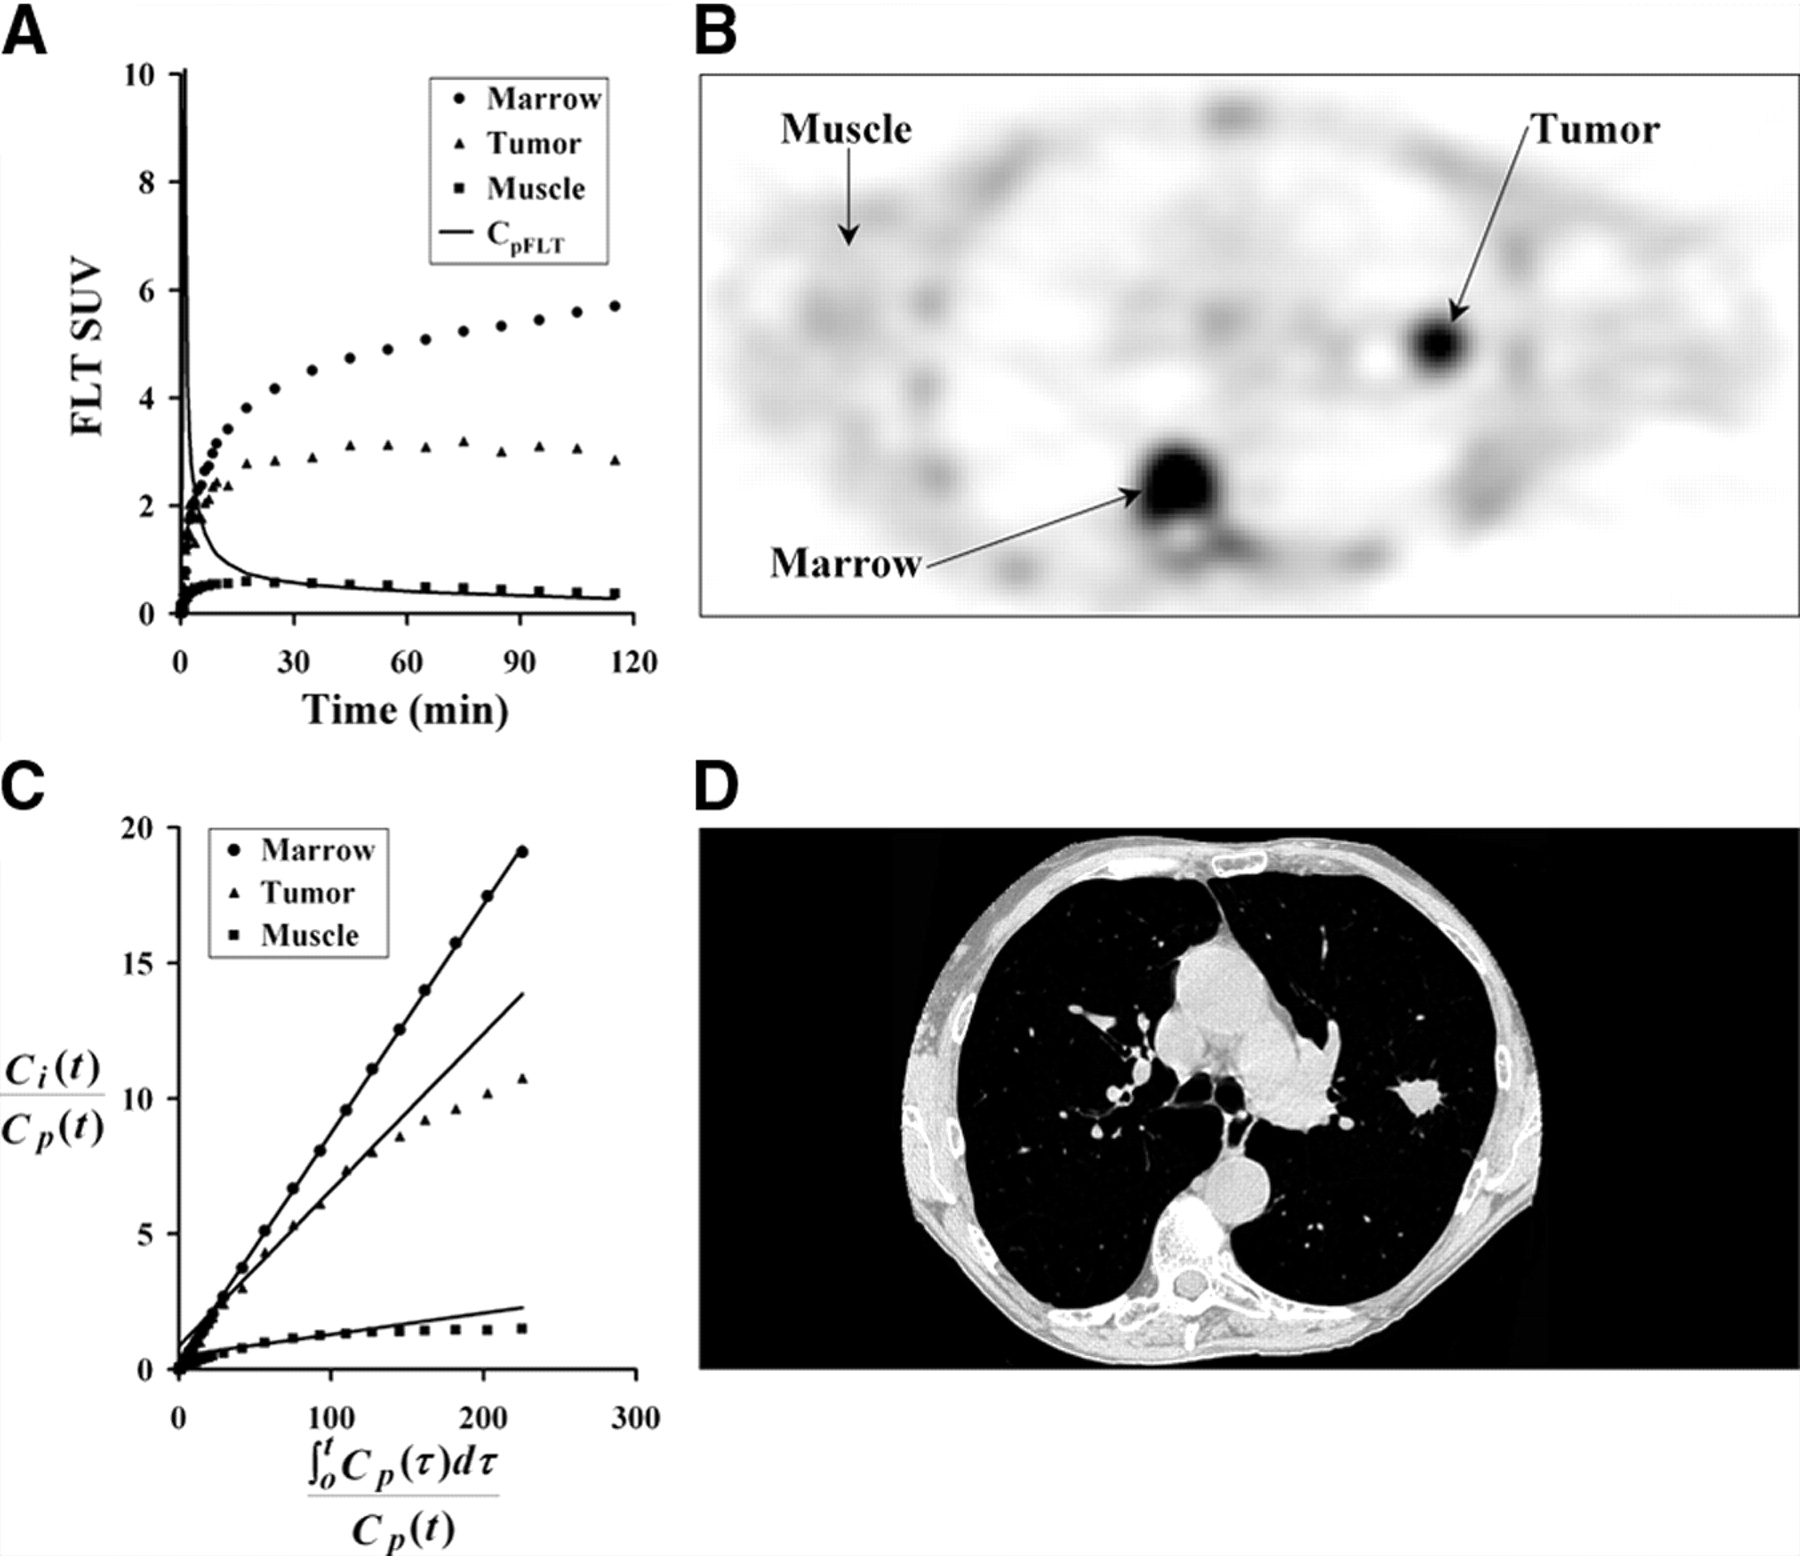
Three tissue types were investigated for FLT uptake. (A) Example of patient tissue time–activity curves decay corrected to time of injection. (B) Patient PET image acquired 30–60 min after injection of 118.4 MBq FLT. (C) Graphical analysis plot of normalized tissue uptake vs. normalized time for marrow, tumor, and muscle. (D) CT image close to PET image slice provides information for ROI placement and determination of recovery coefficients for tumor regions. Patient’s arms are not in field of view for standard CT protocol.
Parameter Estimates
The mean and range of FLT model parameter estimates for marrow, muscle, and tumor using 120 or 90 min of data are presented in Table 1. The parameter estimates from a subset of the activity curves fit for 60 min of data using the 3P model also appear in Table 1. Model optimization results suggest that FLT is not retained to any significant degree in tissues with low or no proliferation, such as muscle. For tumors imaged for 120 min, we observed a finite rate of late label loss, with an average estimate for k4 of 0.020 min−1 (range, 0.011–0.050 min−1, n = 10), which was highly correlated (r = 0.91, n = 10) with k4 estimates using 90 min of data (0.023 min−1, range 0.014–0.052 min−1, n = 10). Consistent with this finding, a characteristic late downward curvature in the graphical analysis relationship was observed for most tumors (for example, Fig. 3C). This was not the case for marrow with little downward curvature and a mean k4 of 0.006 min−1 (range, 0.001–0.014 min−1).
Average FLT Parameter Estimates and Range for Tumor, Marrow, and Muscle
The inclusion of k4 in the model for tumors was supported by a lower AICc for 15 of the 18 tumor datasets using the 4P model with 90 min of data (Table 2) when compared with a 3P model using the same data. The 3 patients with higher AICc values for the 4P model had estimated tumor k4 values close to zero (0.003, 0.007, and 0.007), much lower than the mean k4 for the group of 0.017 min−1 (n = 18).
AICc Values for 3P and 4P Models Using Identical Sets of Patient Data
The model analysis in our companion report (27) revealed that individual parameters covaried significantly but that 2 parameters robustly and independently estimated transport (K1) and overall flux (KFLT). Additionally, K1 is primarily determined in the first few minutes after injection (27). The estimation of initial transport is expected to be similar between the 3P and 4P models. We therefore compared KFLT for the different analytic methods to assess the effect of model choice on parameter estimates. Flux values (KFLT) obtained from the 4P model with 120 min of data (mean, 0.064 mL/min/g; range, 0.014–0.099 mL/min/g; n = 10) correlated with KFLT values estimated from graphical analysis (mean, 0.047 mL/min/g; range, 0.011–0.076 mL/min/g; r = 0.86), a 4P model using only 60 min of data (mean, 0.058 mL/min/g; range, 0.005–0.101 mL/min/g; r = 0.87), and KFLT estimates from a 3P model using only 60 min of data (mean, 0.047 mL/min/g; range, 0.009–0.071 mL/min/g; r = 0.94) and are presented in Table 3. The KFLT estimates from the 4P model with 120 min of data were compared with average SUV values 30–60 min after injection and showed a poor correlation (mean, 4.03; range, 0.99–7.55; r = 0.62; n = 10).
Correlation of FLT Uptake Parameter Estimates
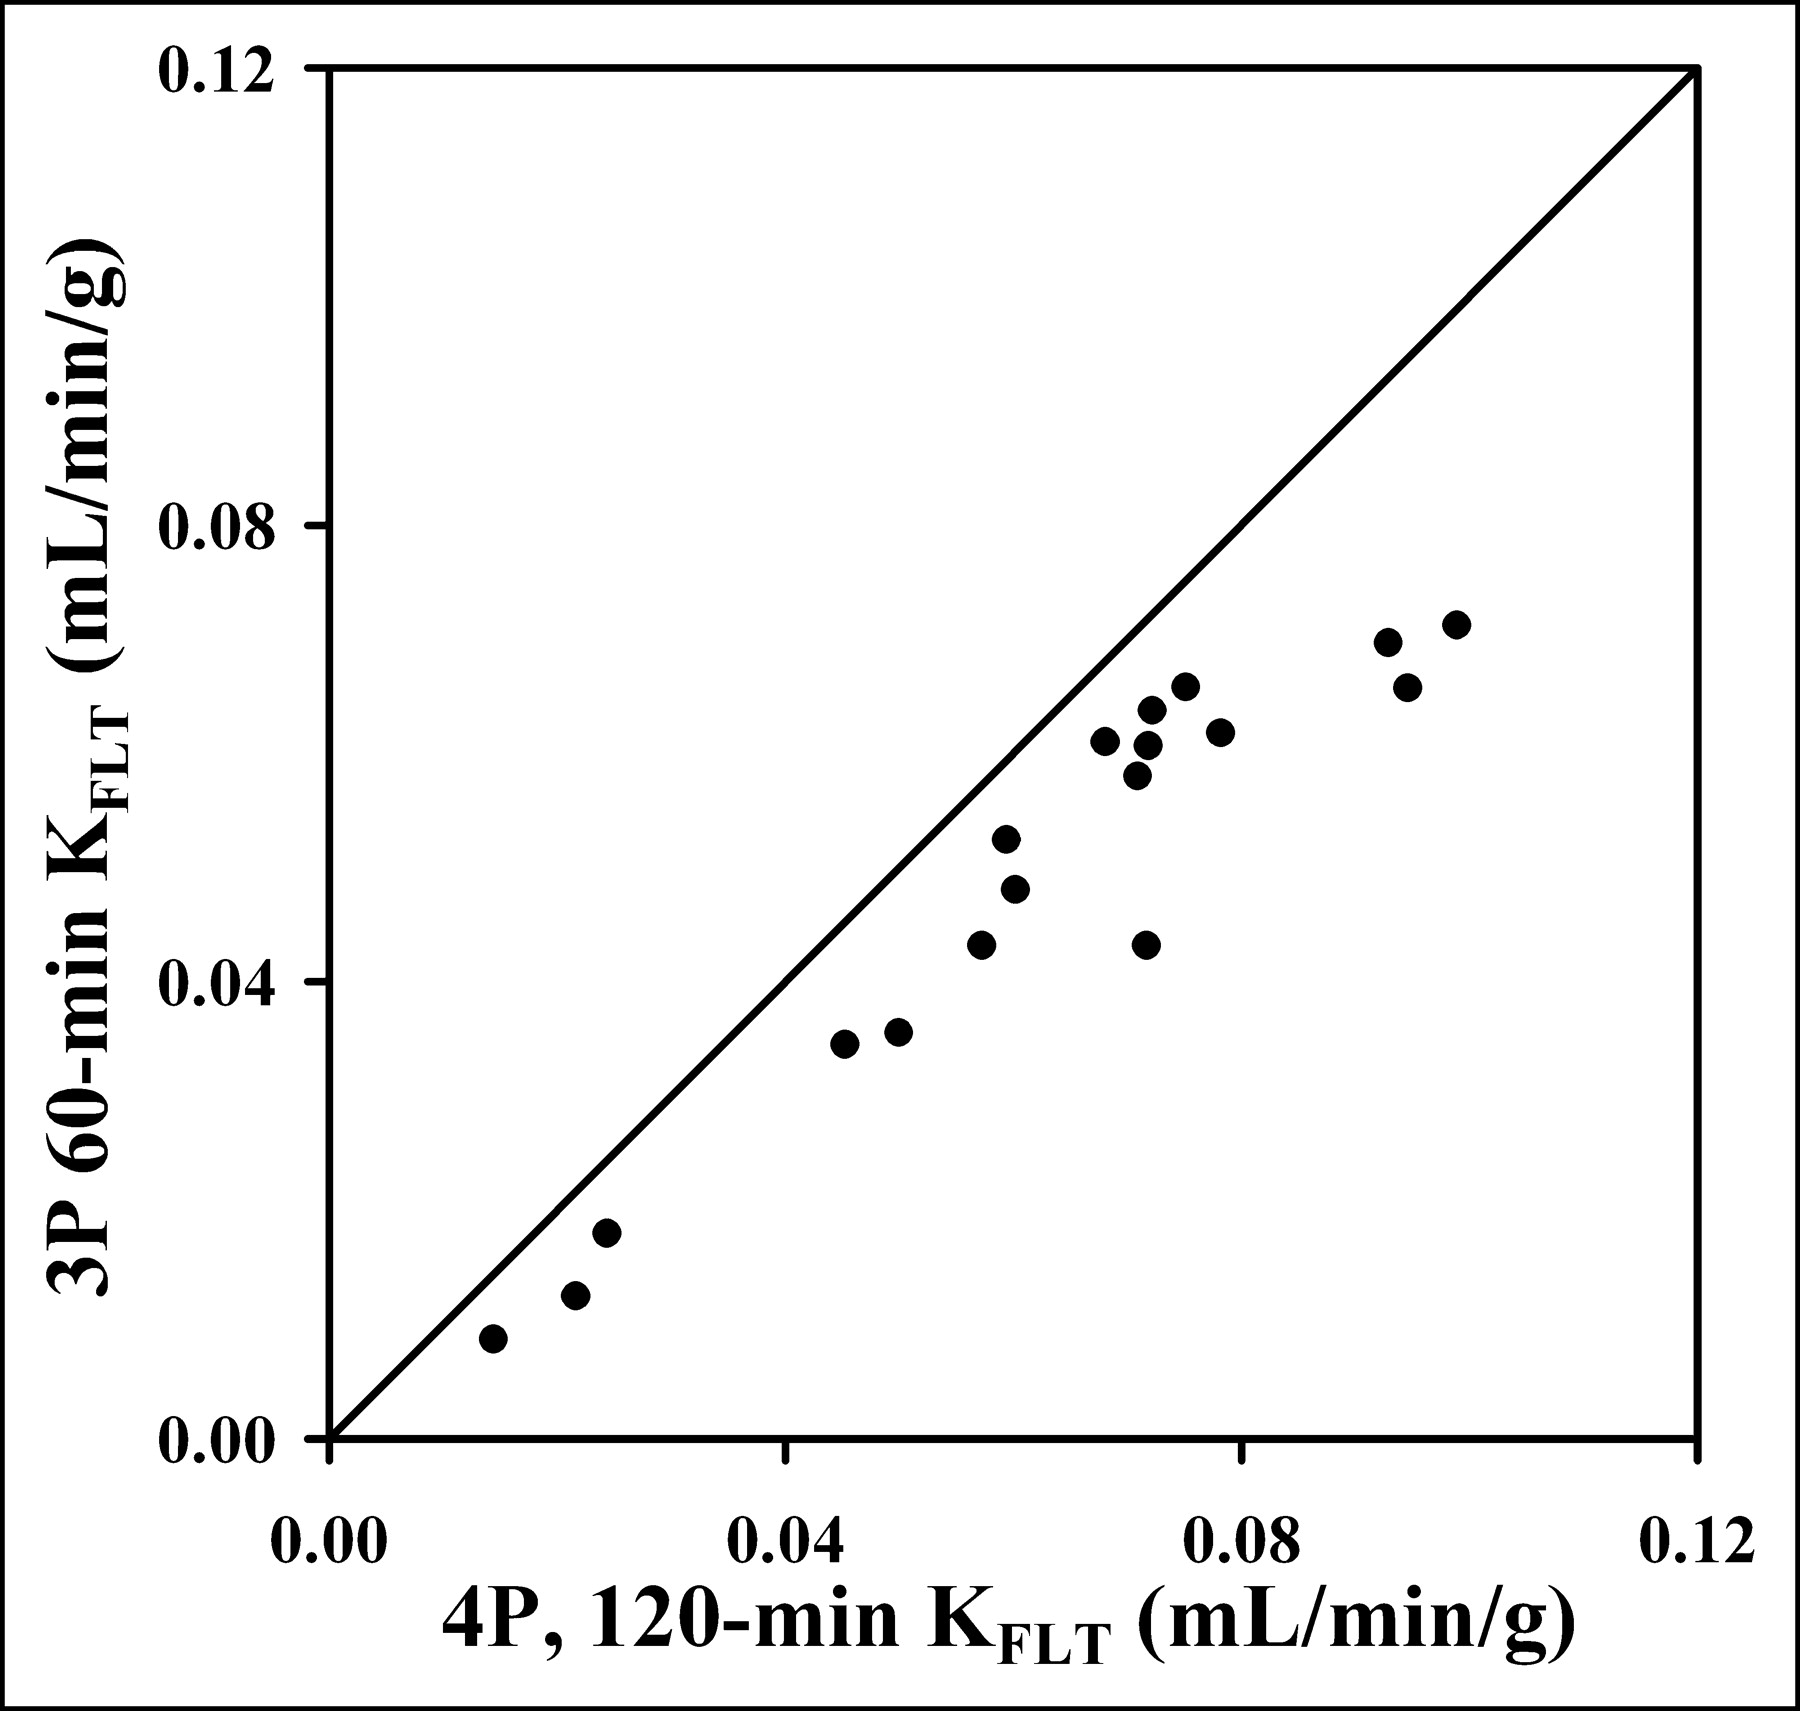
However, KFLT estimates from the 90-min 4P model were consistently higher compared with the 3P model estimates (mean, 26%; range, 10%–46%), as illustrated in Figure 4 and Table 4. The 90-min 4P model estimates of KFLT were also higher than estimates using a 4P model with 60 min of data (mean, 16%; range, −19% to 70%) and the graphical approach (mean, 30%; range, 1%–67%). In a separate analysis of the effect of blood metabolites on parameter estimates, the assumption that the total blood activity was entirely FLT would lead to an underestimate of KFLT by as much as 47%.

Estimated KFLT value from 1 h of imaging and blood data using 3P model show high correlation with KFLT estimates using 4P model (r = 0.95; n = 18). The 60-min determination that ignores k4 consistently underestimated the KFLT value determined using more data and the 4P model.
Average Percentage Change of KFLT from 4P Model
Correlation with Ki-67 LI
Eighteen tumor specimens were collected by biopsy after FLT PET, and sections were analyzed by Ki-67 IHC. KFLT from the 4P model (either 120- or 90-min sets) versus Ki-67 LI showed a high degree of correlation (Spearman ρ = 0.92; P < 0.0007) (Fig. 5). A similar comparison, but using a 3P model with 60 min of data, had a Spearman correlation of ρ = 0.87 (P < 0.0001; n = 18), and a 4P model with 60 min of data had a correlation of ρ = 0.71 (P < 0.0011; n = 18) (Table 5).
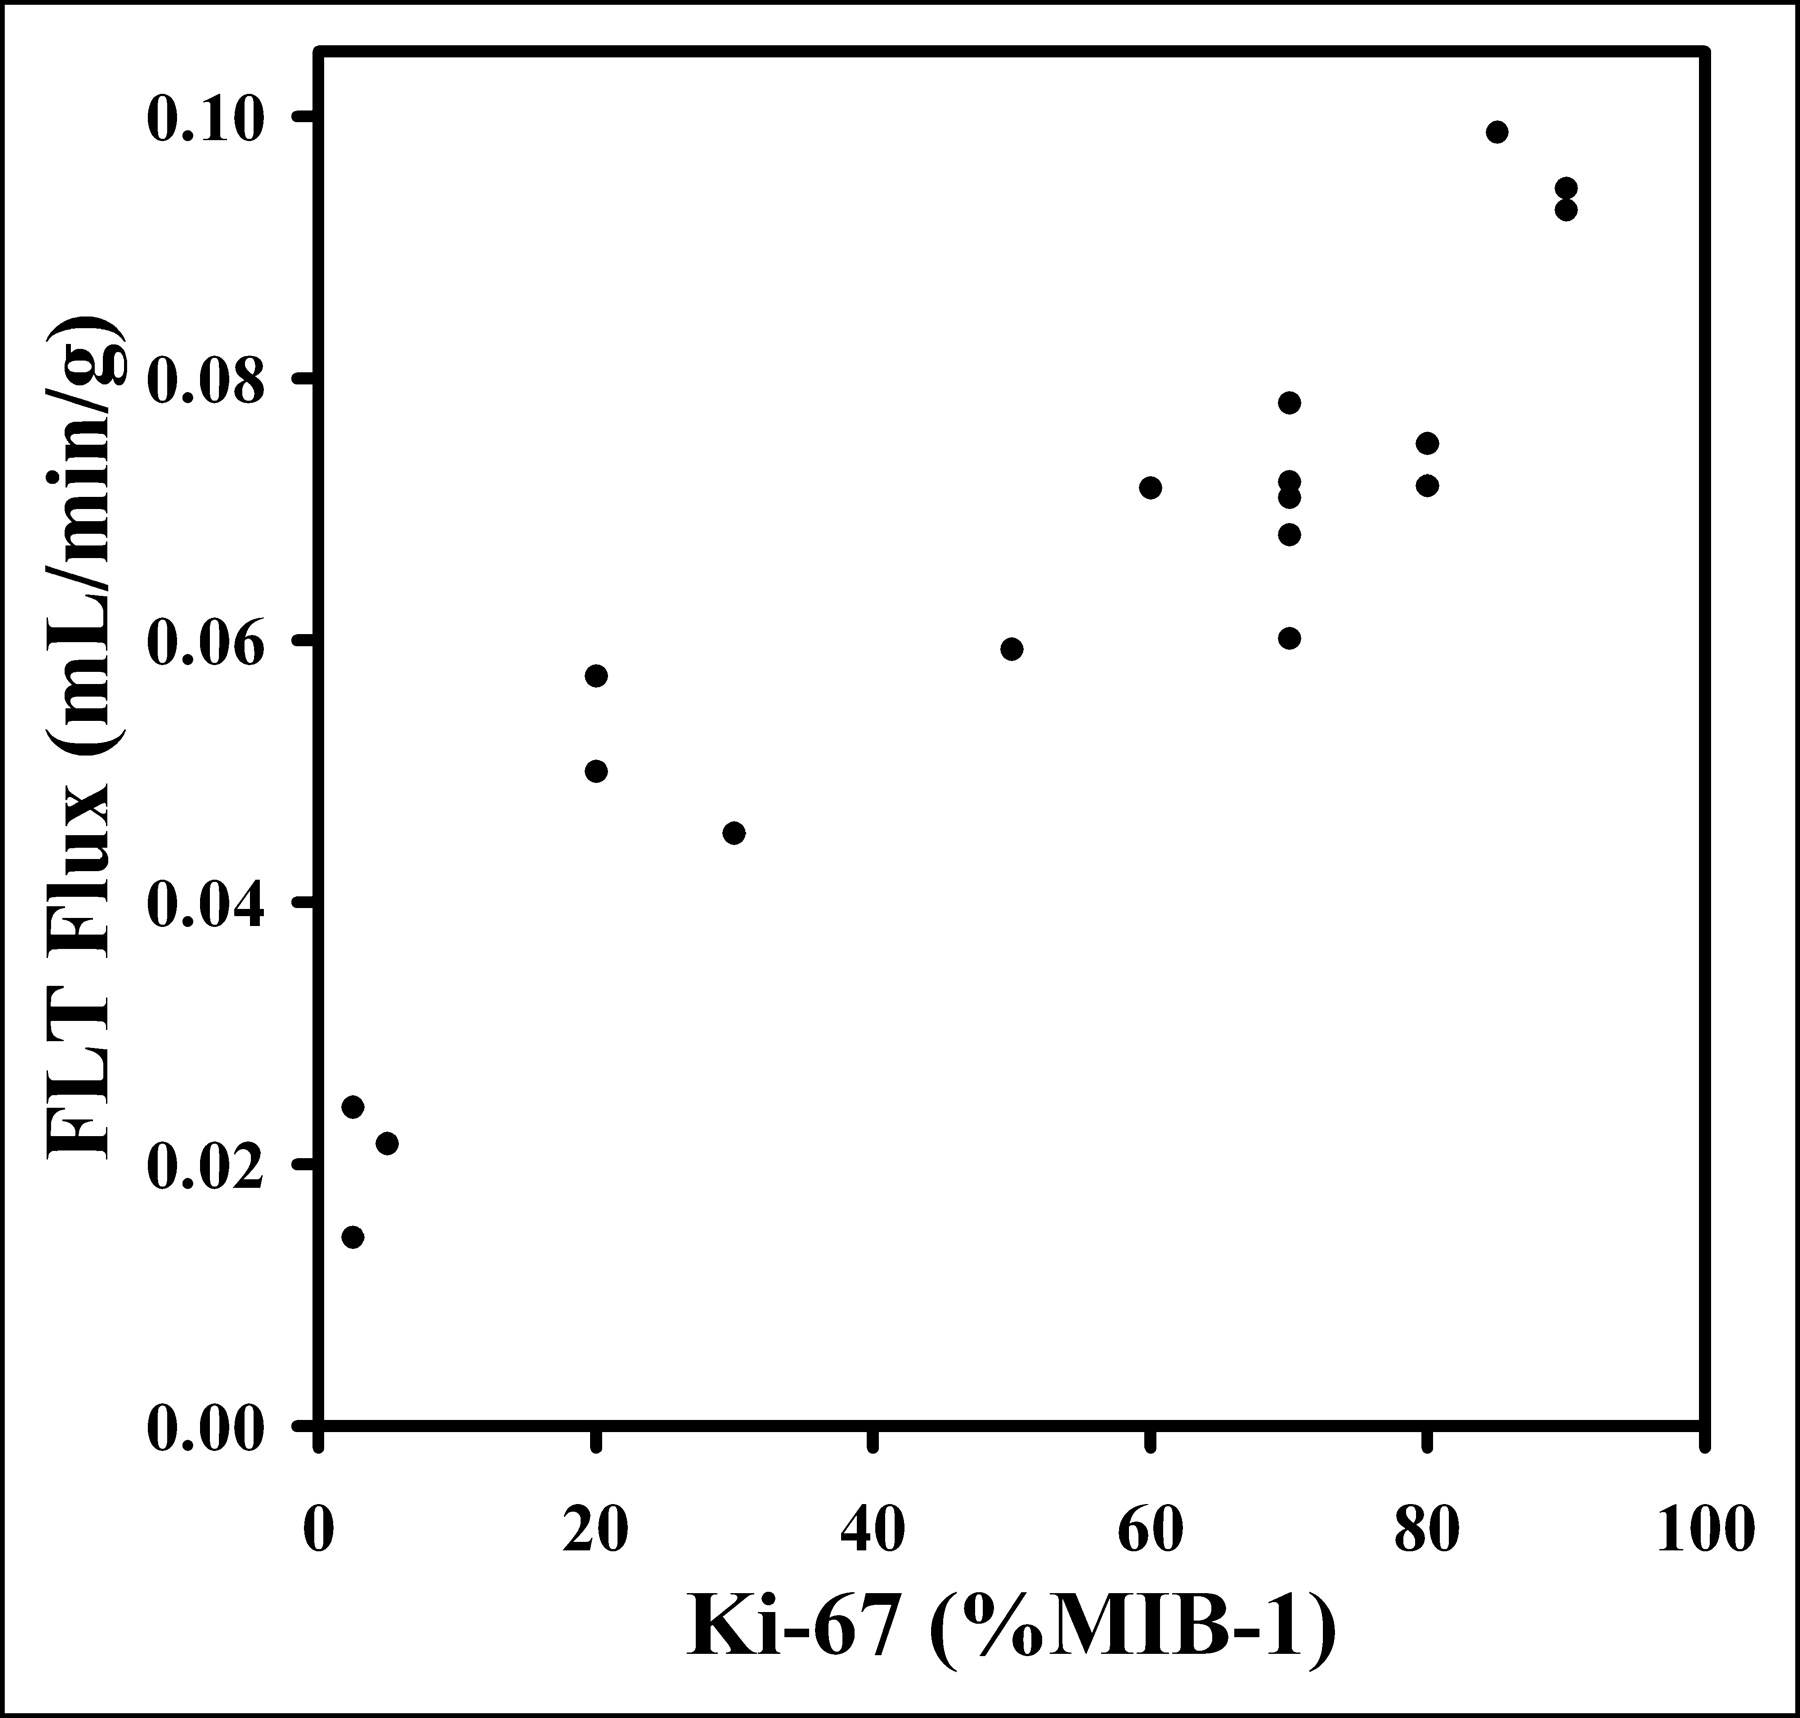
Ki-67 LI determination from tissue biopsy specimens allows for independent assessment of cellular proliferation. Plot of FLT flux determined from 4P model vs. Ki-67 LI shows high degree of correlation (ρ = 0.92), suggesting that use of FLT is appropriate for noninvasive estimation of cellular proliferation.
Correlation of Estimations of FLT Uptake with Ki-67 LI
DISCUSSION
Cellular proliferation is an important factor in the assessment of lung cancer. FLT PET offers a noninvasive quantitative method for determining growth. The present study was intended to evaluate a compartmental model to quantitate FLT uptake and retention in lung cancer patients. It requires dynamic PET, blood sampling, and determination of blood metabolites.
Our analysis of blood samples showed no significant partitioning of FLT between red blood cells and plasma. Thus, simple techniques such as counting aliquots of plasma can be applied to patient blood samples or image-derived whole blood activity from ROI analysis can be used. Furthermore, there were no statistical differences between activity measurements from plasma and whole blood or differences in metabolite assay results between arterial and venous sampled blood from 5 to 120 min. Therefore, limited venous sampling acquired late in the imaging sequence can be used to scale an image-based input function (17) to simplify the generation of an individual input function for FLT modeling.
The kinetic parameters of FLT in NSCLC tumors are quite different than marrow, reflecting differences in the biochemistry of each tissue. The salvage pathway is important and elevated in marrow due to the recovery of DNA from red blood cell enucleation. Marrow shows a rapid early uptake, with steady increases over time and a small rate of loss of the trapped tracer (average k4 = 0.006 min−1; range, 0.001–0.014 min−1; 4P model, 120 min, n = 9). Our estimates of KFLT for marrow (mean, 0.078; range, 0.058–0.109 mL/min/g, n = 9) determined from 120 min of data (4P model) were similar to estimates in other reports (17).
In contrast to marrow, most lung tumor regions showed a notable loss of activity at later times, most likely due to dephosphorylation of FLT-monophosphate to FLT followed by loss of FLT from cells. The average estimated rate of loss (k4) for 90 min of data was 0.019 min−1 (range, 0.001–0.052 min−1, n = 18). This is at least twice the loss rate of FDG seen in brain tumors (40). Ignoring k4 assumes that all FLT nucleotides are retained in the tissue during the imaging period. As a result, the estimated FLT flux was consistently underestimated when k4 was ignored in the analysis of 60 min of data using the 3P model relative to estimated parameters from the 4P model with 60, 90, or 120 min of patient data. The assumption of no loss of label from the tissue is not supported by the data, particularly in lung tumors. In our examination of lung tumor KFLT, estimates from a 4P model with 120 min of data were underestimated an average of 26% (range, 1%–67%) using a 3P model with 60 min of data, and underestimated by 27% (range, 12%–40%) using graphical analysis. The level of underestimation was only 11% (range, −19% to 70%) using the 4P model with 60 min of data. Our results differ from a previous report on colorectal cancer (17), in which estimates of KFLT using a 4P model were lower than estimates using a 3P model. However, only 60 min of imaging was performed in that study, and this time is inadequate for accurately estimating k4.
Several earlier studies have shown that ignoring label loss by ignoring k4 in a 2-compartment model leads to an underestimation of the overall flux value (36,40), similar to our findings for KFLT. This effect is likely to be particularly important in serial studies to monitor response to therapy, because k4 may vary with treatment. Studies using serial FLT PET to follow the proliferative response of tumors to treatment will need to characterize late FLT loss (k4). At this time, a simpler method such as the SUV or graphical analysis, which ignores k4, is not a valid substitute for more detailed analyses. For example, if both KFLT and k4 declined over the course of treatment, then the decline in KFLT would be underestimated if k4 were not estimated independently. Conversely, an increase in k4 with treatment might falsely suggest a decline in KFLT or SUV, even if no change in the tumor growth rate had occurred. These examples would apply to tumors where k4 is elevated but may not apply to other cancers, which may possess low levels of 5′(3′)-deoxyribonucleotidases.
We found an acceptable correlation between parameter values for 90 versus 120 min of data from the 10 patients imaged for 2 h (r = 0.99 for KFLT and r = 0.91 for k4). This suggests that 90 min of data are adequate for parameter estimates for the 4P model. The correlation between tumor KFLT estimated from a 4P model with 90 min of data (n = 18) and measures of assessment such as the average SUV (r = 0.67), graphical KFLT estimates (r = 0.88), or using a 3P (r = 0.95) or 4P (r = 0.86) model with 60 min of tumor data suggest that these simpler methods are suboptimal for lung tumors. Simple measures of assessment that do not fully account for FLT uptake and loss from tissues retain some correlation with KFLT but they lead to significant bias.
For patients with lung tumors, we compared estimates of KFLT using a 4P model and proliferative activity as indicated by Ki-67 LI. There was a high correlation index (ρ = 0.92; P < 0.001, n = 10) between Ki-67 LI and KFLT estimated using a 4P model with 120 min of data. Our study supports previous reports that FLT uptake reflects tumor proliferation as assessed by Ki-67 IHC in biopsy specimens (16,18).
CONCLUSION
This study confirms that the accumulation of FLT in proliferating tumor, as indicated by Ki-67 immunostaining, is highly correlated with FLT uptake, as estimated by KFLT values derived from analyzing at least 90 min of data with a 4P model of FLT metabolism. FLT PET may be useful for noninvasively assessing cellular proliferation, which is relevant to the prognostic assessment for many tumors, including NSCLC. The model estimation of overall flux (KFLT) from simpler methods of analysis did not correlate as well with KFLT from the 4P model using 120 min of data for lung tumors. The 3P and graphical approaches significantly underestimate KFLT by 25%–30% compared with the 4P model—particularly in lung tumors, where loss of label (k4) may be substantial. These results may vary in tumors other than lung cancer. Extending the analysis of FLT metabolism to a larger patient population and other types of tumors will be needed to determine the extent to which simpler methods can be substituted for a more detailed approach in patient studies—particularly in serial studies to monitor response to therapy, where k4 may change independently from other parameters.
Acknowledgments
This work was supported by National Institutes of Health grants CA42045, CA80907, and RR17229. We greatly appreciate the assistance of Pam Pham and Barbara Lewellen for assistance in the imaging procedures, Steve Kohlmyer for his analysis of the recovery coefficient data, and Drs. Jeanne Link and Finbarr O’Sullivan for reviews of the manuscript.
Footnotes
Received June 14, 2003; revision accepted Sep. 13, 2004.
For correspondence or reprints contact: Mark Muzi, MS, University of Washington Medical Center, Box 356465, 1959 N.E. Pacific St., Seattle, WA 98195-6465.
E-mail: muzi{at}u.washington.edu
REFERENCES
In this issue


Jump to section
Related Articles
Cited By...
- Principles of Tracer Kinetic Analysis in Oncology, Part II: Examples and Future Directions
- Total-Body Quantitative Parametric Imaging of Early Kinetics of 18F-FDG
- Monitoring Response to Transarterial Chemoembolization in Hepatocellular Carcinoma Using 18F-Fluorothymidine PET
- FLT PET/CT imaging of metastatic prostate cancer patients treated with pTVG-HP DNA vaccine and pembrolizumab
- Using Radiolabeled 3'-Deoxy-3'-18F-Fluorothymidine with PET to Monitor the Effect of Dexamethasone on Non-Small Cell Lung Cancer
- Assessment of Simplified Methods to Measure 18F-FLT Uptake Changes in EGFR-Mutated Non-Small Cell Lung Cancer Patients Undergoing EGFR Tyrosine Kinase Inhibitor Treatment
- Pre-clinical Validation of Orthotopically-implanted Pulmonary Tumor by Imaging with 18F-Fluorothymidine-Positron Emission Tomography/Computed Tomography
- PET Imaging of Proliferation with Pyrimidines
- Pharmacodynamic Study Using FLT PET/CT in Patients with Renal Cell Cancer and Other Solid Malignancies Treated with Sunitinib Malate
- Specific biomarkers of receptors, pathways of inhibition and targeted therapies: clinical applications
- Discriminant Analysis of 18F-Fluorothymidine Kinetic Parameters to Predict Survival in Patients with Recurrent High-Grade Glioma
- Tumor 3'-Deoxy-3'-18F-Fluorothymidine (18F-FLT) Uptake by PET Correlates with Thymidine Kinase 1 Expression: Static and Kinetic Analysis of 18F-FLT PET Studies in Lung Tumors
- Changes in 18F-Fluorodeoxyglucose and 18F-Fluorodeoxythymidine Positron Emission Tomography Imaging in Patients with Non-Small Cell Lung Cancer Treated with Erlotinib
- Imaging Colon Cancer Response Following Treatment with AZD1152: A Preclinical Analysis of [18F]Fluoro-2-deoxyglucose and 3'-deoxy-3'-[18F]Fluorothymidine Imaging
- The future of imaging: developing the tools for monitoring response to therapy in oncology: the 2009 Sir James MacKenzie Davidson Memorial lecture
- Kinetic Analysis of 3'-Deoxy-3'-18F-Fluorothymidine (18F-FLT) in Head and Neck Cancer Patients Before and Early After Initiation of Chemoradiation Therapy
- Radiopharmaceuticals in Preclinical and Clinical Development for Monitoring of Therapy with PET
- Imaging Surrogates of Tumor Response to Therapy: Anatomic and Functional Biomarkers
- Kinetic Modeling of 3'-Deoxy-3'-18F-Fluorothymidine for Quantitative Cell Proliferation Imaging in Subcutaneous Tumor Models in Mice
- [18F]Fluorothymidine Positron Emission Tomography before and 7 Days after Gefitinib Treatment Predicts Response in Patients with Advanced Adenocarcinoma of the Lung
- Imaging of Cell Proliferation: Status and Prospects
- Glioma Proliferation as Assessed by 3'-Fluoro-3'-Deoxy-L-Thymidine Positron Emission Tomography in Patients with Newly Diagnosed High-Grade Glioma
- Dynamic Small-Animal PET Imaging of Tumor Proliferation with 3'-Deoxy-3'-18F-Fluorothymidine in a Genetically Engineered Mouse Model of High-Grade Gliomas
- 18F-FLT PET Does Not Discriminate Between Reactive and Metastatic Lymph Nodes in Primary Head and Neck Cancer Patients
- Kinetic Analysis of 3'-Deoxy-3'-18F-Fluorothymidine in Patients with Gliomas
- In vivo Biological Activity of the Histone Deacetylase Inhibitor LAQ824 Is detectable with 3'-Deoxy-3'-[18F]Fluorothymidine Positron Emission Tomography
- Comparison of Image-Derived and Arterial Input Functions for Estimating the Rate of Glucose Metabolism in Therapy-Monitoring 18F-FDG PET Studies
- The Progress and Promise of Molecular Imaging Probes in Oncologic Drug Development
- Quantification of Cellular Proliferation in Tumor and Normal Tissues of Patients with Breast Cancer by [18F]Fluorothymidine-Positron Emission Tomography Imaging: Evaluation of Analytical Methods
- Functional Imaging in Lung Cancer
- Kinetic Modeling of 3'-Deoxy-3'-Fluorothymidine in Somatic Tumors: Mathematical Studies