


Abstract
PET uses 18F-FDG widely to estimate glucose metabolism in vivo. Dynamic PET data are evaluated by kinetic models of the metabolic pathways. Knowledge of the metabolites of FDG is of critical importance for the interpretation of kinetic PET studies. The purpose of this study was to determine the metabolic pathways of FDG and 3-O-11C-methylglucose (MG) in liver tissue in vivo. It is usually assumed that MG is not metabolized and FDG is converted to 18F-FDG-6-phosphate (FDG-6-P). Methods: The study was performed on 6 anesthetized 40-kg pigs that were given the 2 tracers intravenously. The content of metabolites was determined in successive liver tissue biopsies. Freeze-clamped liver tissue samples were subjected to extraction by acetonitrile at −5°C to −10°C, and extracts were analyzed by radio–high-performance liquid chromatography (radio-HPLC). The findings were identified by means of radio-HLPC measurements of the products of in vitro enzymatic reactions. Results: The applied extraction technique provided almost quantitative recovery of the radioactivity from tissue. After MG injection, only MG was detectable in the liver tissue; no labeled metabolites were found. After FDG injection, 2 metabolites were identified, FDG-6-P and 2-18F-fluoro-2-deoxy-6-phosphogluconate (FD-6-PG1). The tissue content of FDG increased rapidly, and, after 5 min, only FDG was identified; hereafter, the fraction of FDG decreased to approximately 40% of the tissue radioactivity after 180 min. After 20 min, FDG-6-P was found in each of the pigs and it increased throughout the measurement period of 180 min, with a somewhat slower rise at late time points. FD-6-PG1 began to appear in the liver tissue after 45 min and increased throughout the 180-min experiment, with the increase somewhat slower than that of FDG-6-P. After 180 min, approximately 40% of the metabolites was attributed to FD-6-PG1. The content of other metabolites was <2%, even after 180 min. Conclusion: After the FDG injection, not only FDG-6-P but also FD-6-PG1 were formed in the liver. Any possible incorporation of FDG into glycogen was of minor importance.
The glucose analog 18F-FDG is widely used to estimate glucose metabolism of various organs and tumor tissues by dynamic PET. The time course of the tissue radioactivity is analyzed in relation to the time course of the arterial input (i.e., arterial blood radioactivity) by models of the biochemical pathways. The models for FDG are adapted from extensive studies of the metabolism of 1-14C-2-deoxy-d-glucose (DG) in brain by Sokoloff et al. (1) and Dienel et al. (2). DG enters the cells through the same transporters as glucose, where it is phosphorylated to 2-deoxy-d-glucose-6-phosphate (DG-6-P) (3). DG-6-P is not a substrate for hexose-6-P-isomerase. Dephosphorylation (within an observation time of 45–60 min (1)) or metabolism through the pentose phosphate pathway (4,5) is not considered to be of quantitative importance. Therefore, the metabolism of DG essentially ceases at this point in the pathway, allowing the assessment of DG metabolism by autoradiography (1) and, by analogy, of FDG by PET (6). The models for DG and FDG metabolism in brain include transport from blood into tissue, transport back to the blood, and intracellular phosphorylation (K1–k3 model) (1,6).
However, in prolonged studies, 14C-DG-6-P, 2-deoxy-d-glucose-1-phosphate (DG-1-P), and 2-deoxy-d-glucose-1,6-biphosphate (DG-1,6-P) were found in brain tissue (2), and incorporation of 3H- or 14C-labeled DG into glycogen has been reported in brain (7,8), heart, and skeletal muscle (9,10). DG-6-P is dephosphorylated in the liver by glucose-6-phosphatase (11), and liver models usually include a dephosphorylation step (K1–k4 model) (12–15).
In spite of the widespread use of modeling FDG kinetics in the assessment of glucose metabolism by PET, experimental studies to validate the metabolic fate of FDG are rare. Studies using nonradioactive 2-19F-fluoro-2-deoxy-d-glucose and 19F nuclear magnetic resonance (NMR) spectroscopy have identified a large number of metabolites in brain tissue (16–20). To perform NMR experiments, 100–400 mg/kg of FDG were used, which is about 100,000 times more than the tracer doses used in FDG PET studies. How such large doses of the glucose analog influence the metabolism may be questioned. Furthermore, the NMR studies focused on the identification of metabolites arising from the incorporation of FDG in glycogen, and other metabolic pathways such as the pentose phosphate pathway were not examined. Finally, only qualitative results are obtainable using 19F NMR spectroscopy.
To our knowledge, no systematic studies with measurements of the metabolites of FDG in brain or liver tissue have been published. In a tumor-bearing rat (21) and in an isolated perfused myocardium model (22), no metabolites other than 18F-FDG-6-phosphate (FDG-6-P) were identified. In the rat liver, the activity of glucose-6-P dehydrogenase was about 100 times less for FDG-6-P than for glucose-6-phosphate (5). Nevertheless, the question is whether it is justified to neglect metabolites other than FDG-6-P in modeling FDG PET data, especially for the liver.
In contrast to DG and FDG, 3-O-11C-methylglucose (MG) is not thought to be phosphorylated at all (3,23). Therefore, kinetic modeling reflects only the transport from blood into the cells and backward (K1–k2 model) (24). However, in a perfused rat heart model, formation of 11C-MG-6-phosphate (MG-6-P) was described (25). In modeling MG kinetics in the perfused rat liver, a small unidentified intracellular process had to be incorporated (26).
Thus, there are many unsolved questions concerning the metabolic pathways of FDG and MG. However, knowledge of the metabolic pathways is of critical importance for the interpretation of kinetic PET studies. The purpose of this study was to determine the metabolic pathways of FDG and MG in liver tissue in vivo. The study was performed in anesthetized pigs that were given the 2 tracers intravenously, and the metabolite formation was determined in successive liver tissue biopsies.
MATERIALS AND METHODS
Animals
The Danish National Ethics Committee for animal research approved the study procedures. Six pigs of (Hampshire × Yorkshire × Duroc × Danish Landrace crossbred) (Animal Facility, Aarhus University Hospitals, Aarhus, Denmark) were used; they were 3 mo old, with body weights of 38–42 kg. The pigs were deprived of food 24 h before experiments but had free access to water.
The animals were anesthetized as described (12). In short, the animals were given intravenous infusions of midazolam (0.017 mg/min/kg) and ketamine (0.16 mg/min/kg) in isotonic saline. The animals were ventilated with air containing 40% oxygen using a respirator (Servo Ventilator 900, Pneumatic unit 901 AE; Elema Schönander, Solna, Sweden) adjusted so that arterial oxygen saturation was >98% and pH was 7.45. Each pig was placed on a thermostatically controlled heat blanket set to keep the body temperature at 38.5°C–39.5°C. A catheter was placed in the caval vein, through a femoral vein, for infusions. The animal was given 2 L isotonic saline within the first 2 h. To have free access to the liver, the belly of the animal was surgically opened. Blood glucose was measured 2 times in each animal; it was 4.2–6.3 mmol/L (median, 5.4 mmol/L).
Tracer Production
MG and FDG were produced at the radiochemistry facility of the PET Center, Aarhus University Hospital. 11C-MG was produced by methylation of the potassium salt of 1,2,5,6-diisopropylidene-d-glucose (diacetone-d-glucose) with 11C-methyl iodide in acetonitrile, followed by acidic cleavage of the protecting groups. Purification was achieved by flash chromatography on a combination of AG 11 A8 ion-retardation resin (Bio-Rad Laboratories, Hercules, CA) and C18 Sep-Paks (Waters-Denmark A/S, Hedehusene, Denmark) (27). The radiochemical purity was >95%, and the specific radioactivity was approximately 37 GBq/μmol.
FDG was synthesized in a commercially available synthetic device (FDG Microlab; GEMS, Uppsala, Sweden) based on the solid-phase–supported 18F-fluoro–triflate exchange, acidic hydrolysis of the protecting groups, and flash chromatography on a combination of C18 and Alumina N Sep-Paks (28). The radiochemical purity was >95%, and the specific radioactivity was approximately 74 GBq/μmol.
Experimental Design
MG (800 MBq) was given intravenously; liver biopsies for determination of metabolite content were taken in each animal after 30, 60, 75, and 90 min. Two hours after the MG injection, FDG (400 MBq) was given intravenously; biopsies were taken in each animal after 5, 20, 45, 90, 120, 150, and 180 min.
Liver Biopsy
The liver tissue biopsy was taken, using the through-cut technique (Cutting biopsy needle; Worldwide Medical Technologies, Woodbury, CT), through the hole in the abdominal wall. The liver tissue sample (approximately 20 mg) was transferred immediately into an aluminum tong, which was precooled in liquid nitrogen. The tong was clamped and placed in liquid nitrogen. The slice thickness was <0.5 mm, and the time between the removal of the tissue and the cooling in liquid nitrogen was <2 s. For the MG metabolite measurements, 2 × 20 mg of tissue were used; for FDG, 20 mg were used. The deep frozen sample was transferred into a 2-mL V-shaped plastic vial containing 0.25 mL acetonitrile and 0.25 mL potassium phosphate buffer (20 mmol/L), pH 6.9, cooled to −5°C to −10°C. The sample was homogenized using a tapered Teflon pestle (custom-made by the Central Workshop, Aarhus University Hospital, Aarhus, Denmark), connected to a commercial electrical drilling machine, for 30 s at −5°C to −10°C. After homogenization, the sample was centrifuged (IEC Micromaxcentrifuge; Metric A/S, Taastrup, Denmark) in 5 min at 13,000 rpm to precipitate the proteins. The supernatant was transferred in a plastic tube, and the acetonitrile was evaporated at 20 mm Hg. Finally, the solution was centrifuged again for 2 min at 13,000 rpm, and the supernatant was analyzed by radio–high-performance liquid chromatography (radio-HPLC).
Blood Samples
In the last 4 experiments, 2 blood arterial samples were taken during the FDG period. Proteins were precipitated by the above-mentioned acetonitrile solution, and the extract was subjected to radio-HPLC analysis.
Radio-HPLC
Radio-HPLC of the liver tissue and blood extracts was performed on a Perkin-Elmer isocratic LC pump 250 equipped with a Rheodyne 7125 injector (Perkin-Elmer Denmark A/S, Allerød, Denmark) and 1-mL stainless steel injection loop, connected in series with a Sphereclone 5-μm SAX 250 × 4.6 mm anion-exchange column (Phenomenex, Torrance, CA), a Perkin-Elmer LC 295 UV/Vis detector, and a sodium iodide scintillation detector of in-house design. The samples were analyzed by the radioactivity channel with the mobile phase potassium phosphate buffer (20 mmol/L), pH 6.9, and a flow rate of 0.8 mL/min. The chromatograms were analyzed using commercially available chromatography software (Perkin-Elmer Turbochrom 4.1).
Radio-HPLC identification of the HPLC findings was done by analysis of products from in vitro enzymatic reactions (21). FDG-6-P and 2-18F-fluoro-2-deoxy-6-phosphogluconate (FD-6-PG1) were identified. 2-18F-Fluoro-2-deoxy-6-phospho-d-gluconolactone (FD-6-PGL), an intermediate in the metabolic conversion of FDG-6-P to FD-6-PG1, was not seen. Gluconolactones are unstable compounds, and hydrolysis occurs spontaneously with a half-life of 90 s at pH values of >6.0 (29,30). Thus, FD-6-PGL may be converted to FD-6-PG1 during the tissue sample extraction, and the measured fraction of FD-6-PG1 also included FD-6-PGL.
For MG, no enzymatic phosphorylation was found in vitro.
RESULTS
Efficiency of Preparation of Liver Tissue Samples and Radio-HPLC Analysis
For both radiotracers, 95%–98% of radioactivity in the liver tissue samples was found in the tissue extracts. Recovery of injected radioactivity from the HPLC column was 85%–110% compared with that of the aliquot. The main source of error is the volume determination for aliquot samples.
MG Liver Tissue Samples
After the MG injection, only MG was detectable in the liver tissue. Figure 1 gives an example of the radio-HPLC measurements after MG injection. As in HPLC fractions collected in 1-min intervals, radioactivity corresponding to only MG was detected. Even 90 min after the injection, neither MG-6-P nor any other metabolites trapped in liver cells were detected in the liver tissue samples from any of the 6 pigs (total, 24 biopsies).

Typical radio-HPLC results for analysis of MG in pig liver tissue extracts.
On the basis of a mean pig liver weight of 900 g and a biopsy weight of approximately 40 mg, the fraction of the total injected 11C present in liver 60 min after injection was estimated to 0.4%. This estimation is based on the recovered radioactivity after tissue work-up and HPLC fractionation.
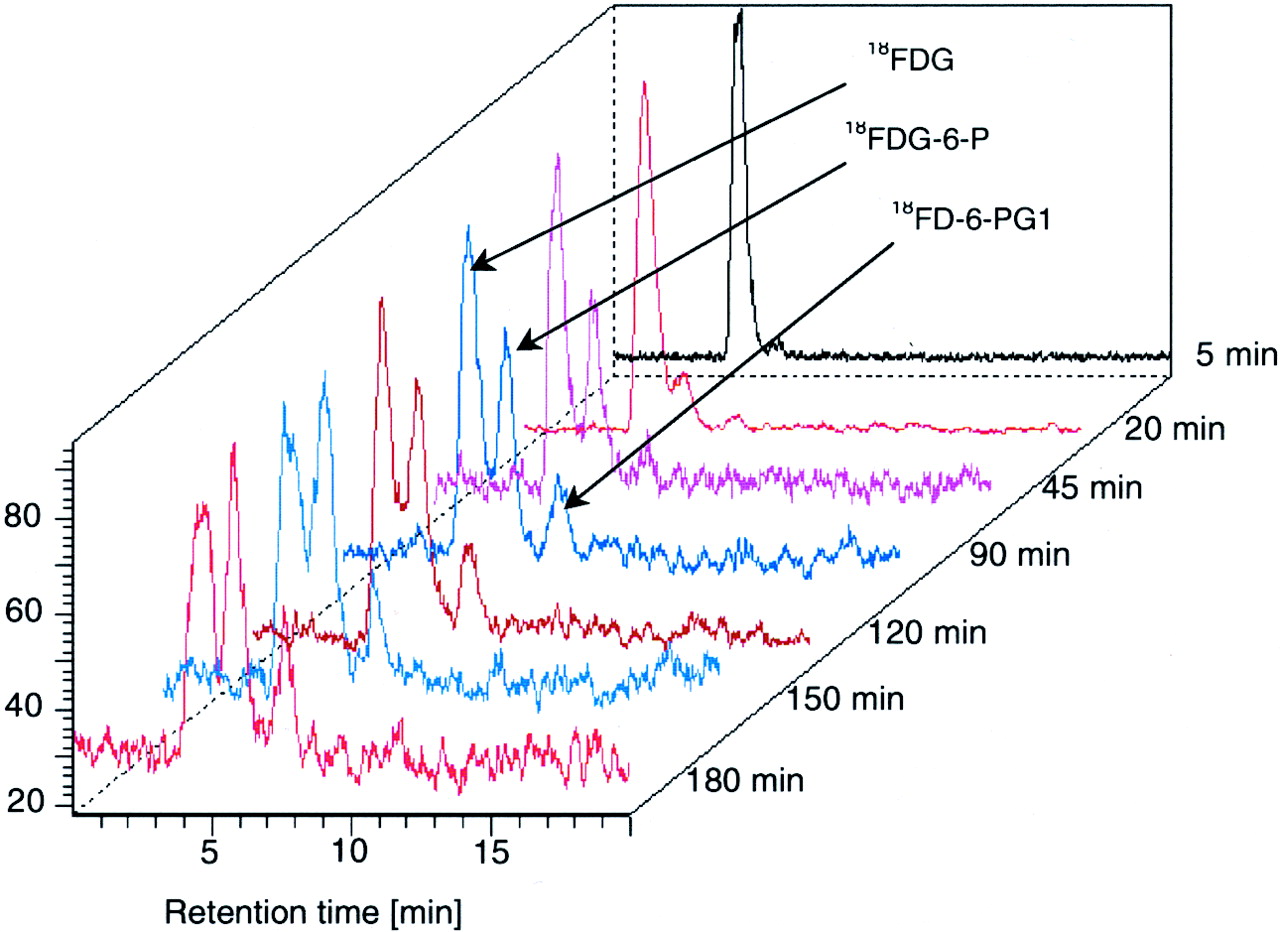
FDG Liver Tissue Samples
Figure 2 gives an example of the radio-HPLC measurements after FDG injection. The time course of the tissue content of FDG, FDG-6-P, and FD-6-PG1 is illustrated in Figure 3. The tissue content of FDG increased rapidly, and after 5 min only FDG was identified (>98% in each pig). After 180 min, approximately 40% of the radioactivity was attributed to FDG. After 20 min, FDG-6-P was found in each pig, and its concentration increased throughout the measurement period of 180 min, with a somewhat slower rise at late time points. Besides FDG-6-P, we identified a further metabolite, FD-6-PG1, which began to appear in the liver tissue after 45 min and increased throughout the 180-min experiment, with the increase somewhat slower than that of FDG-6-P. After 180 min, approximately 40% of the metabolites was attributed to FD-6-PG1. The FD-6-PG1 fraction included FD-6-PGL converted to FD-6-PG1 during the biopsy sampling and the extraction of the tissue sample for the HPLC analysis. The content of other metabolites was <2%, even after 180 min. There was no significant accumulation of radioactivity in the sample precipitates within the experimental period. No phosphorylated metabolites were found in the blood samples.

Typical radio-HPLC results for determination of FDG, FDG-6-P, and FD-6-PG1, the latter including FD-6-PGL in pig liver tissue extracts.

Time course of tissue content of FDG, FDG-6-P, and FD-6-PG1 (+FD-6-PGL) in pig liver biopsy samples determined by radio-HPLC. Data are expressed as mean ± SD (n = 6 animals).
On the basis of a mean pig liver weight of 900 g and a biopsy weight of approximately 20 mg, the fraction of the total injected 18F present in liver was estimated to be 3.5% ± 1.1% (5 min), 2.2% ± 0.4% (20 min), and 1.6% ± 0.2% (45–180 min) after injection of FDG. This estimation is based on the recovered radioactivity after tissue work-up and HPLC fractionation.
DISCUSSION
The main result of this study is the significant formation FD-6-PG1 besides FDG-6-P in the liver after FDG injection into anesthetized pigs. This shows that FDG-6-P is a substrate for glucose 6-phosphate dehydrogenase in the liver. FD-6-PG1 is the hydrolysis product of FD-6-PGL, which is the nicotinamide-adenine dinucleotide phosphate–catalyzed oxidation product of FDG-6-P. This oxidation is reversible (31), whereas the hydrolysis is irreversible. Figure 4 summarizes the metabolic structures and sequence for the formation of FDG-6-P, FD-6-PGL, and FD-6-PG1. The hydrolysis of gluconolactones is catalyzed by gluconolactonases and probably also by spontaneous hydrolysis. Therefore, the measured values of FD-6-PG1 probably include some fraction of FD-6-PGL.

Metabolic structures and sequence for formation of FDG-6-P, FD-6-PGL, and FD-6-PG1.
The increment of the fractions of FDG-6-P and FD-6-PG1 (+FD-6-PGL) diminished with time, which is in agreement with the kinetic modeling findings that glucose-6-phosphatase (k4) is of significance for the FDG metabolic pathway in the liver (12–14) and that the oxidation of FDG-6-P to FD-6-PG1 is reversible, respectively.
Incorporation of FDG into glycogen (7–10) was of no significance in these experiments. Only approximately 3% of the liver tissue radioactivity was not in the form of FDG, FDG-6-P, or FD-6-PG1 (+FD-6-PGL). The incorporation of FDG into glycogen involves the formation of FDG-1-P and uridine diphosphate–FDG, and it is possible that some of the observed unidentified metabolites are associated with 1 or another of these compounds. The pigs were fasting, as is the case in most human (14,15) and animal FDG PET studies (12). However, feeding stimulated the FDG uptake in rat liver (14) and influenced the DG metabolism in rat brain (2). It might be that FDG is converted into glycogen in fed animals. The findings of several glycogen precursor metabolites in the NMR measurements of rat brains after administration of 19F-FDG (16–19) might be associated with the high dose of unlabeled FDG (up to 400 mg/kg), resulting in hyperglycemia.
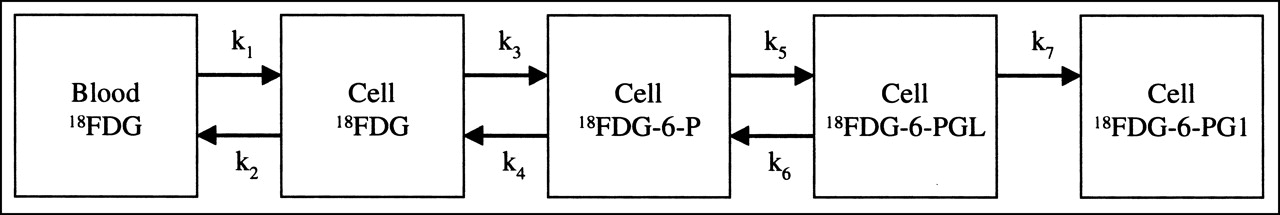
Kinetic models for the liver metabolism of FDG usually include only 4 steps: labeled K1–k4 (12–14). These rate constants reflect transport into and out of the cells and the phosphorylation and dephosphorylation. Our results show that the liver metabolism of FDG is more complex. A more correct model from a biochemical point of view would require additional rate constants, k5–k7, as illustrated in Figure 5. The additional rate constants k5 and k6 reflect the reversible oxidation of FDG-6-P, and k7 reflects the irreversible hydrolysis of FD-6-PGL to FD-6-PG1. Compared with kinetic modeling of dynamic FDG PET data, our measurements give a more direct insight into the metabolic pathways. Nevertheless, the simple K1–k4 model may still apply to FDG PET liver studies. In short-term studies of 60–90 min, for example, the metabolite fractions of FD-6-PGL and FD-6-PG1 are small and may be ignored for kinetic analysis (Fig. 3). For longer studies, the interpretation of the rate constants must acknowledge the new more detailed knowledge of the biochemical paths. The calculated rate constant for the dephosphorylation of FDG-6-P (k4) will be somewhat underestimated because a fraction of metabolites is not FDG-6-P.

Proposed K1–k7 model for liver metabolism of FDG.
The data allow an estimation of the rate constants for the oxidation (k5) and reduction (k6) of the intermediate FD-6-PGL, based on a 2-compartment model. The value of k5 was estimated to be 0.02 min−1 and k6 to be 0.04 min−1. However, these estimations are based on only 6 time points and, therefore, reflect only the magnitude of these rates.
For MG, we could not confirm either the formation of MG-6-P as described for the rat heart (25) or the formation of any other phosphorylated metabolites in the liver. This observation is in agreement with dynamic MG liver PET data in anesthetized pigs, which were adequately described by a K1–k2 model (12).
The determined fractions of the total 18F and 11C present in liver are, in both cases, underestimated and insecure. The reason for this underestimation is unavoidable losses of the acetonitrile or buffer during liver tissue homogenization. Within the applied mechanical procedure, spilling and absorption losses are unavoidable. Another important factor affecting the accuracy is the spread of weight for the liver tissue samples.
CONCLUSION
The main result of this study is the significant formation FD-6-PG1 besides FDG-6-P in the liver after FDG injection into anesthetized pigs. The formation of FD-6-PG1 from FDG-6-P involves a reversible oxidation to FDG-6-PGL, followed by irreversible hydrolysis. Any possible incorporation of FDG into glycogen was of minor importance compared with enzymatic oxidation of FDG-6-P within the pentose phosphate pathway. Glucose-6-phosphatase is of significance for the FDG metabolism in the liver. MG entered the liver cells, but it was not metabolized in the pig liver.
Footnotes
Received Oct. 11, 2000; revision accepted Feb. 20, 2001.
For correspondence or reprints contact: Dirk Bender, PhD, PET Center, Aarhus University Hospital, DK 8000 Aarhus, Denmark.
REFERENCES
In this issue


Jump to section
Related Articles
Cited By...
- Methodologic Considerations for Quantitative 18F-FDG PET/CT Studies of Hepatic Glucose Metabolism in Healthy Subjects
- Bringing Physiology into PET of the Liver
- Hepatic Blood Perfusion Measured by 3-Minute Dynamic 18F-FDG PET in Pigs
- Insulin Stimulates Liver Glucose Uptake in Humans: An 18F-FDG PET Study
- Metabolic Fate of 18F-FDG in Mice Bearing Either SCCVII Squamous Cell Carcinoma or C3H Mammary Carcinoma
- FDG Metabolism: Quaecumque Sunt Vera ...