Article Text

Abstract
Objectives Screening colonoscopy to monitor for early colitis-associated colon cancer (CAC) is difficult due to the aberrant mucosal patterns associated with long-standing colitis. The aim of this study was to develop a rapid fluorescent detection method for use during colonoscopy for improving the detection of CAC utilising a topically applied enzymatically activatable probe (gGlu-HMRG) which fluoresces in the presence of γ-glutamyltranspeptidase (GGT), an enzyme associated with cancer.
Methods Expression of GGT in colon cell lines was examined with fluorescence microscopy and flow cytometry. A mouse model (azoxymethane/dextran sulphate sodium) of CAC was used and mice were examined with white light and fluorescence colonoscopy before and after topical gGlu-HMRG administration.
Results Expression of GGT, although variable, was higher in human colon cancer cells than normal human colon cells. Using fluorescence colonoscopy in mice, gGlu-HMRG fluorescent lesions were detected 5 min after topical administration and fluorescence persisted for at least 30 min. Fluorescence guided biopsy revealed all fluorescent lesions that contained cancer or dysplasia (n=16), whereas three out of 12 non-fluorescent lesions contained low grade dysplasia and others did not contain neoplastic histology. Microscopic inflammatory infiltration also had variable fluorescence but in general was much lower (∼10-fold) in signal than cancer. Repeat fluorescence endoscopy allowed individual tumours to be monitored.
Conclusion These results suggest that gGlu-HMRG can improve endoscopic detection of CAC with a higher target to background ratio than conventional white light colonoscopy. This could be of benefit to patients with long-standing colitis who must undergo repeated screening colonoscopies.
- Colitis-associated colon cancer
- fluorescence endoscopy
- optical molecular imaging
- activatable probe
- cancer
- imaging
- inflammatory bowel disease
- colorectal cancer
- liver metastases
- liver imaging
- colorectal metastases
- image analysis
- gastrointestinal endoscopy
Statistics from Altmetric.com
- Colitis-associated colon cancer
- fluorescence endoscopy
- optical molecular imaging
- activatable probe
- cancer
- imaging
- inflammatory bowel disease
- colorectal cancer
- liver metastases
- liver imaging
- colorectal metastases
- image analysis
- gastrointestinal endoscopy
Significance of this study
What is already known on this subject?
-
Long-standing colitis in inflammatory bowel disease patients has an increased risk of early onset colitis-associated colon cancer (CAC).
-
Screening colonoscopy to detect CAC or dysplasia is important to reduce mortality rates; however, protocols of detecting CAC are not optimised.
-
γ-Glutamyltranspeptidase is a cell surface enzyme of glutathione metabolism and is highly expressed in various types of human cancers.
-
Disseminated ovarian cancer was instantly visualised after spray administration of a newly synthesised hydroxylmethyl rhodamine green based enzymatically activatable fluorescent probe (gGlu-HMRG) in vivo.
What are the new findings?
-
γ-Glutamyltranspeptidase expression was higher in human colon cancer cells than in normal human colon cells.
-
gGlu-HMRG fluorescence colonoscopy depicted murine colitis-associated colon cancers developing in the microscopic inflammatory mucosa with a high cancer to background ratio.
-
By using gGlu-HMRG fluorescence-guided biopsy, all fluorescent specimens histologically contained cancer and/or low-to-high grade dysplasia.
How might it impact on clinical practice in the foreseeable future?
-
This cancer-targeted, probe (γ-glutamyl hydroxymethyl rhodamine green; gGlu-HMRG) in vivo fluorescence-guided endoscopic imaging allows us to assist the endoscopic screening of colitis-associated cancers in patients with long-standing inflammatory bowel disease by topically spraying the probe during the colonoscopic procedure because of the rapid activation of cancer-specific fluorescence and small administration doses.
Introduction
Patients with long-standing colonic inflammation due to ulcerative colitis or Crohn's disease have an increased risk of developing early onset cancers.1 ,2 Although colitis-associated colon cancer (CAC) represents only 1%–2% of colon cancer deaths, the cumulative risk of colon cancer is generally higher in ulcerative colitis patients than in normal subjects.3–6 To detect dysplasia or early stage cancer at a surgically curable stage, colonoscopic surveillance is recommended for patients with a history of at least 8–10 years of extensive colitis or 12–15 years of left-sided colitis.7 Detection of early tumours in a background of chronic colitis can be difficult and, therefore, guidelines recommend that two to four non-targeted biopsies be obtained for every 10 cm of colon and rectum evaluated.8 Despite this practice, the diagnosis of CAC is often (17%–28%) delayed or missed largely because CACs are often multiple, nearly flat and broadly infiltrating and may be difficult to distinguish from background inflammation.9 Moreover, missed cancers are often histologically anaplastic and biologically aggressive leading to higher mortality rates than the general population. Therefore, methods are being sought to modify the surveillance protocol to improve its sensitivity for identifying dysplasia and/or cancer. Newer endoscopy techniques such as methylene blue or indigo-carmine chromoendoscopy,10 ,11 narrow-band imaging,12 autofluorescence imaging13 and endomicroscopy14 have been proposed. These techniques are valid, however, but have had variable results for detecting CAC due to the required skill and time for examination.
γ-Glutamyltranspeptidase (GGT) is a cell surface enzyme of glutathione metabolism and is highly expressed in various types of human cancers.15 We have developed an enzymatically activatable fluorescent probe, (gGlu-HMRG) in vivo, based on the fluorophore rhodamine green that becomes fluorescent after cleavage of a GGT-specific sequence. In contrast to several target-activatable optical imaging methods, such as cathepsins,16 matrix metalloproteinases,17 EGF receptors and lectins,18 ,19 requiring to inject intravenously and to wait hours to days to visualise effectively, gGlu-HMRG can be activated target specifically by a topical application in seconds to minutes.20 In addition, unlike other activatable probes, this probe did not show any detectable fluorescence in basal state based on spirocyclic caging.
Here, we apply this method for the detection of CAC in a murine model using topical administration of gGlu-HMRG followed by fluorescence endoscopy, and determine the feasibility of this method as a screening fluorescence colonoscopy.
Materials and methods
Enzymatic-activatable fluorescent probe
gGlu-HMRG was synthesised as previously described.21 In brief, HMRG 11.6 mg (0.036 mmol 1eq.), 2-(1H-7-azabenzotriazol-1-yl)-1,1,3,3-tetramethyl uronium hexafluorophosphate methanaminium 27.8 mg (0.072 mmol 2eq.) and N,N-diisopropylethylamine 12.9 μl (0.072 mmol 2eq.) were dissolved in N,N-dimethylformamide (DMF) 2 ml and stirred at 0°C under an Ar atmosphere for 10 min. Then Boc-Glu-OtBu 13.9 mg (0.05 mmol 1eq.) in DMF 0.5 ml was added dropwise into the solution and stirred at 0°C to room temperature overnight. After evaporation of the solvent, the residue was dissolved in dichloromethane (CH2Cl2) 2 ml and trifluoroacetic acid 2 ml. The reaction mixture was stirred at room temperature for 1 h. After evaporation of the solvent, the residue was purified by semipreparative HPLC using eluent A (H2O 0.1% trifluoroacetic acid) and eluent B (CH3CN 80%, H2O 20%) (A/B = 80/20 to 0/100, 40 min) to yield gGlu-HMRG which appears as an orange powder (3.2 mg, 19%).
Cell culture
Human colon cancer cell lines, HT-29, LS174T and HCT116, and a normal colon epithelial cell line, CCD 841 CoN, were obtained from the American Type Culture Collection (ATCC, Rockville, Maryland, USA). MC38 is a metastatic murine colon cancer cell line syngeneic to the C57BL6 strain of mice.22 Cells were grown in RPMI 1640 supplemented with 10% fetal bovine serum and 1% penicillin/streptomycin in culture flasks in a humidified incubator at 37°C at an atmosphere of 95% air and 5% carbon dioxide.
Fluorescence microscopy
Cells (1×10⁴) were seeded on a cover glass-bottomed culture well and incubated for 24–48 h to attach to the bottom. Then, once the cells were washed with phosphate buffered saline (PBS), 1 μM of gGlu-HMRG was added and incubated in the dark for 30 min at 37°C. Cells were washed again with PBS, and fluorescence microscopy was performed using an Olympus BX51 microscope (Olympus America, Inc., Melville, New York, USA) equipped with the following filters: excitation wavelength, 450–490 nm; emission wavelength, 500–550 nm. Transmitted light differential interference contrast images were also acquired.
Measuring GGT activity in vitro
Cells were trypsinised, harvested and resuspended in PBS. Cells (1×10⁶) were incubated in the dark with 1 μM of gGlu-HMRG for 5 or 30 min at 37°C. Then, cells were washed twice with PBS and analysed on flow cytometry (FACS Calibur, BD BioSciences, San Jose, California, USA). Relative mean fluorescence intensity (MFI) was quantified as the ratio MFItarget to MFIcontrol using CellQuest software (BD BioSciences). Samples were assayed three times in duplicate; the expression levels were expressed as the mean±SEM, and compared with the normal colon epithelial cell line, CCD 841 CoN.
To show specificity of gGlu-HMRG binding to the GGT, the gene was knocked down by targeting with siRNA (Silencer Select siRNA from Applied Biosystems, Carlsbad, California, USA). Further, 5×10⁵ HT29 cells seeded in six well dishes were transfected with 25 nM control siRNA (sense: UAACGACGCGACGACGUAATT, antisense: UUACGUCGUCGCGUCGUUATT) or GGT-1 targeted (sense: CCAAGGAACCUGACAACCAtt, antisense: UGGUUGUCAGGUUCCUUGGag) siRNA using DharmaFECT-1 (Dharmicon, Lafayette, Colorado, USA) according to the manufacturer's recommendations. Then, 48 h after transfection, the gGlu-HMRG probe (8 nM) was added to serially diluted cell suspension and GGT activity was measured over time with a FLUOstar OPTIMA—Fluorescence Microplate Reader (BMG Labtech, Offenburg, Germany) with excitation at 485 nm and emission detection at 520 nm.
CAC model
All procedures were conducted in compliance with the Guide for the Care and Use of Laboratory Animal Resources (1996), US National Research Council, and approved by the local Animal Care and Use Committee (US NCI/NIH). Pathogen-free FVB/N mice were purchased from the NCI-Frederick Animal Production Area at 5 weeks of age and were exposed to a 12:12-h light/dark cycle. Mice were given an AIN-96G purified diet from Harlan Teklad (Madison, Wisconsin, USA) and drinking water ad libitum. At 6 weeks of age, mice were injected intraperitoneally with azoxymethane (AOM; Sigma, St. Louis, Missouri, USA) at a dose of 10 mg/kg body weight in 0.1 ml of saline. One week later, mice received 2% dextran sulphate sodium (DSS) of an average molecular weight 36 000 to 50 000 (MP Biomedicals LL, Solon, Ohio, USA) in the drinking water (reverse osmosis-purified water) for 5 days. After DSS treatment, mice received normal drinking water.23
Fluorescence colonoscopy
Sixty days after DSS treatment, mice were fasted for at least 6 h and received a preparation of 2 ml of PBS via enema prior to colonoscopy. During the experiment, mice were anaesthetised with isoflurane. A model BF XP-60 bronchoscope (Olympus Co., Tokyo, Japan), 2.8 mm in diameter with a single biopsy channel, was introduced intrarectally into mice with gentle insufflation of carbon dioxide gas by an experienced gastroenterologist (MM). Colonic mucosa was observed at least to the splenic flexure using a clinical endoscopic system (CLV-180, Olympus Co.) modified to allow switching back and forth between white light imaging and fluorescence imaging (blue excitation from 465 to 500 nm). Endoscopic images were obtained via a dichroic splitter, where the excitation light images were displayed using the image processor software (OTV-S7, Olympus Co.) and the fluorescence images were filtered by an emission filter (516–556 nm band-pass) prior to detection with a sensitive electron-multiplying charge coupled device (CCD) camera (Texas Instruments, Dallas, Texas, USA). Both images were displayed side by side on the PC monitor with DualView 2 software (RGB Spectrum, Alameda, California, USA). Real-time images of both white light and fluorescence images were recorded on a hard disk video recorder.24–26
After conventional colonoscopy, mice received 300 μl of intrarectal gGlu-HMRG (50 μM), which was enough to immerse distal side of mouse colon. Three minutes after gGlu-HMRG administration, mice received 1 ml of PBS enema, which was repeated, and colonoscopy was performed again. In order to determine fluorescence target to background ratio (TBR), distance between each region of interest (ROI) and the endoscope head was maintained at 3.0 mm using the biopsy forceps as a measurement standard (FB-56D-1, Olympus Co.). Snap shot images were used for calculating fluorescence intensities. All fluorescence images were analysed with Image J software (National Institutes of Health, Rockville, Maryland, USA) (http://rsbweb.nih.gov/ij/). Circular ROIs were placed in the tumour (St) and in adjacent normal mucosa (Sn). Each ROI intensity was recorded in ‘pixel intensity values’ between 0 and 255. After obtaining mean signal intensities, the TBR was determined as St/Sn.
For monitoring tumour progression, fluorescence colonoscopy was performed every 30 days starting from 60 days after DSS treatment.
Fluorescence assisted biopsy in vivo
To validate CAC, tissue biopsies were performed. Thirty minutes after gGlu-HMRG injection, tissue specimens were obtained from fluorescent and arbitrary non-fluorescent lesions with biopsy forceps under fluorescence colonoscopy. The size of the tumour was measured with a tip of the biopsy forceps (1 mm). Mice were euthanised with an overdose of carbon dioxide after the biopsies due to the possibility of inadvertent colonic perforation.
Histological analysis
Biopsy specimens were fixed for at least 24 h with 10% neutral buffered formaldehyde. Paraffin-embedded sections were stained with H&E for a histopathological evaluation. Each sample was examined by an experienced pathologist (HK) in a blinded manner, and dysplasia and neoplasia were diagnosed using standard published criteria.27–29
Immunohistochemistry
Immunohistochemistry for human tissue microarray was performed to examine GGT expression in various types of colon disease. Colonic tissue microarray slide was obtained from US Biomax Inc. (Rockville, Maryland, USA), containing 20 cases of colon adenocarcinoma, 20 cases of metastatic carcinoma from colon, five cases of adenoma, five cases of colon polyp, four cases of Crohn's disease, one case of tuberculosis, five cases of chronic inflammation, 10 cases of cancer adjacent normal colon and 10 cases of normal colon, with clinical stage and pathology grade information (BC05002). Slides were deparaffinised in xylene and sequentially washed in 100%, 95%, 75% and 50% of ethanol and washed in PBS. After heat-induced antigen retrieval (Citrate pH 6), the array was preincubated in 1% H2O2 followed by incubation in blocking solution (normal goat serum) for 2 h. The array was then incubated in primary antibody GGT1 (Abcam 109427, Cambridge, Massachusetts, USA) at 4°C overnight at a dilution of 1:1000, followed by a biotin-conjugated secondary anti-rabbit antibody (Vector-BA1000, Vector labs, Burlingame, California, USA) with a dilution of 1:200 to amplify the signal resulting in greater sensitivity. Array slide was then incubated with an ABC reagent (Vectorstain ABC kit-PK-4000, Vector labs) for 30 min. Development of the chromogen reaction with diaminobenzidine (Sigma #D4418; St. Louis, Missouri, USA) proceeds for 3 min and stained and differentiate array slide in haematoxylin. Images of IHC staining were scanned with Aperio Imagscope (Vista, California, USA) and signal intensity was scored as negative (−), poorly positive (±), positive (+) or strongly positive (++).
Statistical analysis
Statistical analyses were carried out using a statistics programme (GraphPad Instat; GraphPad Software, La Jolla, California, USA). Mann–Whitney test was used to compare relative MFI values of cancer cells with that of control cells. A one-way analysis of variance with post test (Kruskal–Wallis test with post test) was used to compare TBR. A p value <0.05 was considered to indicate a statistically significant difference.
Results
Elevated GGT expression in colon cancer cells
To determine the expression of GGT in colon cancer cells, we first examined gGlu-HMRG fluorescence in five types of cell lines (three human colon cancer cells, one murine colon cancer cells and one cell line consisting of normal human colon epithelium). As there was no established CAC cell line available, we used colon adenocarcinoma cell lines instead, although the diastase process was completely different. Using fluorescence microscopy, gGlu-HMRG fluorescence was detected in the cytosol, predominantly lysosome, of these cells to a variable degree (figure 1A). Activation of gGlu-HMRG fluorescence was detected as early as 5 min and the signal continued to increase to 30 min (figure 1B). Although GGT expression was detected in normal colon cell line, CCD 841 CoN, it was at least 10 times lower than cancer cells (figure 1C). mRNA knock down was confirmed by quantitative RT-PCR, showing a 3.3±0.13 decrease in GGT-1 mRNA expression in the si GGT-1 treated HCT116 cells compared with the si control. In addition, silencing of the GGT-1 gene induced a greater than 80% decrease in fluorescence in HT29 cells (figure 1D) as well as in protein expression (figure 1E), suggesting that GGT-1 is responsible for the activation and accumulation of gGlu-HMRG probe.

Detection of γ-glutamyltranspeptidase (GGT) expression of colon cell lines by gGlu-HMRG. (A) gGlu-HMRG fluorescence was detected by fluorescence microscopy (n=3). Differential interference contrast images (left column), gGlu-HMRG fluorescence images (right column), scale bar, 10 μm. (B) Flow cytometric analysis of GGT expression. One representative individual is shown. (C) Relative mean fluorescence intensity (MFI) was quantified as absolute MFItarget/MFIcontrol. Colon cancer LS174T, HT29, HCT116 and MC38 cells had significantly higher GGT expression as compared with normal colon CCD 841 CoN cells 5 and 30 min after gGlu-HMRG was added (p<0.01; n=3, Mann–Whitney test). (D) GGT-1 mRNA knockdown by siRNA transfection in HT29 cells shows decreasing GGT activity over time, resulting in low fluorescence signal. (E) Decreasing GGT-1 expression by GGT-1 mRNA knockdown.
Detection of CAC with fluorescence endoscopy in vivo
To test the feasibility of fluorescence endoscopic detection of CAC, colonoscopy was performed 60 days after DSS treatment (n=15 mice, including 10 tumour bearing mice). Due to the thickness of the endoscope, the tip of the endoscope could only reach safely up to the splenic flexture of the mouse colon which represents the distal half of the mouse colon. The CCD camera was tuned once to optimise imaging conditions but remained constant thereafter to avoid detecting the normal mucosa. Faecal material was removed by extensive washing with PBS enema. White light colonoscopy revealed that the size of the tumours ranged from tiny and flat lesions to elevated polypoid tumours covering most of the colonic lumen (figure 2A). In addition, no severe acute active inflammation was found in the observed area. When switching to fluorescence colonoscopy, there was no detectable fluorescence (except for autofluorescence) from the colonic mucosa. As there was no specific fluorescence detected in mice without AOM/DSS treatment under this condition, we analysed only AOM/DSS treated mice. Next, gGlu-HMRG was administered intrarectally, retained for 3 min before being washed with PBS and fluorescence colonoscopy was performed 5 and 30 min after gGlu-HMRG administration. It was possible to detect green fluorescent lesions, even very tiny tumours (<1 mm) as early as 5 min after gGlu-HMRG administration. By switching to white light imaging, the fluorescent lesions could be localised to the surface of the colon (figure 2B and online video). gGlu-HMRG fluorescence detected all visible lesions regardless of size although enhancement was less homogeneous in larger tumours (figure 2C). At autopsy, such lesions corresponded to tumour-containing lesions in all cases. We analysed TBR in each lesion to compare fluorescence intensities. The TBR arising from fluorescent lesions was significantly higher compared with surrounding non-fluorescent lesions (figure 2D). There were subtle autofluorescence signals before gGlu-HMRG administration in relatively large tumours; however, it was not statistically different in signal compared with non-fluorescing lesions. In addition, there were no significant differences of gGlu-HMRG fluorescence in the tumours between 5 min and 30 min suggesting that peak enhancement was reached early.

Fluorescence endoscopic detection of CAC. (A) White light image of colon tumours. Diameter of the biopsy forceps is 1.0 mm for reference. The forceps was also used to maintain a 3 mm distance between the region of interest and the endoscope head when determining fluorescence target to background ratio (TBR). (B, C) gGlu-HMRG detection by fluorescence endoscopy. White light image (WL) and simultaneously acquired blue excitation light image (BL) and fluorescence image (FL) are shown at indicated times. Enhancement was uneven in the larger tumours (C) probably due to the architecture of the tumour, heterogeneous expression of γ-glutamyltranspeptidase in the tumour. (D) High TBR was observed in tumour lesions. TBR of fluorescent lesions (n=13) was calculated at indicated time points (*p<0.05; Kruskal–Wallis test with post-test). Note that no gGlu-HMRG fluorescence was found in normal (azoxymethane/dextran sulphate sodium untreated) mice.
To test the feasibility of repeated fluorescence colonoscopy, six tumour-bearing mice underwent repeated colonoscopy every 30 days starting 60 days after DSS treatment. As shown in figure 3, tumour progression could be verified on the gGlu-HMRG fluorescence image.

Successful time course observation of CAC with fluorescence colonoscopy. Colonoscopy was performed every 30 days starting after 60 days of dextran sulphate sodium (DSS) treatment in the same mouse. It was possible to observe tumour progression by repeated fluorescence colonoscopy as well as white light imaging (n=6). BL, blue excitation light image; FL, fluorescence image; WL, white light image.
gGlu-HMRG fluorescence-guided tissue biopsy with fluorescence colonoscopy
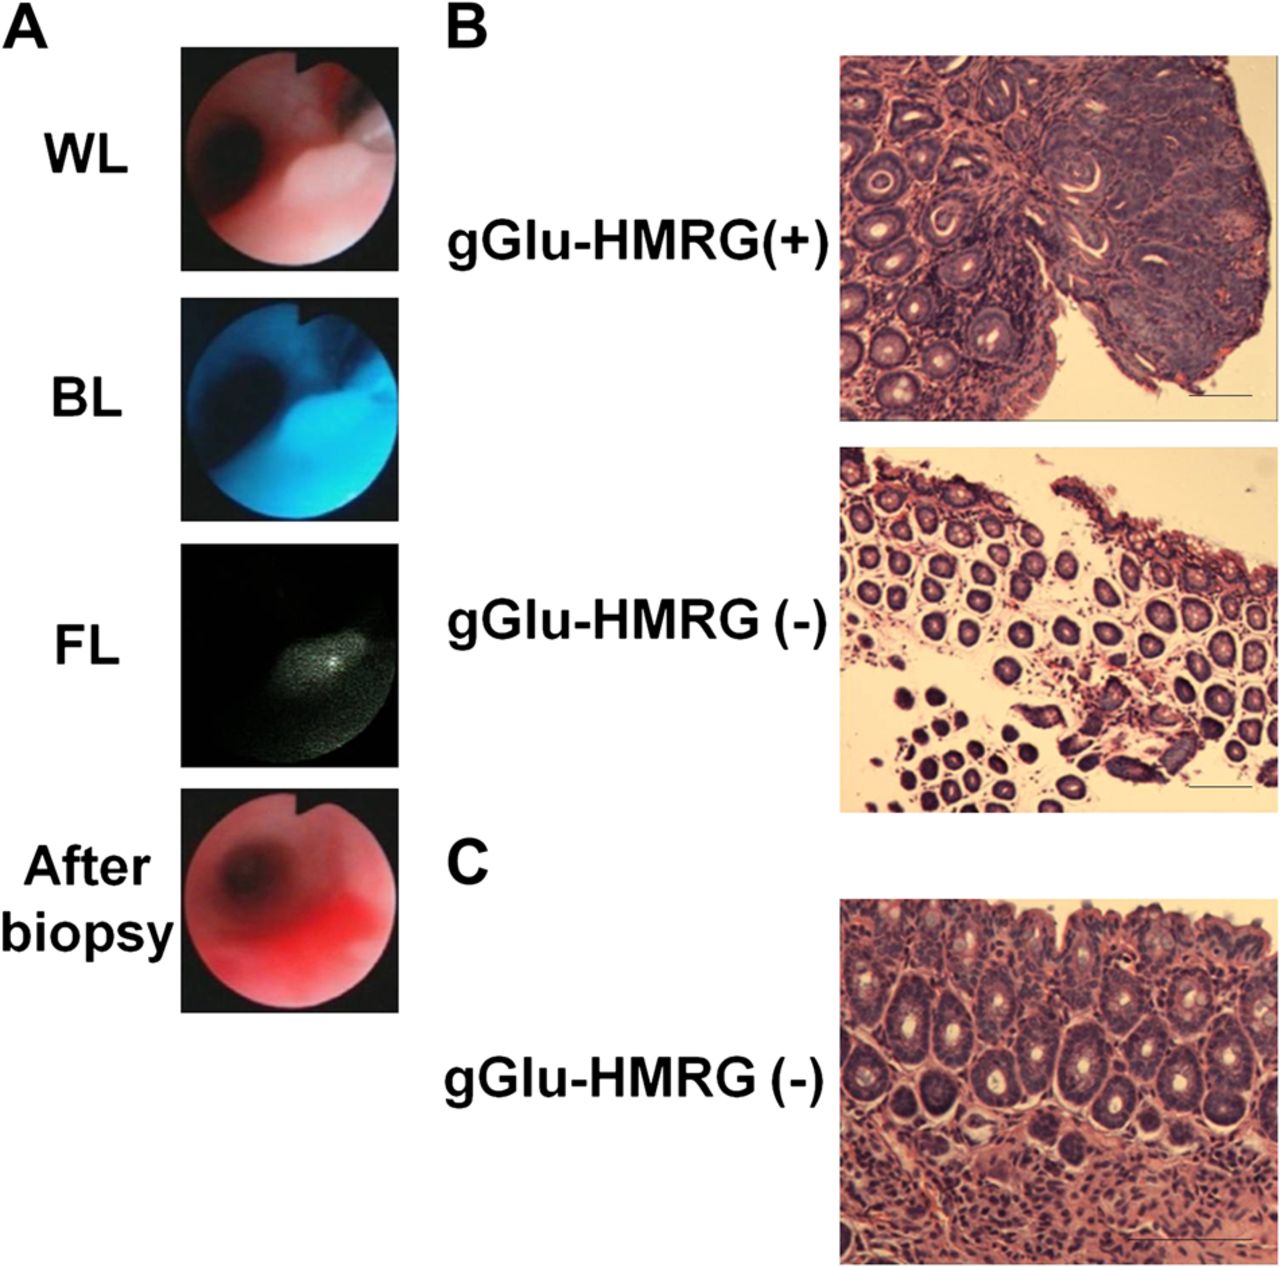
Fluorescence-guided tissue biopsies were performed to validate gGlu-HMRG fluorescence as a means of detecting CAC. In all, 28 tissue specimens (16 fluorescent lesions and 12 non-fluorescent lesions) were obtained by biopsy forceps. Under fluorescence colonoscopy, even tiny fluorescence lesions ∼1 mm could be sampled (figure 4A). By measuring fluorescence intensity values (TBR) just before the biopsy, we analysed the correlation between TBR and histology. All elevated or polypoid lesions >2 mm in size showed high TBR and contained cancer in histology. Slightly elevated lesions not greater than 2 mm in size showed moderate TBR and contained cancer or dysplasia in histology, whereas three out of 12 flat undetectable fluorescence lesions contained low grade dysplasia and the others were normal (table 1 and figure 4B). In addition, most of biopsy specimens, regardless of gGlu-HMRG fluorescence, showed infiltration of inflammatory cells in the mucosal layer, indicating chronic colitis (figure 4C). These results suggest that gGlu-HMRG fluorescence could detect CAC even in the presence of chronic inflammation and reflect histological progression to malignancy.

gGlu-HMRG fluorescence-guided tissue biopsy confirmed the presence of neoplastic lesions histologically. (A) Tissue biopsy was performed under fluorescence colonoscopy. A tiny fluorescent lesion measuring ∼1 mm was successfully sampled by biopsy forceps. (B) Examples of histology obtained by gGlu-HMRG fluorescence guided biopsy. (C) Chronic microscopic colitis did not show detectable gGlu-HMRG fluorescence. Regardless of gGlu-HMRG fluorescence, infiltration of inflammatory cells was found in the mucosal layer in this animal model. BL, blue excitation light image; FL, fluorescence image; WL, white light image.
Correlation between gGlu-HMRG fluorescence intensity and histological results obtained from fluorescence guided biopsy
GGT-1 activity in human tissue microarray samples
We next analysed GGT expression in human samples by using immunohistochemistry of tissue microarray. As shown in table 2, the majority of adenocarcinoma samples showed positive for GGT-1; in contrast, normal and chronic inflammatory colon samples showed negative or poorly positive for GGT-1 (figure 5). Polypoid, adenomatous and active inflammatory colon samples showed mixed results.
Immunohistochemical profile of GGT-1 activity in human colon tissue microarray

Immunohistochemical staining for GGT-1 in tissue microarray samples from various disease types of colon. Representative immunohistological images of (A) moderately-differentiated adenocarcinoma, (B) poorly-differentiated adenocarcinoma, (C) metastatic adenocarcinoma and (D) normal mucosa of colon. Original magnification ×20. Scale bar indicates 50 μm.
Discussion
The goal of surveillance colonoscopy in patients with long-standing colitis is to detect early stage of CAC and/or dysplasia; however, it is controversial because even with newer technologies,10–14 it can be difficult to detect dysplastic and early neoplastic disease against the background of chronic inflammation. Here, we describe a new technology based on fluorescence endoscopy and a topically administered enzymatically activatable fluorescent probe, gGlu-HMRG, which is rapidly acted upon by GGT, an enzyme found in higher levels in cancers than in inflammation. A recently reported alternative technology to this method is the tumour-specific imaging using telomerase promoter-regulated expression of fluorescent proteins, which are induced with the adenovirus-mediated gene transfection in vivo.30–33 Since high telomerase activity is closely related to the carcinogenesis, elevated telomerase expression may occur at a much greater frequency than high GGT activity in cancer. Therefore, the adenovirus method could be more broadly applicable than this GGT-activatable imaging probe. In contrast, this fluorescence endoscopic imaging technique could be readily integrated into the existing standard of care colonoscopy with a minimum of training and equipment, thus practically smoothing the way for clinical translation compared with alternative technologies.
Among the key features of this method are that gGlu-HMRG fluorescence is activated by GGT rapidly and specifically. As shown in figure 1A–C, GGT expression was higher in colon cancer cell lines than normal colon cell lines. In addition, gGlu-HMRG fluorescence was detected as early as 5 min after intrarectal administration with high TBR (figure 2B–D). Even more rapid activation (∼10 s) can be seen when gGlu-HMRG is sprayed on the surface of a tumour20 but this was not possible because the micro-endoscope for mice was too thin to allow passage of a spray catheter. Despite this, gGlu-HMRG fluorescence was readily seen in all tumours but not in normal tissues or a part of low grade dysplastic lesions. Although the condition of fluorescence colonoscopy was kept maintained in each mouse, enhancement looked uneven, especially in the larger tumours probably due to the architecture of the tumour, heterogeneous expression of GGT in the tumour or ineffective washing prior to gGlu-HMRG administration. While GGT activity is present in the plasma membrane,15 gGlu-HMRG fluorescence was detected predominantly in the cytosol and fluorescence with a high TBR that lasted at least 30 min, suggesting that after the cleavage of the GGT-specific sequence, rhodamine green, a hydrophobic fluorophore, was incorporated into the cytosol, and accumulated in the lysosome. Importantly, gGlu-HMRG fluorescence was not observed in the nucleus, reducing the risk of DNA photodamage. In contrast to systemic administration, local administration can minimise the amount of gGlu-HMRG needed, therefore, lowering the possibility of adverse events while allowing non-reacted dye to be excreted from the colon.
Clinically, CAC surveillance is recommended with increased frequency in high risk patients.8 We performed fluorescence colonoscopy every 30 days to confirm the feasibility of repeated examinations in the same animal and thus showed that CAC lesions could be monitored by fluorescence endoscopy safely (figure 3).
Fluorescence assisted biopsies were performed for histological validation. Our results showed good sensitivity and specificity for detecting cancer and high grade dysplastic lesions; however, some low grade dysplastic lesions, especially flat lesions in white light endoscopy, did not show detectable gGlu-HMRG fluorescence (figure 4 and table 1). We think this limitation should be resolved by combining other endoscopic imaging modalities and repeating fluorescence colonoscopy over time because GGT expression has been suggested to promote tumour progression.34–36 Interestingly, there was no association between infiltration of inflammatory cells and gGlu-HMRG fluorescence in vivo. Virtually all biopsies demonstrated some element of chronic inflammation as expected in the AOM/DSS CAC model. These results are encouraging because they suggest fluorescence endoscopy of neoplastic lesions can be achieved despite a background of chronic inflammation. Previous literature indicates higher GGT expression in active ulcerative colitis patients but not in quiescent patients.37 This result may indicate a limitation of gGlu-HMRG fluorescence detection of CAC during active colitis; however, current surveillance protocols do not recommend performing colonoscopy during acute episodes of inflammation.8 Immunohistochemistry of human colonic tissue microarray showed that while the majority of adenocarcinoma samples were positive for GGT-1, normal and chronic inflammatory colon samples were negative or poorly positive (table 2 and figure 5). These findings support our in vivo results that neoplastic lesions arising from chronic colitis can be detected with gGlu-HMRG fluorescence.
Although we need to test toxicity for clinical application, lower dose of probe use and method of topical application likely reduce potential toxicity concerns compared with intravenous injection. Therefore, rapid reaction of the activatable probe is best suitable for endoscopy screening for cancer.
In summary, we describe a novel fluorescence endoscopic detection method for CAC in a colitis mouse model of CAC. This method could be added to the current work flow of endoscopy surveillance procedures relatively easily, possibly increasing the yield of the procedure and decreasing the risk of missing biologically significant lesions even in this high risk population as well as in sporadic colon cancer patients.
References
Supplementary materials
Supplementary Data
This web only file has been produced by the BMJ Publishing Group from an electronic file supplied by the author(s) and has not been edited for content.
Files in this Data Supplement:
- Data Supplement 1 - Online Movie
Footnotes
-
Funding This research was supported by the Intramural Research Program of the US National Institutes of Health, National Cancer Institute, Center for Cancer Research.
-
Competing interests None.
-
Provenance and peer review Not commissioned; externally peer reviewed.