Article Text

Abstract
Background and aims: Positron emission tomography (PET) using 18F labelled 2-fluoro-2-deoxy-D-glucose (18FDG) is an established imaging tool, although the recent development of a biologically stable thymidine analogue [18F] 3′-deoxy-3-fluorothymidine (18FLT) has allowed PET to image cellular proliferation by utilising the salvage pathway of DNA synthesis. In this study, we have compared uptake of 18FLT and 18FDG with MIB-1 immunohistochemistry to evaluate the role of PET in quantifying in vivo cellular proliferation in colorectal cancer (CRC).
Patients and methods: Patients with resectable, primary, or recurrent CRC were prospectively studied. Thirteen lesions from 10 patients (five males, five females), median age 68 years (range 54–87), were evaluated. Patients underwent 18FDG and 18FLT PET scanning. Tracer uptake within lesions was quantified using standardised uptake values (SUVs). Histopathological examination and MIB-1 immunohistochemistry were performed on all lesions, and proliferation quantified by calculating a labelling index (% of MIB-1 positively stained nuclei within 1500 tumour cells).
Results: Histology confirmed adenocarcinoma in 12 of 13 lesions; the remaining lesion was reactive. All eight extrahepatic lesions were visualised using both 18FLT and 18FDG. Three of the five resected liver metastases were also avid for 18FLT and showed high proliferation, while the remaining two lesions which demonstrated no uptake of 18FLT had correspondingly very low proliferation. There was a statistically significant positive correlation (r =0.8, p<0.01) between SUVs of the tumours visualised with 18FLT and the corresponding MIB-1 labelling indices. No such correlation was demonstrated with 18FDG avid lesions (r =0.4).
Conclusions:18FLT PET correlates with cellular proliferation markers in both primary and metastatic CRC. This technique could provide a mechanism for in vivo grading of malignancy and early prediction of response to adjuvant chemotherapy.
- cellular proliferation
- colorectal cancer
- positron emission tomography
- imaging
- PET, positron emission tomography
- CT, computed tomography
- 18FDG, 18F labelled 2-fluoro-2-deoxy-d-glucose
- 18FLT, 18F labelled 3′-deoxy-3-fluorothymidine
- CRC, colorectal cancer
- TK, thymidine kinase 1
- SUV, standardised uptake value
- ROI, regions of interest
- H&E, haematoxylin and eosin
- TBS, Tris buffered saline
- LI, labelling index
Statistics from Altmetric.com
- PET, positron emission tomography
- CT, computed tomography
- 18FDG, 18F labelled 2-fluoro-2-deoxy-d-glucose
- 18FLT, 18F labelled 3′-deoxy-3-fluorothymidine
- CRC, colorectal cancer
- TK, thymidine kinase 1
- SUV, standardised uptake value
- ROI, regions of interest
- H&E, haematoxylin and eosin
- TBS, Tris buffered saline
- LI, labelling index
The success of positron emission tomography (PET) in oncological imaging is based on the knowledge that malignancy leads to an alteration in cellular biochemical reactions. Synthesis of positron emitting analogues from molecules of organic matter can demonstrate these biochemical processes, thus highlighting the presence of malignancy. 18F labelled 2-fluoro-2-deoxy-D-glucose (18FDG) is the most commonly used PET tracer and its utility relies on the increased glucose consumption of malignant cells. The combination of PET and 18FDG is an established imaging tool which has made a significant impact in colorectal cancer (CRC).1–9 Conversion of this tracer into a monophosphate (FDG-6-PO4) by the enzyme hexokinase leads to intracellular trapping, and following radioactive decay its distribution can be mapped in vivo.
The unique ability of this technique to image cellular biology in vivo has led to extensive research into the potential role of PET in the non-invasive assessment of cellular proliferation in various solid tumours.10–16
Previous methods of quantifying cell cycle activity in colorectal cancer have included incorporation of radiolabelled nucleotides and flow cytometry. While flow cytometry has shown a relationship between high S phase fractions and increased probability of recurrence and diminished survival,17–19 the more recent use of immunohistochemistry using the MIB-1 antibody (which recognises the cell cycle associated Ki-67 protein) has allowed an easier way to assess proliferation and is now more commonly used in routine clinical practice. Expression of the Ki-67 protein occurs during the G1 phase of the cell cycle, increasing during the cycle, and then rapidly declines after mitosis,20 allowing assessment of virtually all cycling cells regardless of their stage in the cell cycle.
The relationship of FDG to proliferative activity has been examined both in vitro and in vivo with varying results. Higashi and colleagues21 demonstrated in ovarian adencarcinoma cell lines that utilisation of glucose by tumour cells is not a reflection of cell proliferation but is strongly related to the number of viable tumour cells. Buck et al attempted to use FDG PET in vivo to estimate proliferative activity as a means of differentiating pancreatic cancer from chronic active pancreatitis but found no correlation between FDG uptake and cellular proliferation using MIB-1 immunostaining.22
The recent development of the biologically stable thymidine analogue[18F] 3′-deoxy-3-fluorothymidine (18FLT)23 has allowed PET to visualise a different biochemical process. This is achieved by targeting the salvage pathway of DNA synthesis, and hence the images appear more directly related to cellular proliferation. Accumulation of 18FLT in proliferating cells occurs by virtue of the enzyme thymidine kinase 1 (TK), which is closely linked to the S phase of the cell cycle. This salvage pathway enzyme fluctuates with DNA synthesis, the activity being high in proliferating and malignant cells and low or absent in quiescent cells.24 High TK levels have been shown to be an important risk factor in patients with breast cancer25 and in addition in vitro studies have demonstrated a positive correlation between FLT uptake, cell growth, and TK activity.26
The aim of this prospective study was thus to compare tumour uptake by both 18FLT and 18FDG PET and investigate their correlation with cellular proliferation using MIB-1 immunohistochemistry. To our knowledge this is the first study evaluating the role of PET in quantifying in vivo cellular proliferation in CRC.
PATIENTS AND METHODS
Patient selection
Ten patients (five males, five females), median age 68 years (range 54–87), with 13 resectable primary or recurrent colorectal cancers, were recruited at diagnosis from local surgical clinics. Demographics are given in table 1. Written informed consent was obtained following approval from the Local Research Ethics Committee and the Administration of Radioactive Substances Advisory Committee. All patients underwent whole body 18FDG scanning followed by an 18FLT scan (median intervening period 5 days (range 1–19)).
Patient characteristics, including calculated standardised uptake values and labelling indices for the respective lesions
Imaging
18FDG was prepared using a modification of the technique described by Hamacher and colleagues27 while 18FLT was prepared according to the method of Cleij and colleagues.28 Radiochemical purity was >99% and >95% for 18FDG and 18FLT, respectively. All patients were asked to fast for six hours prior to scanning, and blood glucose levels were checked using a glucometer (Glucometer Elite; Bayer Pharmaceuticals, Newbury, Berkshire, UK) prior to injection of the tracers. All patients were normoglycaemic with a mean blood glucose concentration of 5.4 mmol/l (SD 0.5) for 18FDG and 4.6 mmol/l (SD 0.8) for 18FLT. Mean time of data acquisition post injection was 57 minutes (SD 10) and 62 minutes (SD 12) for 18FDG and 18FLT, respectively. The timing of 18FLT scanning in patients with this disease was determined by previous work carried out by our group using time-activity curves.29 Mean injected activity was 371 MBq (SD 24) and 351 MBq (SD 52), respectively. All data were acquired using the Discovery LS PET/computed tomography (CT) combined scanner (GE medical systems, Milwaukee, USA). PET emission datasets were attenuation corrected utilising the CT capability of the hybrid scanner.30 Spiral CT scans were acquired using a speed of rotation and couch movement of 0.8 s and 22.5 mm per rotation, respectively, with a slice thickness of 5 mm. CT images were subsequently converted to maps of PET attenuation coefficients using a bilinear transformation. Transaxial emission images of 4.3×4.3×4.25 mm3 (matrix size 128×128×35) were reconstructed using ordered subsets expectation maximisation with two iterations and 28 subsets.
For each patient, regions of interest (ROI) were drawn over the tumour and standardised uptake values (SUVs) were obtained for both tracers. SUVs were calculated using the average tumour activity concentration (A) in kBq/ml, the patient’s body weight (W) in kg, and the injected activity (Ainj) in kBq:

The average SUV of five consecutive slices was obtained. The slices selected comprised the one with the maximum count density over each ROI and the four immediately adjacent slices.
Immunohistochemistry
Routine histological examination was performed on 4 μm thick haematoxylin and eosin (H&E) stained sections. Each specimen was sampled in a routine manner for diagnostic purposes in accordance with established Royal College of Pathology clinical guidelines. Immunohistochemistry for Ki-67 using the MIB-1 antibody was then performed on routine diagnostic blocks using 3 μm thick sections cut from paraffin blocks and dried overnight at 60°C. Sections were taken from xylene (two changes), through graded alcohols (100% and 70%) to water. Antigen retrieval was performed by pressure cooking for two minutes in a conventional 15 lb pressure cooker. Slides were then rinsed in 0.05% Tween 20 in Tris buffered saline (TBS/Tween). Endogenous peroxidase activity was blocked for 10 minutes using a commercially available peroxidase blocking solution (Dako, Ely, Cambridgeshire, UK). Primary mouse monoclonal antibody (MIB-1 (Dako) diluted 1/50 in TBS, pH 7.4) was applied for 60 minutes at room temperature.
Sections were rinsed in TBS/Tween and secondary antibody (goat antirabbit/mouse; Dako) was applied for 30 minutes. Sections were then rinsed in TBS/Tween and streptavidin-horseradish peroxidase (Dako) was applied for 30 minutes. Sections were again rinsed in TBS/Tween and diaminobenzidene used as a chromogen. A haematoxylin counter stain was applied.
Sections were dehydrated through graded alcohols (70% and 100%), cleared in xylene (two changes), and coverslipped with DPX mountant.
Examination of sections
Sections of tumour were identified on the H&E slides and the corresponding MIB-1 sections were examined independently by two experienced observers, A and B, blinded to the results of the scans.
Three MIB-1 stained sections of tumour were used for each lesion to account for tumour heterogeneity. Thirty high power fields (×40 objectile lens) were examined and 50 tumour cells were assessed per field using a graticule, making a total of 1500 cells per case. A labelling index (LI) was calculated as the percentage of positive staining nuclei out of all nuclei examined. “Positive” nuclear staining was regarded as staining of the entire nucleus. Nuclei with no staining or nucleolar staining only was regarded as negative.
Statistical analysis
Interobserver reliability was assessed using Pearson’s correlation coefficient, and linear regression analysis using the SPSS statistical package was employed to correlate uptake of both 18FLT and 18FDG with MIB-1.
RESULTS
Histopathology of all lesions (n=13, five primary, five liver metastases, and three peritoneal) confirmed adenocarcinoma in 12 of 13 cases. The remaining case was thought to be a malignant peritoneal recurrence by preoperative CT, 18FDG PET imaging, and at intraoperative evaluation but on microscopic histological examination was found to be an inflammatory lesion secondary to fat necrosis.
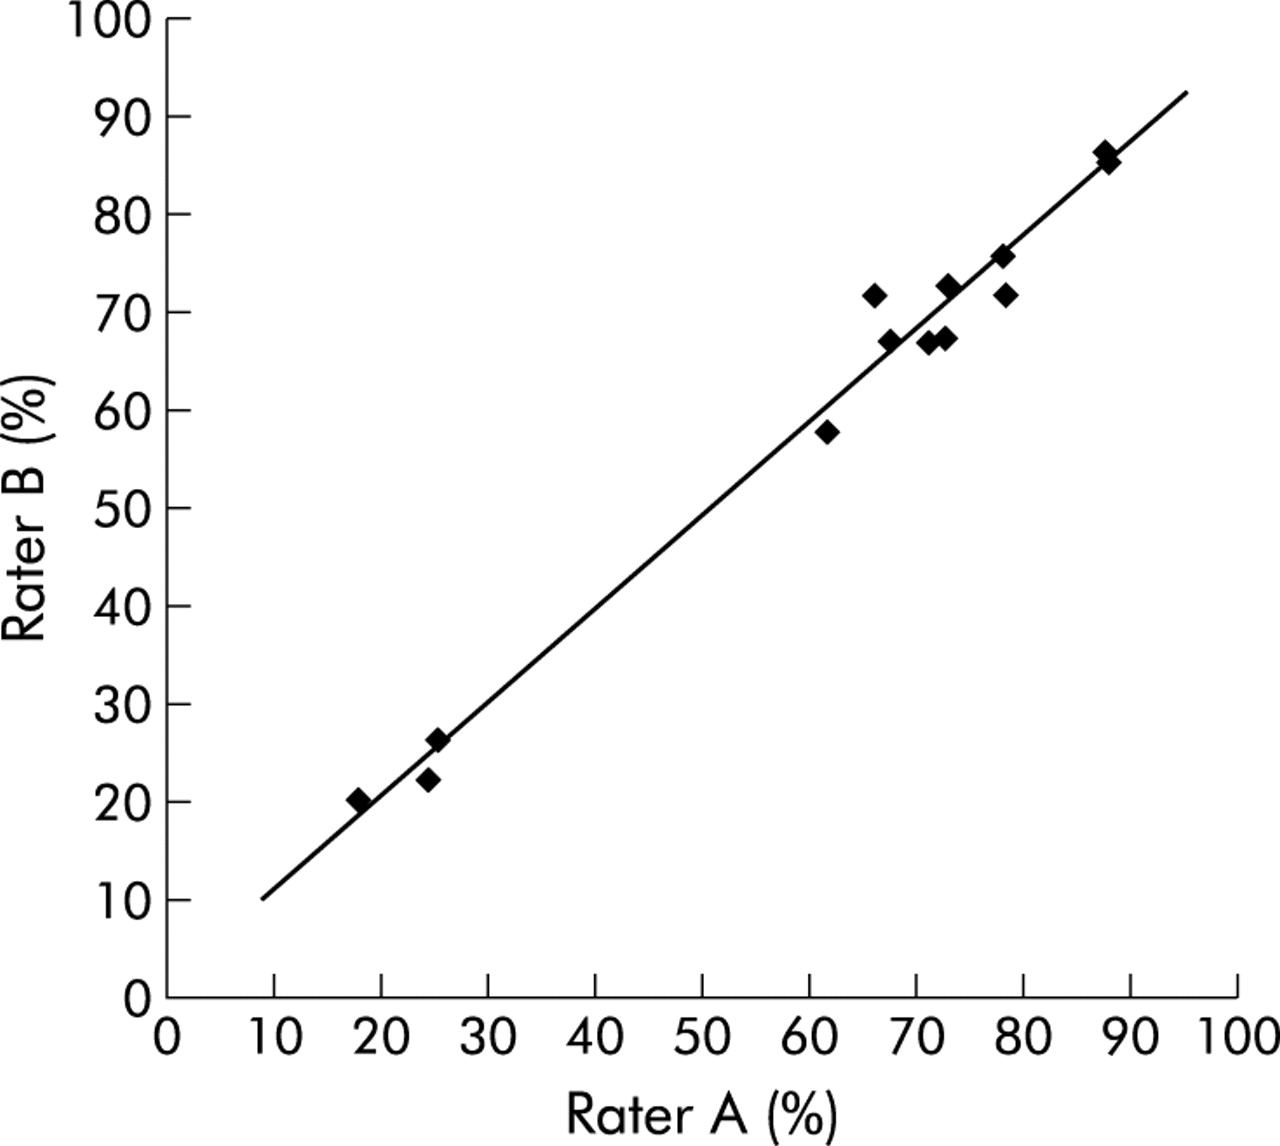
There was excellent interrater reliability between the two observers responsible for quantifying proliferation using MIB-1 immunohistochemistry (Pearson’s correlation coefficient 0.9) (fig 1).

Interrater reliability between observers A and B, with a Pearson correlation coefficient of 0.9.
Quantification of tracer uptake in addition to the corresponding LIs can be seen in table 1. All five primary tumours in addition to both malignant peritoneal lesions were visualised with increased focal uptake using both 18FLT and 18FDG. Three of five liver metastases were clearly seen to be avid for 18FLT, and all showed a corresponding high proliferation LI.
The three lesions (peritoneal inflammatory lesion and two liver metastases) which did not show increased uptake of 18FLT and were therefore not visualised using this tracer had corresponding low proliferation rates, as determined by the LIs, ranging from 19 to 26.
SUVs for those lesions seen with 18FDG ranged between 3.7 and 11 compared with a range of 1.4–9.1 for the 10 lesions visualised using 18FLT.
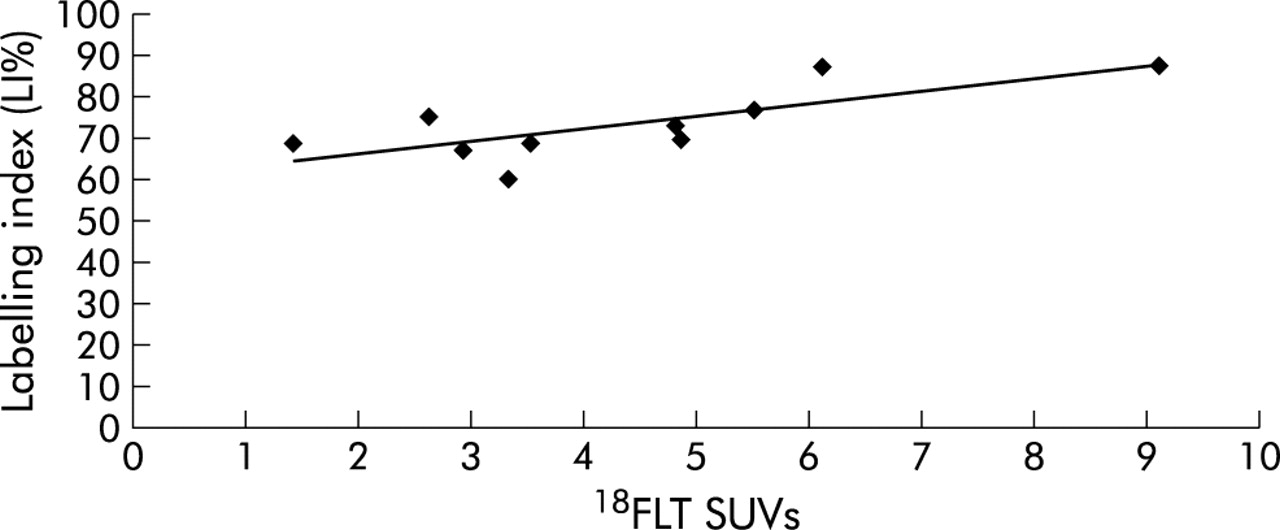
There was a statistically significant correlation (r =0.8, p<0.01) between SUVs of the 10 tumours visualised with 18FLT and the corresponding LIs (fig 2). No such correlation (r =0.4) was demonstrated in the case of 18FDG avid lesions (fig 3).

Linear regression analysis for those lesions seen with 18F labelled 3′-deoxy-3-fluorothymidine (18FLT) (n=10), correlating labelling indices (LIs) with standardised uptake values (SUVs) (r =0.8).

Linear regression analysis for those lesions seen with 18F labelled 2-fluoro-2-deoxy-d-glucose (18FDG) (n=13), correlating labelling indices (LIs) with standardised uptake values (SUVs) (r =0.4)
Differences in tracer uptake compared with macroscopic histology and MIB-1 immunohistochemistry are highlighted in fig 4.

Primary tumour of the caecum (A) and two liver metastases (B, C) with their respective positron emission tomography images, with both 18F labelled 2-fluoro-2-deoxy-d-glucose (18FDG) and 18F labelled 3′-deoxy-3-fluorothymidine (18FLT). Corresponding MIB-1 slides are shown at ×40 power, with positive nuclei staining brown. The liver lesion (B) which stains very highly for MIB-1 (LI 87%) is seen as avid for 18FLT in comparison with the liver lesion (C) with a low MIB-1 stain (LI 19%) which is not seen with 18FLT. The photopoenic appearance of the liver lesion (C) highlights the increased hepatic background activity secondary to glucuronidation of 18FLT in contrast with the low uptake in the lesion by virtue of its low proliferative rate.
DISCUSSION
Our results suggest that 18FLT reflects proliferative activity in CRC, as determined by MIB-1 staining. Lack of correlation between LIs and 18FDG supports previous evidence that 18FDG is not a specific marker of proliferation.21,22 The lesions successfully imaged with 18FLT demonstrated high SUVs in addition to high LIs. On the other hand, those lesions not visualised by 18FLT were shown to have correspondingly low LIs.
It is known that glucuronidation of 18FLT within the liver leads to high hepatic background activity which may inhibit its diagnostic utility.31 This was exemplified by failure of 18FLT PET to show two of the five liver metastases against this high liver background. However, both of these lesions displayed low proliferation labelling indices (19% and 26%), suggesting relatively slow growth compared with the remaining three liver metastases (labelling indices of 87%, 87%, and 73%). The fact that certain liver lesions are not seen with 18FLT may have prognostic implications in terms of the aggressiveness of these tumours.
The well documented problems of specificity due to uptake of 18FDG by activated macrophages32–34 is also highlighted in this study by the peritoneal lesion thought to be malignant because of a high uptake of 18FDG. Microscopic examination of the entire lesion showed a florid inflammatory response and fat necrosis secondary to previous surgery, but no tumour. In contrast, 18FLT showed no increased uptake within this lesion, suggesting that this new tracer may have a role to play in improving the diagnostic specificity of PET.
18FLT PET has recently been found in the investigation of solitary pulmonary nodules to be specific for malignant lesions. In addition, 18FLT correlates with the Ki-67 labelling index and estimation of prognosis.35 This hypothesis has been further validated by Vesselle and colleagues36 who assessed proliferation rates in 11 histologically proven non-small cell lung cancers using 18FLT PET and again demonstrated significant correlation with Ki-67.
The very nature of PET allows metabolic assessment of the whole tumour in its heterogeneic entirety. This coupled with the unique ability to quantitate the uptake of the tracers used, non-invasively and in vivo, has opened new avenues in the assessment of malignancy by functional imaging.
A system for grading the aggressiveness of CRC was first developed by Cuthbert Duke in 1932,37 and it was not until 1995 that a classification of prognostic markers was first suggested by the College of American Pathologists.38 Seventy years on, Dukes and TNM, along with the histological grade of the tumour, still remain the only reliable methods to dictate whether patients with CRC will receive adjuvant therapy. Unfortunately, under current guidelines, which have been set up in light of these prognostic indicators, there is still a cohort of patients who unnecessarily receive toxic chemotherapy while others who could potentially benefit from it are not recommended to receive it. In view of this, the prognostic value of Ki-67 in colorectal cancer has recently been revisited by the National Surgical Adjuvant Breast and Bowel Project Collaborative Study group in an attempt to define a marker on which therapeutic decisions could be made with greater precision.39
Ki-67 was selected for investigation because of its potential value in identifying populations of individuals who may or may not benefit from adjuvant chemotherapy. Significant prognostic value was found for patients with Dukes’ B and C disease although it was unable to differentiate between groups who might benefit from adjuvant chemotherapy. Prior to this study, there have been contradictory reports regarding the role of Ki-67 role as a prognostic indicator in CRC. Palmqvist and colleagues40 showed that those tumours with low Ki-67 expression at the invasive margin had a poor prognosis while Kimura and colleagues41 concluded that the tumours with high expression at the site of deepest invasion had a worse prognosis. In contrast, both Kubota and colleagues42 who analysed 100 cases of CRC using Ki-67, and Kyzer and colleagues43 who examined 30 resected specimens of CRC, concluded that Ki-67 could not be used as a prognostic determinant in CRC.
Our study has demonstrated that 18FLT PET may be used as a non-invasive method of quantitating cellular proliferation in CRC. This may offer the opportunity for CRC to be imaged at a pretreatment stage for those undergoing surgery and perhaps define the population of patients who might benefit from neoadjuvant therapy. In addition, it may also help in identifying a group of patients with recurrent disease who would not benefit from firstline chemotherapy as a result of the low proliferation rate of the tumour, as demonstrated by the low SUV on 18FLT PET imaging.
This would offer the clinician a further prognostic marker with which to assess the aggressiveness of the disease and perhaps allow a more precise method for therapeutic decisions to be made. In real terms, a decision regarding response to chemotherapy in CRC is usually judged six weeks into a 12 week treatment cycle. The potential of avoiding six weeks of unnecessary toxic chemotherapy by differentiating the non-responders from the responders at a pretreatment stage is a prospect which cannot be ignored.
Future work will help in validating 18FLT PET as a potential tool for the non-invasive in vivo assessment of CRC and may enable more accurate evaluation of the antitumoral effects of new as well as established anticancer drug treatments aimed at competing with DNA synthesis.
Acknowledgments
The authors wish to acknowledge Ian Croasdale and Caroline Townsend for their excellent radiographic and technical support in the imaging of the patients used in this study, and Phillipa Munson for her help in performing the immunohistochemistry.