


Abstract
P-glycoprotein (P-gp) is a major efflux transporter contributing to the efflux of a range of xenobiotic compounds at the blood-brain barrier (BBB). In the present study, we evaluated the P-gp function at the BBB using positron emission tomography (PET) in nonhuman primates. Serial brain PET scans were obtained in three rhesus monkeys after intravenous administration of [11C]verapamil under control and P-gp inhibition conditions ([PSC833 ([3′-keto-Me-Bmt1]-[Val2]-cyclosporin) 20 mg/kg/2 h]). The parent [11C]verapamil and its metabolites in plasma were determined by HPLC with a positron detector. The initial brain uptake clearance calculated from the integration plot was used for the quantitative analysis. After intravenous administration, [11C]verapamil was taken up rapidly into the brain (time to reach the peak, 0.58 min). The blood level of [11C]verapamil decreased rapidly, and it underwent metabolism with time. The inhibition of P-gp by PSC833 increased the brain uptake of [11C]verapamil 4.61-fold (0.141 versus 0.651 ml/g brain/min, p < 0.05). These results suggest that PET measurement with [11C]verapamil can be used for the evaluation of P-gp function at the BBB in the living brain.
The blood-brain barrier (BBB), formed by brain-capillary endothelial cells, is a functional barrier responsible for restricting the entry of compounds from the circulating blood to the brain parenchyma cells (Reese and Karnovsky, 1967). The highly developed tight junctions between the adjacent brain cerebral endothelial cells are an anatomical feature of the BBB that minimizes the nonspecific penetration of compounds via paracellular route (Pardridge, 1988). In addition to this physical barrier, metabolic enzymes and active efflux transporters on this barrier also play important roles in BBB function. P-glycoprotein (P-gp), a 170-kDa membrane protein that is responsible for the multidrug resistance of tumor cells, is a major efflux transporter contributing to the efflux of a range of xenobiotic compounds in the circulating blood at the BBB (Schinkel et al., 1994; Tamai and Tsuji, 2000; Kusuhara and Sugiyama, 2001; Hirrlinger et al., 2002). Interestingly, P-gp may also be involved in the efflux of β-amyloid and has been suspected to play a role in Alzheimer's disease (Lam et al., 2001; Vogelgesang et al., 2002). In addition, a drug-drug interaction involving P-gp inhibition at the BBB has also been suggested (Sadeque at al., 2000). In a clinical study, when loperamide was administered with quinidine, a known P-gp inhibitor, respiratory depression by loperamide was induced (Sadeque at al., 2000). It is speculated that this is caused by modulation of the P-gp-mediated efflux by quinidine. Furthermore, a genetic polymorphism (C3435T) of P-gp has been reported to be associated with drug resistance in patients with epilepsy (Siddiqui et al., 2003), although a controversial result was reported recently (Tan et al., 2004). Such a genetic polymorphism may be associated with interindividual differences in drug concentration in the central nervous system. These clinical reports prompted a growing interest in the quantitative evaluation of P-gp function in living human brain.
Recently, in vivo evaluation of P-gp function was proposed using an imaging method with [11C]colchicine, [11C]carvedilol, [18F]paclitaxel, and [11C]verapamil (Elsinga et al., 2004). Hendrikse et al. (1998) demonstrated in rodents that the brain uptake of the P-gp substrate [11C]verapamil was increased after pretreatment with cyclosporin A, a P-gp inhibitor, and they showed that that the distribution volume, estimated by Logan plot, was increased by pretreatment with cyclosporin A (Bart et al., 2003; Elsinga et al., 2004). As for human studies, Sasongko et al. (2005) demonstrated that the ratio of the area under the curve (AUC) of the brain concentration to that of blood concentration was increased in the presence of cyclosporin A, and Kortekaas et al. (2005) reported that the distribution volume of [11C]verapamil in the midbrain was increased in Parkinson's disease patients compared with controls. In the present study, the P-gp function at the BBB was evaluated in rhesus monkeys by PET using [11C]verapamil, with or without a potent P-gp inhibitor PSC833. PSC833 treatment caused a significant increase in the brain uptake clearance of [11C]verapamil, which was determined using integration plot analysis using initial brain and blood concentration data.
Materials and Methods
Chemicals. The P-gp inhibitor PSC833 (Valspodar) was kindly supplied by Novartis (Basel, Switzerland) and was dissolved in Intralipid (Lo et al., 2001) (oil in water emulsion droplet; Otsuka Pharmaceutical, Tokyo, Japan). [11C]Verapamil was synthesized from norverapamil (Eisai Co. Ltd., Tokyo, Japan) as described previously (Wegman et al., 2002) and diluted with approximately 2 to 3 ml 0.9% saline containing 0.75% polyoxyethylenemonosorbitan oleate and 1% ascorbic acid. The specific radioactivity of [11C]verapamil used in all experiments ranged from 28.3 to 79.7 GBq/μmol (47.6 ± 17.3 GBq/μmol, mean ± S.D., radiochemical purity is over 95%).
Animals. Three young male rhesus monkeys (Macaca mulatta) weighing approximately 6.0 to 6.7 kg were used. The monkeys were maintained and handled in accordance with recommendations by the United States National Institutes of Health and our own guidelines (National Institute of Radiological Sciences, Chiba, Japan). The study was approved by the Animal Ethics Committee of the National Institute of Radiological Sciences. A magnetic resonance image (MRI) of each monkey brain was obtained beforehand.
PET Scan. All PET scans were performed using a high-resolution SHR-7700 PET camera (Hamamatsu Photonics, Shizuoka, Japan) designed for laboratory animals, which provides 31 transaxial slices 3.6 mm (center-to-center) apart, a 33.1-cm field of view, and spatial resolution of 2.6 mm full width at half-maximum (Watanabe et al., 1997). Monkeys were trained beforehand as being immobilized with the head fixation device to ensure accuracy of repositioning throughout the session (Obayashi et al., 2001). The infusion of PSC833 (20 mg/kg/2 h), a P-gp modulator, or vehicle alone to each monkey was started 1 h before the intravenous administration of [11C]verapamil and maintained during the experiment. After administration of [11C]verapamil, 0.9% saline was flushed into the catheter line to prevent adsorption or retention of verapamil. Arterial blood sampling (∼0.5-1.5 ml) was performed via an indwelling arterial port from the saphenous artery at 10 s, 20 s, 30 s, 45 s, 1 min, 1.5 min, 3 min, 4.5 min, 6 min, 8 min, 10 min, 15 min, 20 min, 30 min, 45 min, and 60 min after administration, and the radioactivity in the blood was counted in a well-type γ-scintillation counter. Radioactivity was corrected for decay. After transmission scans for attenuation correction for 30 min, a dynamic emission scan in enhanced 2D mode was performed for 60 min (10 × 12 s, 30 × 6s,1 × 5 min, 2 × 5 min, and 5 × 8 min; a total of 36 frames). [11C]Verapamil was administered via the saphenous vein as a single bolus at the start of the emission scan. The injected doses of [11C]verapamil were 65.8 ± 11.5 MBq/kg (mean ± S.D.). The PET scans were separated by at least 4-week intervals and randomized for each monkey.
Metabolite Analysis. Arterial blood samples were collected at 1, 3, 6, 10, 15, 30, and 60 min after administration of [11C]verapamil. Plasma was obtained by centrifugation and deproteinized with 2 volumes of acetonitrile. The supernatant was analyzed for radioactive components using a high-pressure liquid chromatography (HPLC) system (PU-610A series; GL Sciences, Torrance, CA) with a coupled NaI(Tl) positron detector (Takei et al., 2001) to measure [11C]verapamil metabolites. Isocratic elution was performed with a reversed-phase semipreparative μ-Bondpak C18 column (7.8 × 300 mm i.d.; Waters, Milford, MA). The mobile phase consisted of a mixture of acetonitrile and 0.1 M ammonium acetate (70:30 v/v). The flow rate was 5 ml/min, and the injected sample size was 1.0 ml. The elute was monitored by ultraviolet absorbance at 254 nm and coupled NaI(Tl) positron detection. The percentage of parent radioactivity was determined from the activity of the parent verapamil with respect to the 11C radioactivity in the chromatogram.
PET Data Analysis. All emission scan images were reconstructed with a 4.0-mm Hann filter, and regions of interest were placed on the whole cerebrum using PET Analyzer (in-house software, National Institute of Radiological Sciences; Maeda et al., 2001), and MRI information on each monkey. The summation images of [11C]verapamil from 0 to 5 min were coregistered on the magnetic resonance images by means of statistical parametric mapping (SPM 2; Welcome Department of Cognitive Neurology, London, UK), and then the volume images were processed with Virtual Place TM (AZE Ltd. Tokyo, Japan). The decay-corrected 11C radioactivity was normalized to the injected dose (% dose). The maximal 11C radioactivity in the cerebrum (Cmax_cereb) and the time to reach the Cmax_cereb (Tmax_cereb) were obtained from the time-11C radioactivity data. The AUC was calculated for brain and blood, and it was calculated using data from 0 to 4.5 min after administration to minimize the bias by metabolites.
Integration Plot. The initial brain uptake was measured over a short period (∼1-4.5 min) using integration plot method. The uptake rate of [11C]verapamil can be described by the following equation, 
where CLuptake is the brain uptake clearance based on the blood 11C radioactivity, Xt,cereb is the amount of 11C radioactivity in the cerebrum at time t, and Ct,blood is the blood concentration calculated from 11C radioactivity. AUC(0-t) represents the area under the blood concentration curve from 0 to t, and VE represents the initial distribution volume in the brain at time 0. VE was obtained from the y- intercept of the integration plot and includes the distribution volume in blood residing within the brain as well as the initial distribution volume of [11C]verapamil in the brain rapidly equilibrating with that in blood. Therefore, the CLuptake value can be obtained from the initial slope of a plot of Xt,cereb/Ct,blood versus AUC(0∼t)/Ct,blood, designated as the integration plot (Kim et al., 1988).
Inhibition of P-gp Function. The effect of PSC833, a P-gp modulator, was evaluated based on the normalized time-activity curves of brain and blood for the three monkeys, with and without PSC833 administration. PSC833 was infused at a dose of 20 mg/kg/2 h starting 1 h before intravenous administration of [11C]verapamil and maintained until the end of the experiment (Song et al., 1999; Rodriguez et al., 2004). In a control experiment, drug vehicle was infused in the same manner. Differences were considered statistically significant when p < 0.05 using a one-sided paired t test, with the exception of the time course results in which two-way analysis of variance was used.
Results
The Distribution of [11C]Verapamil in the Brain. A control PET image (Fig. 1B) accompanied by a corresponding morphological MRI (Fig. 1A) showed the uptake of 11C radioactivity in the monkey brain. Higher uptake of 11C radioactivity was observed in the brain after PSC833 treatment (Fig. 1C, PSC833-treated). Brain uptake was also clearly identified from PET/MRI-coregistered images (Fig. 1, D and E). The time-activity curves in the cerebrum are shown in Fig. 2. The 11C radioactivity in the cerebrum peaked at 0.58 min after intravenous administration of [11C]verapamil and remained almost constant at this level up to 60 min. Only limited amount of 11C radioactivity (0.0105 ± 0.0006% dose/g brain, Cmax_cereb, mean ± S.D.) was transported into the cerebrum.
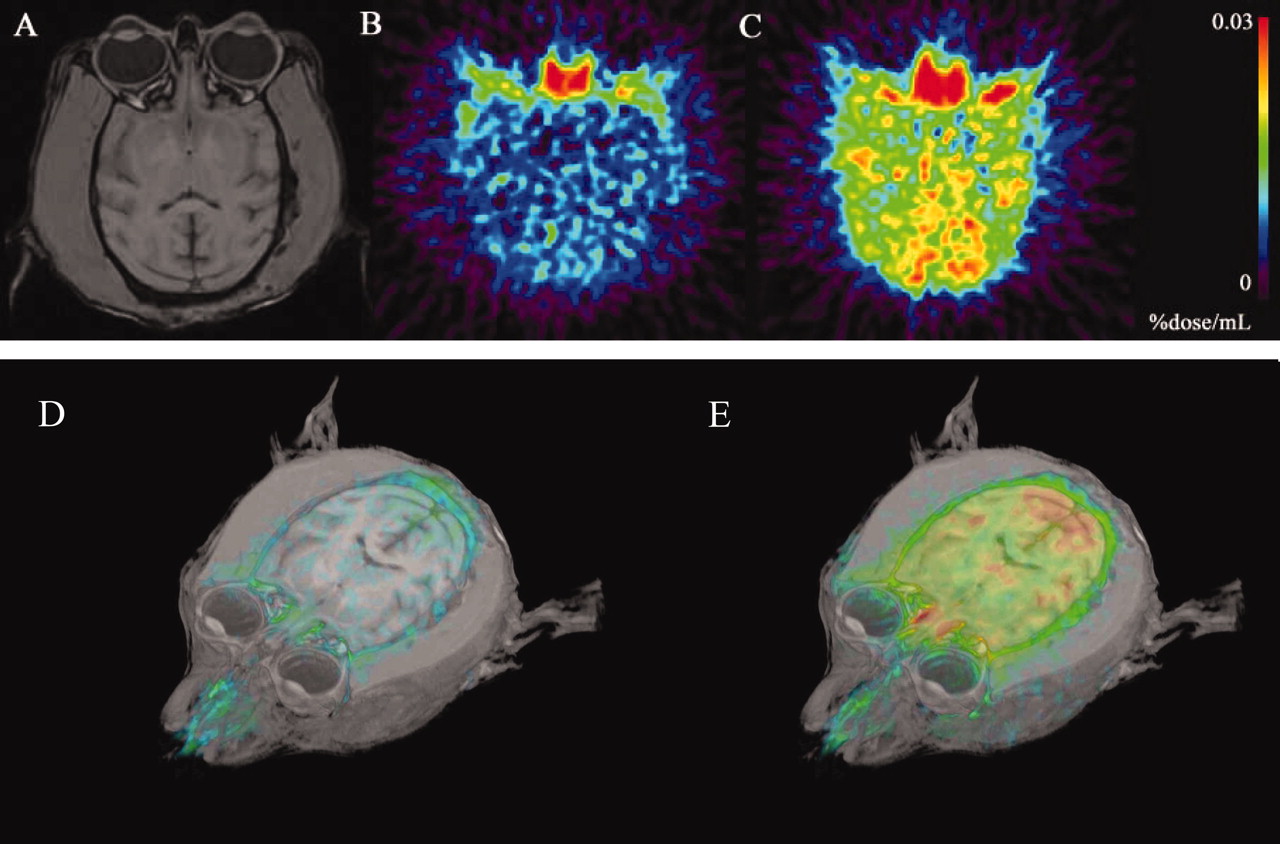
A typical MRI and a color-coded PET image after administration of [11C]verapamil. Horizontal slices of the brain MRI scans (A) and corresponding summation of PET images (B and C, up to 5 min) of the cerebral 11C radioactivity uptake in one animal. The reconstructed MRI-PET image is also shown to assist intuitive understanding (D and E). B and D represent the control state, and C and E are the P-gp inhibition conditions obtained after PSC833 administration.
Treatment with PSC833 significantly increased the 11C radioactivity uptake in the cerebrum (two-way ANOVA, p < 0.05). The cerebrum AUC (AUCcereb) of the PSC833 treatment group was significantly greater than that of the control group (1.96-fold) (Table 1; p < 0.05). The Cmax_cereb of the PSC833 treatment group was also significantly higher than that of the control group (1.57-fold) (Table 1, p < 0.05). The Tmax_cereb was not changed by treatment with PSC833 (Table 1).
Pharmacokinetic parameters of [11C]verapamil after intravenous administration, with or without PSC833 (20 mg/kg/2 h)
The AUCblood and AUCcereb were calculated from 0 to 4.5 min after the administration using data shown in Figs. 2 and 3. CLuptake and VE were obtained from Figure 5. The values represent mean ± S.D. (n = 3). Data in parentheses indicate values from individual animals.

The 11C radioactivity time curves in cerebrum. The inset shows the detail curves in the early time period (mean ± S.D., n = 3). The treatment with PSC833 clearly increases the 11C radioactivity in the cerebrum (two-way ANOVA, p < 0.05).
Blood Profile and Metabolism of [11C]Verapamil. The time-11C radioactivity in the blood is shown in Fig. 3. The 11C radioactivity in the blood fell quickly up to 3 min and then remained constant or slightly increased. Treatment with PSC833 did not affect the blood 11C radioactivity profile (two-way ANOVA). The blood AUC (AUCblood) of the PSC833 treatment group was similar to that of the control group (Table 1).
A chromatogram of the HPLC analysis of [11C]verapamil, with or without treatment with PSC833, is shown in Fig. 4A. The retention time of verapamil was approximately 7 to 8 min. The fraction of intact verapamil decreased with time (Fig. 4B). At 10 min after administration, on average, approximately 25% of the radioactivity in plasma was the metabolite of [11C]verapamil in the control group and intact verapamil represented approximately 50% of the radioactivity in the plasma of the control group 30 min after administration (Fig. 4B). Treatment with PSC833 slightly increased the metabolite fraction in plasma (Fig. 4B; two-way ANOVA, p < 0.05). The inset in Fig. 3 shows the time-activity curves of intact [11C]verapamil in plasma. The plasma radioactivity profile of intact [11C]verapamil was not affected by treatment with PSC833 (two-way ANOVA).

The [11C]radioactivity and intact (inset) [11C]verapamil activity-time curves in cerebrum and blood. The time-11C radioactivity and intact [11C]verapamil activity curves in blood are similar for both the control and PSC833 treatment groups (mean ± S.D., n = 3).
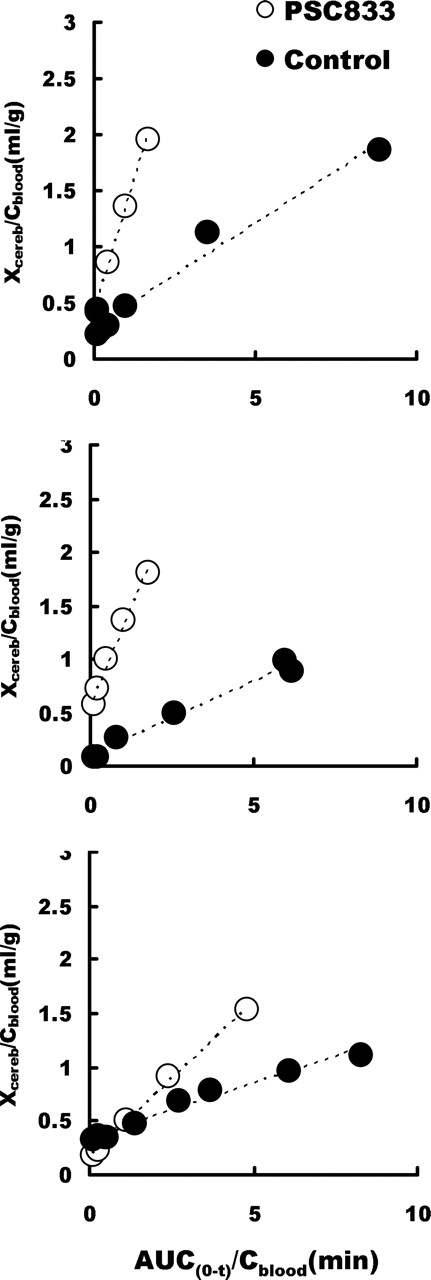
The Brain Uptake Clearance of [11C]Verapamil and Effect of PSC833. Integration plots of the control and PSC833 treatment studies of the three monkeys are shown in Fig. 5, A through C. The integration plots were linear over a short period, which varied from 1 min to 4.5 min, depending on the subject and with or without PSC833 treatment. During this period, the metabolite of [11C]verapamil accounted for less than 12.5% 11C radioactivity. The initial brain uptake of the control group was 0.141 ml/g/min (0.141 ± 0.043, mean ± S.D.), and this was increased after PSC833 treatment (0.651 ± 0.333 ml/g brain/min, mean ± S.D., p < 0.05). The VE was not changed by PSC833 treatment (Table 1). The AUCcereb/AUCblood ratio of 11C radioactivity was increased 2.31-fold in the presence of PSC833.
Discussion
In this study, we evaluated the P-gp function at the BBB in vivo using PET with [11C]verapamil. Recently, the use of imaging techniques, such as single photon emission-computed tomography and PET using [11C]colchicine, [11C]carvedilol, [18F]paclitaxel, and [64Cu]complexes and [68Ga]complexes and [99mTc]complexes, has been suggested for the noninvasive evaluation of P-gp function in vivo (Elsinga et al., 2004). Among these compounds, [11C]verapamil is a well characterized PET ligand for evaluating P-gp function at the BBB (Hendrikse et al., 1998, 1999), and verapamil can be easily labeled with 11C using commercially available norverapamil (Wegman et al., 2002).
After intravenous administration of [11C]verapamil, it was rapidly distributed in the brain over a short period and then was eliminated slowly (Fig. 2). Apparently, the 11C radioactivity reached a distributional pseudoequilibrium within a short period (Fig. 3). This is similar to earlier results obtained in rats (Hendrikse et al., 1999). The uptake of 11C radioactivity into the cerebrum increased after PSC833 treatment (Figs. 1 and 2). PSC833 treatment increased the AUCcereb and Cmax_cereb of 11C radioactivity compared with the values obtained in the control group (Table 1). These data indicate that the efflux transport by P-gp affects the initial brain uptake and that the inhibition of P-gp-mediated transport increases the brain uptake of P-gp substrates (Kusuhara et al., 1997; Dagenais et al., 2000) and supports recent human brain PET study using [11C]verapamil, which was published during the revision process of this manuscript (Sasongko et al., 2005).
The blood concentration-time profile of the 11C radioactivity was biphasic, exhibiting a rapid reduction within minutes followed by an increase in the 11C radioactivity (Fig. 3). The increase at later time points was more marked in the PSC833-treated group than in the control group. The 11C radioactivity in the blood specimens includes unchanged [11C]verapamil and its metabolites (Fig. 4A). Approximately 75% of the 11C radioactivity was unchanged [11C]verapamil during the initial 10 min, and the fraction of the unchanged form in the blood specimens rapidly decreased (Fig. 4B). This observation is consistent with the previous reports of verapamil metabolism in humans (Kroemer et al., 1993; von Richter et al., 2000; von Richter et al., 2001) and monkeys (Link, 2003), whereas low levels of the metabolite of [11C]verapamil during PET studies have been reported in rodents (Hendrikse et al., 1998, 1999). Because the increase at later time points was not observed in the blood concentration-time profile of unchanged [11C]verapamil (Fig. 3, inset), it is likely that the increase is due to the accumulation of metabolites in the blood from the peripheral tissues. Since PSC833 is known to be a fairly specific P-gp inhibitor with a low degree of metabolic inhibition (Kawahara et al., 2000) and metabolites of verapamil are also substrates of P-gp with a range of specificities (Pauli-Magnus et al., 2000), PSC833 treatment may cause a delay in the elimination of metabolized verapamil, resulting in marked plasma accumulation of metabolites.

A, typical chromatograms of plasma samples at 1, 6, 10, and 60 min after intravenous administration of [11C]verapamil, with or without PSC833. B, parent [11C]verapamil fraction of the 11C radioactivity in plasma. The parent verapamil was detected at approximately 7 to 8 min (V). HPLC analysis suggested that there are at least two metabolites (M1, M2) of verapamil after intravenous administration. The parent fraction of verapamil in plasma fell rapidly with time. At 10 min after administration, on average, approximately 75% of the radioactivity in plasma was due to the parent verapamil in the control group and the parent verapamil represented approximately 50% of the radioactivity in the plasma of the control group 30 min after administration (mean ± S.D., n = 3).
Because we could not separate metabolites from parent verapamil in brain, there is a possibility that different parent/metabolite ratio might exist in the brain compared with blood. To deal with this extensive metabolism of [11C]verapamil, we used the initial PET data (∼0-4.5min) to avoid any bias from metabolites. Integration plot analysis has been used to obtain a tissue-specific uptake clearance. The initial PET scan data (from 0 to ∼1-4.5 min, depending on the subjects) was enough to calculate the initial uptake clearance, during which no extensive metabolism of verapamil was observed (Fig. 4). Figure 5 shows the integration plot of the blood versus tissue time-activity curves in three monkeys (Fig. 5). The CLuptake calculated from the slope of the integration plot increased after treatment with PSC833. This indicates the modulation of P-gp function at the BBB by PSC833 (Table 1) (Kusuhara et al., 1997; Song et al., 1999). The initial brain uptake clearance of [11C]verapamil is a sensitive parameter for P-gp function at the BBB. However, the magnitude of the increase observed in PSC833-treated monkeys was not as high as that observed in P-gp knockout mice. This may be explained by incomplete inhibition of P-gp activity by PSC833, variable brain concentration of PSC833 in monkey, and, partly, a species difference in P-gp expression and/or intrinsic efflux transport activity. In fact, PSC833 treatment does not fully inhibit P-gp function at the BBB in mice (Kusuhara et al., 1997). Interestingly, recent human [11C]verapamil PET study in the presence of cyclosporin A showed a similar degree of increase in the brain distribution of verapamil by P-gp inhibition. In this study, the AUCcereb/AUCblood ratio of 11C radioactivity was increased 1.88-fold in the presence of cyclosporin A, which was consistent with the present study (2.31-fold) (Sasongko et al., 2005). This supports the belief that the species difference in the role of P-gp at the BBB may not be very significant between humans and monkeys and suggests the feasibility of a PET study using monkeys to provide information on the human BBB. Unlike the slope, the y-intercept of the plot was insensitive to the PSC833 treatment (Table 1). The y-intercept represents the initial distribution volume, including the vascular space and rapid adsorption/binding to the vascular surface, which can achieve rapid equilibrium with the blood compartment. Because the initial distribution volume is greater than the vascular space in the brain, estimated to be 35μl/g brain in 15 adult rhesus monkeys (Eichling et al., 1975), it seems that the adsorption/binding of [11C]verapamil to the vascular surface occurs within a short period. The use of integration plot analysis helps in the quantitative investigation of P-gp function at the BBB without any interference from the rapid and extensive metabolism of [11C]verapamil, which makes it inappropriate to use common graphical methods that need data obtained from long-term sampling (Logan, 2003).

Integration plot of the brain uptake of [11C]verapamil for the three monkeys (A, B, and C). The initial brain uptake of the control group was increased after treatment with PSC833 (t test, p < 0.05, n = 3). The VE was not changed by PSC833 treatment.
In conclusion, we have been able to evaluate P-gp function at the BBB in nonhuman primates, using [11C]verapamil as a PET ligand and integration plot method. P-gp at the BBB has attracted much interest from a clinical point of view; i.e., drug-drug interactions and the effects of genetic polymorphisms. Therefore, in future, PET studies using [11C]verapamil will be a powerful tool for evaluating P-gp function at the BBB in a noninvasive manner.
Acknowledgments
We thank the members of the Cyclotron Unit and Radiopharmaceutical and Radiopharmacological Section for operation of the cyclotron and the production of radioisotopes, Novartis Pharm AG for its kind gift of PSC833, and Eisai Co. Ltd. for its kind gift of norverapamil.
Footnotes
-
↵1 Current affiliation: College of Pharmacy, Kyung Hee University, Seoul, Korea.
-
This study was performed through the Advanced and Innovational Research program in Life Sciences from the Ministry of Education, Culture, Sports, Science and Technology, Japan. This work was also partially supported by a research grant from the Society of Japanese Pharmacopoeia and the Minister of Health, Labor and Welfare.
-
doi:10.1124/jpet.105.088328.
-
ABBREVIATIONS: BBB, blood-brain barrier; ANOVA, analysis of variance; AUC, area under the curve; Cmax, maximal concentration; HPLC, high-pressure liquid chromatography; MRI, magnetic resonance image; PET, positron emission tomography; P-gp, P-glycoprotein; PSC833, [3′-keto-Me-Bmt1]-[Val2]-cyclosporin; Tmax, time to reach the Cmax.
- Received April 21, 2005.
- Accepted November 16, 2005.
- The American Society for Pharmacology and Experimental Therapeutics


