Article Text

Abstract
Background We assessed the clinical utility of β-amyloid (Aβ) imaging with 18F-florbetaben (FBB) in mild cognitive impairment (MCI) by evaluating its prognostic accuracy for progression to Alzheimer's disease (AD), comparing semiquantitative with visual scan assessment, and exploring the relationships among Aβ, hippocampal volume (HV) and memory over time.
Methods 45 MCI underwent FBB positron emission tomography, MRI and neuropsychological assessment at baseline and 2 years and clinical follow-up at 4 years. Positive FBB (FBB+), defined by a cortical to cerebellar cortex standardised uptake value ratio (SUVR) ≥1.45, was compared with visual assessment by five readers. Amnestic MCI (aMCI) was defined by a composite episodic memory (EM) Z-score of <−1.5.
Results At baseline, 24 (53%) MCI were FBB+. Majority reads agreed with SUVR classification (κ 0.96). In 2 years, 18 (75%) FBB+ progressed to AD compared with 2 (9.5%) FBB−, yielding a predictive accuracy of 83% (95% CI 61% to 94%). Four FBB− developed non-AD dementia. Predictive accuracies of HV (58% (95% CI 42% to 73%)) and aMCI status (73% (95% CI 58% to 81%)) were lower. Combinations did not improve accuracy. By 4 years, 21 (87.5%) FBB+ had AD whereas 5 (24%) FBB− had non-AD dementia yielding a predictive accuracy of 94% (95% CI 74% to 99%). While the strong baseline association between FBB SUVR and EM declined over 2 years, the association between EM and HV became stronger. FBB SUVR increased 2.2%/year in FBB+ with no change in FBB−.
Conclusions 18F-florbetaben Aβ imaging facilitates accurate detection of prodromal AD. As neurodegeneration progresses, and in contrast with the early stages of the disease, hippocampal atrophy and not Aβ, seems to drive memory decline.
Trial registration number NCT01138111.
- ALZHEIMER'S DISEASE
- AMYLOID
- COGNITION
- DEMENTIA
- MRI
Statistics from Altmetric.com
Introduction
β-Amyloid (Aβ) imaging with positron emission tomography (PET) allows in vivo confirmation of the presence of one of the neuropathological hallmarks of Alzheimer's disease (AD) thereby increasing diagnostic certainty, improving the differential diagnosis among neurodegenerative conditions,1–3 aiding selection and therapeutic monitoring of individuals in clinical trials,4 and potentially allowing earlier diagnosis.5 ,6 However, there is considerable variability in the progression rates of Aβ scan positive individuals with mild cognitive impairment (MCI) due to AD reflecting differences in sample size, recruitment source, duration of follow-up and in the entry criteria definition of MCI among studies. For example, in the study by the AV45-A11 study group,7 the definition of MCI was given as a score of 0.5 on the Clinical Dementia Rating scale8 irrespective of cognitive test results, and participants in that study were recruited both from specialist clinics and the community. The rate of conversion to AD in those with a positive 18F-florbetapir Aβ scan at baseline was 35% at 3 years.9 In contrast, the Australian Imaging, Biomarkers and Lifestyle study of ageing (AIBL) found a conversion rate of 86% at 3 years in 11C-PiB Aβ baseline scan positive amnestic MCI (aMCI) participants referred from memory disorder specialists who met criteria for episodic memory (EM) impairment on a word list recall task.10 More data are therefore required to clarify the prognostic significance of a positive Aβ scan in an individual with MCI.
Besides Aβ imaging, other biomarkers, such as hippocampal volume (HV), and cognitive markers, particularly performance on EM measures, have prognostic value in MCI populations for progression to AD. More data that compare these markers, individually and in combination, are needed for the most cost-effective implementation of recently proposed criteria for earlier diagnosis of AD.5 ,6
In recent years, a number of fluorine-18 (18F) labelled amyloid tracers have been developed. The 110-min half life of 18F allows widespread distribution from a production facility to multiple sites for research and clinical use. 18F-florbetaben (trans-4-(N-methly-amino)-4″-{2-[2-(2-[18F] fluoro-ethoxy)ethoxy]-ethoxy} stilbene) (FBB) has high affinity and specificity to Aβ,11 and was the first reported 18F labelled tracer to show a robust capacity to distinguish AD from other dementias and healthy elderly individuals.12–14 The cortical retention of FBB is highly correlated with the cortical retention of 11C-PiB (r=0.97)15 and has shown a strong correlation with histopathological results.16 The first aim of the present study was to evaluate the prognostic accuracies of a baseline positive FBB PET scan in predicting progression from MCI to AD assessed semiquantitatively as compared with hippocampal atrophy (HA) and/or EM impairment.
While most amyloid imaging studies have used semiquantitative measures to assess the images, visual assessment of the images is required in routine clinical practice. The second aim of this study was to compare standard semiquantitative assessment with visually assessed scans in determining a positive or negative scan.
Regardless of the cause, pathological abnormalities in mesial temporal cortex had been linked to the amnestic symptoms in MCI subjects who progressed to clinical dementia.17 While the majority of these reported abnormalities in AD are usually associated with neurofibrillary tangles,17 the relationship between Aβ and EM remains unclear.4 Our own observations in this MCI cohort at baseline revealed that the relationship between Aβ and EM was stronger than, and independent to, the relationship between HV and EM18 contrary to another report that the relationship between Aβ and EM was driven by HA.19 The third aim of this study was to assess the relationships among Aβ, HV and EM over time.
The final aim was to examine whether progressive Aβ accumulation is detectable using FBB PET, similar to what was reported for 11C-PiB PET studies.20
Methods
Participants, assessments and scans
Recruitment procedures have been previously described.18 ,21 Approval for the study was obtained from the Austin Health Human Research Ethics Committee. Written informed consent was obtained from all participants prior to screening. Recruitment commenced in May 2008 and ended on December 2009. Safety monitoring consisted of clinical observation, haematology and biochemistry testing and measurement of vital signs before and after tracer injection, and 1 week later.
Entry criteria were MCI as per Petersen22 and Winblad and colleagues23 criteria, with presentation of progressive cognitive decline and at least one neuropsychological test score falling 1.5 SDs below published means.
The 45 participants underwent MRI and FBB PET scans and comprehensive cognitive evaluation at baseline, 1 and 2 years. They also had clinical evaluations every 6 months for the first 2 years that included interview with the participant and a reliable informant (predominantly the spouse), and review of investigations in the study other than the FBB scan and HV. Diagnostic classification at 2 years was performed by a neurologist blind to the FBB and quantitative HV results. Clinical diagnosis of probable AD was made according to the NINCDS-ADRDA criteria.24 Diagnoses for non-AD dementia were consistent with published criteria.25–27 Further clinical follow-up evaluation to approximately 4 years (ie, 46±7 months postbaseline PET scan) was performed with access to all study results and personal medical records.
MRI and FBB PET scans were assessed as previously described.18 FBB neocortical standardised uptake value ratio (SUVR) was derived using the cerebellar grey matter as reference region, with the assessor blind to the clinical and neuropsychological test results. HV was derived from T1 MPRAGE MRI sequence using a commercial software program, Neuroquant. A composite EM score was calculated by combining the delayed recall scores from the Logical Memory subtest (first story only from the Weschler Memory Scale), the California Verbal Learning Test, second edition and the Rey complex figure test, which were converted to Z-scores using means and SDs derived from a subsample of 45 demographically well-matched participants from the AIBL.18 ,21 ,28 aMCI was defined by a composite EM Z-score of <−1.5 SD.
Baseline FBB scans were used to assess the predictive accuracy for progression to AD at 2 years. The cut-off for high (FBB+) PET was defined as an SUVR ≥1.45, based on hierarchical cluster analysis of healthy controls as previously described.18 The cut-off for HA was determined by double ROC analysis on the HVs measured by Neuroquant of 23 AD patients and 143 healthy controls from the AIBL study.28
Baseline FBB PET images underwent visual assessment by five independent nuclear medicine physicians blinded to clinical data. Readers had limited or no prior experience with amyloid PET visual interpretation and were trained on an electronic training tool. The image assessment was performed on axial slices, in a grey scale. A scan was read as positive if increased tracer uptake was visible in any of the frontal, parietal, temporal and posterior cingulate/precuneus cortices. The majority read approach established the final result. Rereads were also conducted after the final results (see online supplementary material for a detailed description).
Statistical analysis
Positive predictive value, negative predictive value and accuracy are expressed with 95% CIs. IBM Statistical Package for the Social Sciences (SPSS) V.15.0 was used to perform analyses. Cox proportional regression analyses were used to determine HRs for progression to probable AD at 2 years as well as progression to any dementia at 4 years, for the different biomarkers. Linear regression analyses were used to examine the relationships among SUVR, HV and composite EM scores. Cohen’s κ assessed the agreement between majority visual read and SUVR in classifying positive and negative scans, and Fleiss's κ assessed the agreement across all five readers. Statistical tests were two-sided, and performed with the risk of type-I error set at 0.05, and with age, gender and years of education entered as covariates in all analyses. Data are presented as mean±SD unless otherwise indicated.
Missing data
In all, 36 (80%) participants completed the full battery of investigations over 2 years. The others missed MRI or FBB PET or both at 2 years. Follow-up to 4 years was conducted on 38 (84%) participants. Of the other seven, all were FBB+ at baseline and all converted to AD prior to study withdrawal (six) or death (one) during the initial 2 years of the study. Consequently, 100% of the cohort either developed dementia during the study and/or completed clinical follow-up at 4 years.
Results
Demographics
Participant demographics and other baseline findings are shown in table 1. At baseline, 19 (42%) had HA, and 28 (62%) were aMCI.
Baseline characteristics of the cohort
No serious adverse events were reported by any patient as a result of FBB or participation in this study. There were no significant fluctuations of haematology, biochemistry, coagulation profile and vital signs in any patient from prescan laboratory blood samples and 1-week post scan laboratory blood samples. No participants or their relatives raised concerns about the study and all enrolled participants tolerated the study well.
FBB+/FBB−
As previously described,18 24 (53%) of the MCI subjects were deemed FBB+ (SUVR >1.45) at baseline. By visual reads classification, 25 (56%) MCI subjects had positive FBB scans, yielding an almost perfect agreement with FBB SUVR, with a κ value of 0.96 (CI 0.87 to 1.00). The only discrepancy was an MCI subject with high focal cortical FBB retention in the left lateral temporal cortex, but the average neocortical SUVR of 1.38 did not reach the 1.45 threshold. Also, high agreement was observed among the five readers with a κ value of 0.82 (CI 0.74 to 0.92). Including the 10% rereads, all five readers agreed in the assessment of 40/51 evaluations (78.4%), while four readers agreed in the remaining 11 cases.
Progression to probable AD and non-AD dementia over 2 years
At 2 years, 18/24 (75%) MCI with baseline FBB+ (figure 1), 18/28 (64%) with aMCI status at baseline and 10/19 (53%) with baseline HA progressed to AD, compared with 2/21 (9.5%) of FBB−, 2/17 (12%) non-aMCI and 10/26 (38%) without HA (table 2). When both aMCI status and FBB+ were present at baseline, 17/22 (77%) progressed to AD by 2 years. A total of 4 (19%) FBB− MCI developed non-AD dementia (figure 1): one to progressive supranuclear palsy (PSP), two to frontotemporal lobar degeneration (FTLD) and one to dementia with Lewy bodies (DLB).
Mild cognitive impairment: bivariate correlates of progression to Alzheimer's dementia over the first 2 years of follow-up

Baseline neocortical FBB standardised uptake value ratio (SUVR) values in stable mild cognitive impairment subjects and in those progressing to dementia at 2 and 4 years. High Aβ burden as assessed by FBB was associated with increased likelihood of progression to Alzheimer's dementia. At the 4-year evaluation, 21/24 (88%) FBB+ subjects had progressed to Alzheimer's dementia. Dotted line denotes the SUVR threshold of 1.45 used to categorise those subjects with high (FBB+) or low (FBB−) florbetaben retention. Green circles: Not demented; Red circles: Alzheimer's disease; Black circles: Non-Alzheimer's dementia.
Based on 2 years of follow-up, both FBB+ and aMCI status at baseline independently predicted progression to AD with HR 11.1 (p=0.001) and 7.5 (p=0.01), respectively, but HA at baseline did not significantly predict progression to AD (HR 1.5, p=0.4). FBB+ at baseline robustly predicted progression to AD after adjusting for both aMCI status and HA (HR 6.9, p=0.03). However, aMCI status at baseline did not predict progression to AD after adjusting for both FBB+ and HA (HR 2.2, p=0.4).
Four-year clinical evaluation
At 4 years, 21/24 (87.5%) of participants with baseline FBB+ had AD and 5/21 (24%) of participants with baseline FBB− had developed another form (non-AD) of dementia (p<0.001) (figure 1). Of the three FBB+ MCI who did not develop dementia at 4 years, one remained classified as MCI until death at 39 months, and the other two had worsening cognitive impairment according to their informant and medical records but insufficient functional impairment to meet AD criteria. Of the two FBB− participants who were diagnosed as AD at 2 years, one improved and reverted back to MCI at 44 months. This was the same participant who had the focal positive visual read and normal SUVR but close to the cut-off value. The other FBB− participant had progressive aphasia, normal cerebral spinal fluid (CSF)-τ and P-τ levels, and met criteria for possible FTLD at 36 months. Overall, this yielded a predictive accuracy for FBB alone at 4 years of 94% (95% CI 74% to 99%).
Of the other four FBB− diagnosed with non-AD dementia at 2 years, one had the diagnosis of PSP confirmed at postmortem at 35 months, one participant who met criteria for probable FTLD at 2 years subsequently also developed amyotrophic lateral sclerosis at 51 months, while the other two remained probable FTLD and DLB at 4 years, respectively.
At 4 years, 20/28 (71.4%) aMCI and 10/19 (53%) of participants with HA progressed to AD, yielding predictive accuracies of 80% and 56%, respectively. Both FBB+ and aMCI status at baseline independently predicted progression to any dementia at 4 years with HR 3.7 (p=0.007) and 2.9 (p=0.04), respectively, but HA did not (HR 1.2, p=0.6). Applying thresholds at −1.0, −1.5 and −2.0, z-scores generated using the HV data from the health control (HC) cohort in AIBL resulted in no significant improvement of the predictive accuracy of HV (58%, 56%, and 56%, respectively). FBB+ predicted progression after adjusting for both aMCI status and HA (HR 3.0, p=0.058). However, after adjusting for both FBB+ and HA, aMCI status did not (HR 1.5, p=0.5).
Aβ, HV and EM over time
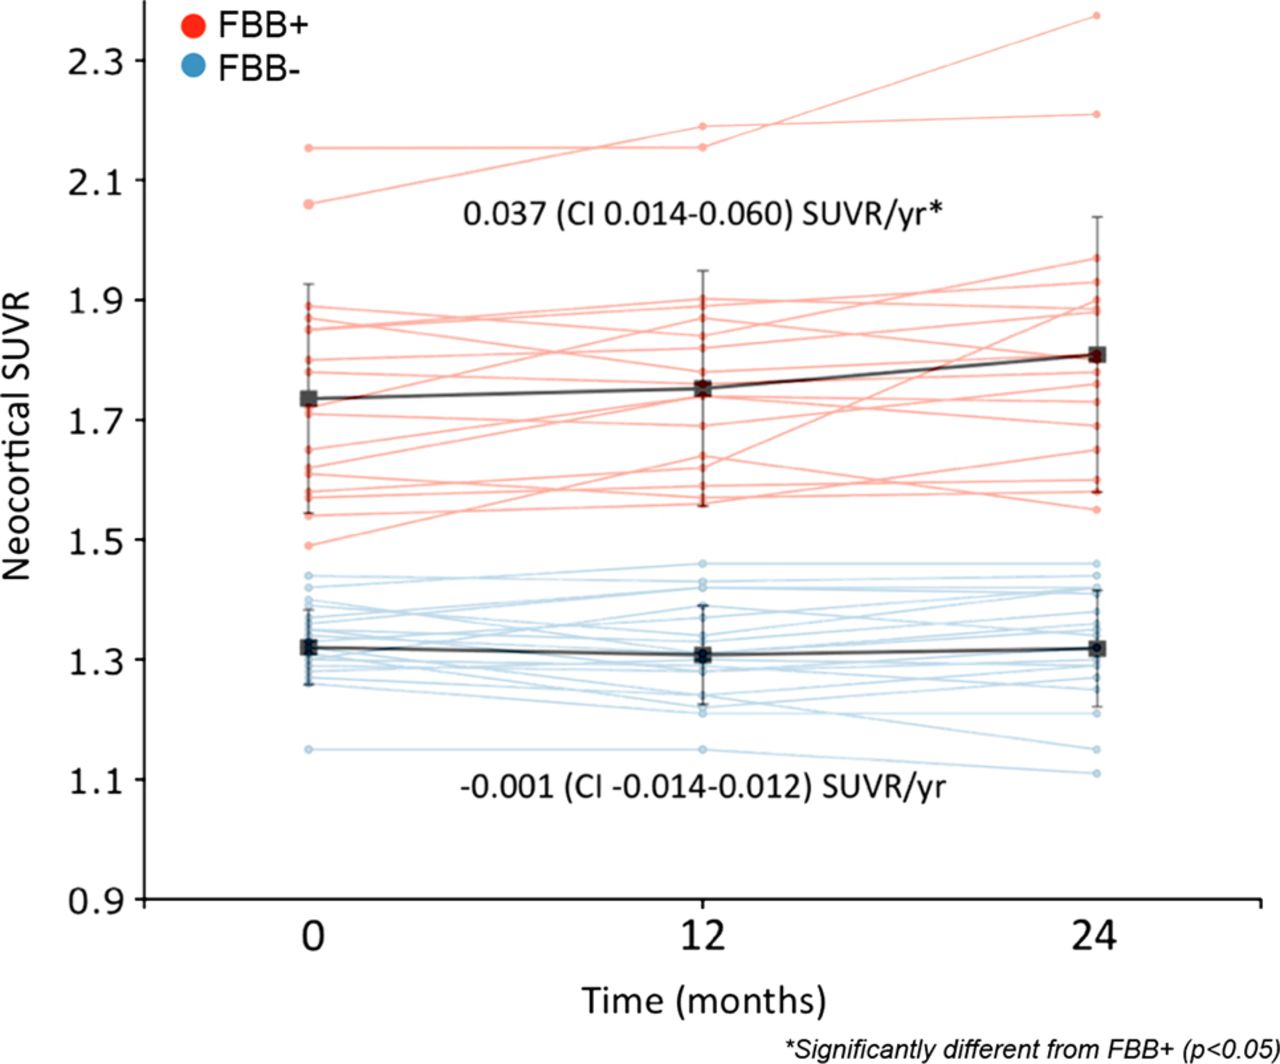
In FBB+ MCI subjects, neocortical SUVR increased significantly (p=0.003) at a rate of 0.037 (95% CI 0.014 to 0.060) SUVR/year (figure 2). No changes were observed in FBB− MCI subjects (figure 2).
Changes in neocortical FBB standardised uptake value ratio (SUVR) over 2 years. In the FBB+ mild cognitive impairment (MCI) group (red lines), FBB SUVR increased at a rate of 0.037 (95% CI 0.014 to 0.060) SUVR/year or 2.2%/year (t(17)=3.47, p=0.003). No increases were observed in the FBB− MCI group (blue lines).
At baseline, both FBB SUVR (R2=0.26, p=0.0015) and HV (R2=0.36, p=0.024) were significantly and independently associated with EM.18 Of the 36 MCI participants who completed the full battery of evaluations at 2 years, while the correlation between FBB SUVR and EM was weaker (from R2=0.19, p=0.008 to R2=0.14, p=0.031), the association between HV and EM became stronger (from R2=0.07, NS to R2=0.27, p=0.003). In contrast to the baseline findings, the correlation between FBB SUVR and EM at 2 years lost significance after adjusting for HV (R2=0.07, NS), while the correlation between HV and EM remained significant after accounting for FBB SUVR (R2=0.13, p=0.03). While still not significant, the correlation between FBB SUVR and HV increased from R2=0.03 to R2=0.10 after 2 years.
Discussion
This prospective study showing the robust independent predictive utility of Aβ imaging with FBB PET provides further evidence that prodromal AD or MCI due to AD6 ,9 is accurately identified by the use of a biomarker specific to Alzheimer's pathology in patients with a history of cognitive decline and who have objective impairment. This allows an earlier diagnosis with a high level of confidence. Economic models have suggested that shortening the time to diagnosis of AD by confirming the presence of AD pathology with FBB PET may be cost-effective.29 There was an excellent inter-rater reliability for the visual reads as well as an almost perfect concordance with the classification of a scan as positive or negative for Aβ by semiquantitative assessment with the neocortical SUVR, supporting its use in routine clinical settings. Our finding that FBB imaging alone had 83% (95% CI 61% to 94%) accuracy over 2 years for prediction of AD is supported by pooled data from all published longitudinal Aβ imaging studies of MCI to date.9 ,10 ,30–32 The pooled data are results from 297 MCI subjects followed for an average of 34 months. Progression to AD was observed in 121/174 (70%) when Aβ imaging was positive compared with 10/123 (8%) if Aβ imaging was negative,9 ,10 ,30–32 yielding a predictive accuracy of 81% (95% CI 74% to 86%).
In this study, we did not find that predictive accuracy was further improved by the combination of FBB imaging with aMCI status. This is at odds with our previous findings in the AIBL study10 and likely reflects differences in subject selection and sample size.
Of those MCI who had dementia at 4 years, 21/26 (81%) were FBB+ at baseline. This figure is consistent with postmortem studies of MCI. For example, one study reported that 68%–88% of those with MCI who progressed to dementia had AD neuropathology at postmortem depending on the neuropathological criteria used.17 The rate of progression to dementia in FBB− MCI was 24% at 4 years. This figure is also close to the AIBL study which showed that 29% of MCI participants with a negative 11C-PiB Aβ baseline scan progressed to dementia at 3 years follow-up.10
HV showed limited prognostic value. Consistent with these findings, a review pooling results across AD imaging biomarkers reported the highest diagnostic and prognostic accuracy for amyloid imaging and the lowest for MRI.33 HA is observed with ageing in the absence of neurodegenerative disease and also occurs in other dementias including DLB and FTLD.34 There is no universally accepted method to measure HV, define HA, or determine the threshold for detecting or predicting progression to AD. Consequently, we used a commercially available software package that is operator and site independent, and applied it to a 3D MP-RAGE MRI sequence to measure HV. We used the double ROC approach to determine the optimal threshold for distinguishing AD from healthy elderly in an unrelated study population and applied this threshold to determine the predictive accuracy of HV in this MCI cohort. It could be argued that the selected threshold might not be optimal, but we have subsequently applied different data-derived thresholds and were not able to improve the predictive accuracy of HV.
Aβ, HA and EM
The strengthening of the correlation between HV and EM and the concomitant weakening of the correlation between Aβ and EM over 2 years of serial study is consistent with the hypothetical sequence of biomarker change in AD,35 where progressive HA continues as Aβ accumulation plateaus after dementia develops. This weakening of the strength of the correlation between Aβ and EM with disease progression may account for some of the variability reported on the correlation of Aβ and EM between MCI studies.4 Furthermore, despite a non-significant mild strengthening of the correlation between Aβ and HV after 2 years, the correlation between Aβ and EM disappeared when accounting for HV. These results, along with our previous baseline report18 suggest that while at very early stages, Aβ and HV are significantly and independently related to EM impairment, and as disease progresses the relation between Aβ and EM is mediated by HV. This is in agreement with previous reports19 and supports the concept that disease modifying therapy, when available, should be given very early to achieve the greatest benefit.
Aβ accumulation over time
Longitudinal studies of Aβ with PET indicate that accumulation takes approximately 15–20 years to progress from the Aβ+ threshold to the levels seen in most patients with mild AD.20 ,36 During this period, the slow increase in Aβ accumulation remains constant, but as disease progresses the rates of accumulation slow down, tending towards a plateau.20 ,36 In this study, we observed an increase in FBB retention at a rate of 0.037 SUVR/year in FBB+ participants, similar to the rates of 0.043 SUVR/year reported in longitudinal studies with 11C-PiB PET.20 This also suggests that FBB PET is sensitive enough to monitor the therapeutic response to anti-Aβ therapy.
Limitations
Among the limitations of the present study are the single-centre setting, the fact that repeat scans and neuropsychology tests were only obtained for 2 years and that the clinical evaluation was not blinded to FBB results beyond 2 years. Nonetheless, the 4-year follow-up reinforces the 2-year findings and provides valuable insight into the eventual outcome for both Aβ+ and Aβ− scan individuals with MCI. Other limitations include possible confounding effects from acetylcholinesterase inhibitor medication on cognition that was commenced in seven participants who completed FBB and neuropsychological studies to 2 years. Given that six out of these seven declined in EM scores at 24 months compared with baseline, impact on the overall results is likely to be minor.
Conclusions
Aβ imaging with 18F-florbetaben PET accurately predicts individuals who will progress from MCI to Alzheimer's dementia. Visual scan reading provides equivalent results to the optimal cut-off SUVR value when categorising scans as either positive or negative. As disease progresses, HA may overtake Aβ in driving memory impairment. FBB PET is also a sensitive technique to longitudinally assess Aβ accumulation in the brain.
Acknowledgments
Dr Kerryn Pike assisted with neuropsychology assessments. Mr David Baxendale, Dr Judith Adams and Mrs Svetlana Pejoska assisted in participant screening and recruitment. Mr Gareth Jones organised and preprocessed the PET and MRI digital data.
References
Supplementary materials
Supplementary Data
This web only file has been produced by the BMJ Publishing Group from an electronic file supplied by the author(s) and has not been edited for content.
Files in this Data Supplement:
- Data supplement 1 - Online supplement
Footnotes
-
Contributors KTO contributed to acquisition of data, analysis and interpretation, and wrote the initial draft of the paper. VLV contributed to study concept and design, analysis and interpretation, critical revision of the manuscript for important intellectual content, and study supervision. AB-F and FL contributed to acquisition of data and critical revision of the manuscript for important intellectual content. NL contributed to acquisition of data and provided comments to the paper. AMC contributed to analysis and interpretation, and critical revision of the manuscript for important intellectual content. JS developed the methods for and coordinated the blinded read analysis. AWS, LMD, CBR, BP, BR and CLM contributed to study concept, design and supervision. CCR contributed to study concept and design, data acquisition, analysis, interpretation, study supervision, critical revision of the manuscript for important intellectual content, assisted with writing, and had final authority to submit the manuscript for publication.
-
Funding This study was initiated by Professor CC Rowe, sponsored by Bayer Healthcare AG, Berlin, Germany, and funded in part by NHMRC grant 509166.
-
Competing interests CCR, VLV and JS are/were consultants for Bayer Healthcare AG. CCR has received research support from Bayer Healthcare, GE Healthcare, Avid Radiopharmaceuticals, Astra Zeneca, NHMRC, CSIRO, SIEF, Alzheimer's Association and an anonymous foundation for amyloid imaging studies. VLV serves as an editorial board member of Alzheimer's Research and Therapy, received payments from the Michael J Fox Foundation, European Society of Nuclear Medicine and the Brain Imaging Council, and research support from NHMRC for amyloid imaging studies. JS is a director of Molecular Neuroimaging, LLC, and this company provides its services to multiple pharmaceutical companies including Bayer Healthcare and Piramal Life Sciences in relation to amyloid Imaging. KTO, AB-F, FL and CLM and NL report no disclosures. AWS and LMD were employees for Bayer Healthcare and are now employees of Piramal Life Sciences. AMC is a Piramal Life Sciences employee. CBR was an employee of Bayer Healthcare and is now an employee of Navidea Biopharmaceuticals. BP and BR are employees of Bayer Healthcare.
-
Patient consent Obtained.
-
Ethics approval Austin Health Human Research Ethics Committee.
-
Provenance and peer review Not commissioned; externally peer reviewed.