Article Text

Abstract
Background: Clinically apparent Alzheimer’s disease (AD) is thought to result when brain tissue damage exceeds a critical threshold of “brain reserve”, a process possibly accelerated by the apolipoprotein E (ApoE) E4 allele. The interaction between onset age and ApoE genotype was investigated to assess whether early disease onset (<65 years) in patients carrying the E4 allele is associated with greater cerebral metabolic (regional cerebral metabolic rate of glucose utilisation, rCMRgl) reduction.
Methods: AD patients, divided into early (EOAD; 27 patients) and late onset (LOAD; 65 patients) groups, both groups balanced as to the number of E4 carriers (E4+) and non-carriers (E4−), and matched controls (NC; 35 cases) underwent 18F-FDG PET ([18F]fluorodeoxyglucose positron emission tomography) scanning. SPM’99 software was used to compare AD patients to NC and to perform a two way ANOVA with onset age and ApoE genotype as grouping factors. Results were considered significant at p<0.001, uncorrected.
Results: AD patients demonstrated rCMRgl reductions compared to NC, with rCMRgl lower in association cortex and relatively higher in limbic areas in EOAD compared to LOAD subjects. rCMRgl was lower in the anterior cingulate and frontal cortex for E4+ compared to E4− subjects. A significant onset age by ApoE interaction was detected in the hippocampi and basal frontal cortex, with EOAD E4+ subjects having the greatest rCMRgl reduction.
Conclusions: The interactive effects of early onset age, possibly reflecting lower brain reserve, and ApoE E4 allele, possibly leading to greater tissue damage, lead to reduced tolerance to the pathophysiological effects of AD in key brain regions.
- AD, Alzheimer’s disease
- ApoE, apolipoprotein E
- BFC, basal frontal cortex
- BRC, brain reserve capacity
- CDR, Clinical Dementia Rating
- CT, computed tomography
- EOAD, early onset AD
- FDG-PET, fluorodeoxyglucose positron emission tomography
- FOV, field of view
- GLM, General Linear Model
- IADL, Inventory of Activities of Daily Living
- LOAD, late onset AD
- MMSE, Mini-Mental State Examination
- MRI, magnetic resonance imaging
- MTL, medial temporal lobe
- NC, controls
- NEST-DD, Network for Efficiency and Standardization of Dementia Diagnosis
- NFT, neurofibrillary tangles
- NP, neuritic plaques
- SPM, statistical parametric map
- Alzheimer’s disease
- apolipoprotein E
- brain reserve
- early onset
- FDG-PET
Statistics from Altmetric.com
- AD, Alzheimer’s disease
- ApoE, apolipoprotein E
- BFC, basal frontal cortex
- BRC, brain reserve capacity
- CDR, Clinical Dementia Rating
- CT, computed tomography
- EOAD, early onset AD
- FDG-PET, fluorodeoxyglucose positron emission tomography
- FOV, field of view
- GLM, General Linear Model
- IADL, Inventory of Activities of Daily Living
- LOAD, late onset AD
- MMSE, Mini-Mental State Examination
- MRI, magnetic resonance imaging
- MTL, medial temporal lobe
- NC, controls
- NEST-DD, Network for Efficiency and Standardization of Dementia Diagnosis
- NFT, neurofibrillary tangles
- NP, neuritic plaques
- SPM, statistical parametric map
Alzheimer’s disease (AD) is thought to be the end result of the interactive effects of pathological tissue damage and the individual’s capacity to compensate for that damage, the so called brain reserve capacity (BRC). Overall dementia severity is, thus, determined on the one hand by the extent of neuritic plaques (NP), neurofibrillary tangles (NFT), and synapse loss in the brain, and on the other hand by BRC, reflecting the amount of tissue damage one individual is able to cope with before reaching a critical threshold of reduced cognitive functioning.1,2 Differences in the individual degree of tolerance to advancing brain damage may be responsible for heterogeneity in the occurrence and timing of AD, in that clinically evident symptoms would appear at an earlier age in patients with lower BRC.
AD patients with an early onset (EOAD, onset <65 years) demonstrate a faster progression and a more severe clinical presentation than those with a late onset (LOAD, onset >65 years), despite being younger. Several studies showed that EOAD patients have more severe NP, NFT density, and synapse loss,3,4 cerebral atrophy,5,6 and metabolic (regional cerebral metabolic rate of glucose utilisation, rCMRgl) and perfusion (regional cerebral blood flow, rCBF) dysfunction within the parieto-temporal and frontal association areas.7–11 The hypothesis has been put forward that EOAD patients have lower BRC, so that they express clinical symptoms at an earlier age.1,2
Additionally, AD genetic predisposing risk factors, in particular the E4 allele of the apolipoprotein E (ApoE) gene,2 influence the course of disease leading to an earlier age at disease onset.12 The ApoE epsilon 4 (E4) allele has been associated with a faster pathological progression of brain lesions and synapse depletion,13,14 and greater cerebral atrophy15,16 and rCMRgl or rCBF impairment in both cognitively intact elderly at risk for AD17,18 and AD patients.19,20 As a consequence, it could be considered a factor disruptive to BRC due to its ineffective role in resisting pathological deposition.21
Previous studies have proposed the typical AD associated cerebral perfusion and metabolism reductions as one index of pathophysiological disease severity closely reflecting the underlying degree of reserve utilised.2,22,23 To date, only one fluorodeoxyglucose positron emission tomography (FDG-PET) study has been performed to assess the impact of the ApoE genotype on rCMRgl with respect to the different ages at AD onset.24 Although this study showed rCMRgl differences between E4 carriers and non-carrier patients with an early onset, the interaction between the patients’ age at onset and the ApoE genotype was not taken into account.24
The present FDG-PET study was aimed at investigating the interaction between onset age and ApoE genotype in AD. Since an early onset of disease is thought to reflect less BRC and the ApoE4 genotype has been related to greater synaptic dysfunction, we hypothesised that EOAD patient carriers of the E4 allele would have the most severe metabolic reduction.
METHODS
AD patients
Inclusion criteria
Subjects were recruited from the Department of Psychiatric and Neurological Sciences at the University of Florence, Italy in accordance with the Network for Efficiency and Standardization of Dementia Diagnosis (NEST-DD) research project (http://www.nest-dd.org) and were studied for cerebral glucose metabolism by PET between November 2000 and November 2002 at the Nuclear Medicine Unit of the University of Florence. The study procedures included examinations by neurologists and psychiatrists, routine laboratory tests, neuropsychological examinations, EEG (electroencephalograms), PET scans, and blood samples for genetic analysis. If possible, the subjects also underwent CT (computed tomography) or MRI (magnetic resonance imaging) examinations.
A total of 92 consecutive patients were included in the present study after being diagnosed according to the National Institute for Neurological Disorders and Stroke and the Alzheimer’s Disease and Related Disorders Association (NINCDS/ADRDA) criteria25 for probable AD. Severity of dementia was determined according to the Clinical Dementia Rating (CDR) scale,26 which classifies dementia into four categories, ranging from very mild to severe dementia. The categorisation is based on the level of cognitive functioning and the ability to cope with daily living activities, which were further evaluated in this study by administering the Mini-Mental State Examination (MMSE)27 and Inventory of Activities of Daily Living (IADL) scale28 to the subjects. All participants were classified as having mild dementia according to the above criteria (for example, a CDR score of 1, an MMSE score of 21–26, and impaired activities of daily living). Written informed consent was obtained from all patients in agreement with institutional guidelines.
Patients were classified as EOAD (onset age <65 years) and LOAD (age >65 years) on the basis of age at symptom onset.
Exclusion criteria
Patients with a clinical diagnosis of dementia had a blood test to excluded other medical illnesses possibly causing cognitive impairment, such as thyroid disease, vitamin deficiencies, and malignant disease. Patients were also excluded in case of mental disease, substance abuse, or significant neurological antecedents, such as brain trauma, tumors, epilepsy, and inflammatory disease. Vascular dementia and dementia of other types were ruled out according to DSM-IV-TR29 and the Hachinski scale.30
ApoE genotypes
DNA was obtained from blood samples to determine ApoE genotypes using a standard polymerase chain reaction technique.31 None of the familial AD patients carried mutations of the APP or PS-1 and PS-2 genes.
Controls
A total of 35 healthy and unmedicated sex and age matched subjects (19 males, 16 females; mean age (SD): 69.3 (5.6) years; range: 64–81 years; education (SD): 10.3 (3.2) years; MMSE (SD): 29 (1) points), included in the NEST-DD database, were employed as controls (NC). As previously described,20 all subjects underwent clinical and neuropsychological examinations to exclude organic brain disease and cognitive impairment.
FDG-PET image acquisition
The detailed FDG-PET scanning procedure employed was described in Herholz et al.32 Briefly, resting patients were injected with a dose of 370 MBq [18F]fluoro-2-deoxy-d-glucose (18F-FDG), with eyes closed and ears unplugged, in a dimly lit room with minimal background noise. Then 30 min after FDG administration, a 20 min scan was acquired using a GE Advance PET device (GE Medical Systems, Milwaukee, WI, USA). A polycarbonate head holder was used to reduce head movement during the scan. Emission scans were acquired in two dimensional mode with an axial field of view (FOV) of 15 cm and a planar FOV of 50×50 cm. Images were reconstructed by filtered back projection. Attenuation correction was performed according to Chang’s method.33 A total of 35 PET slices were acquired using a 256×256 matrix with a pixel dimension of 2.14×2.14 mm; the slice thickness was 4.25 mm.
FDG-PET image transformation
FDG-PET images were converted into Analyze format using ImageJ software (http://rsb.info.nih.gov/ij/). Basic image processing and voxel based data analyses were performed using SPM’99 routines (Wellcome Department of Cognitive Neurology, London, UK) implemented in MATLAB (Mathworks, Sherborn, MA). PET images were realigned and spatially normalised by affine 12 parameter transformation onto a PET-FDG template conformed to the MNI (Montreal Neurological Institute) space, which approximates the Talairach and Tournoux space.34
Normalised images were represented on a 79×95×68 matrix with 2×2×2 mm voxel size. Thereafter normalised images were smoothed with an isotropic Gaussian filter (12 mm full width at half maximum, FWHM) to account for individual variability in structure-function relationship and to enhance signal to noise ratio.35 Individual counts were normalised to mean global activity using proportional scaling to obtain relative CMRgl (rCMRgl) out of FDG radioactivity measurements. The gray matter threshold was set to 0.8 of the mean and global calculation was obtained with respect to the mean voxel value.
Statistical analyses
Clinical and demographic data
Differences in demographic and clinical data across groups were evaluated using STATISTICA, 6.0 version (StatSoft, Tulsa, OK, USA). Differences between NC and AD patients were assessed with Student’s t test for independent samples.
Two way analysis of variance (ANOVA) with onset age (EOAD, LOAD) and ApoE status (E4+, E4−) as grouping factors and Scheffè follow up tests were used to examine the demographic and clinical characteristics across AD groups. For all analyses, differences were considered significant at p<0.05.
PET data
After stereotaxic normalisation and image smoothing, statistical analysis was performed using SPM’99.
Initially, the whole AD group was compared to the NC in order to confirm the previously reported typical hypometabolic pattern. Differences in rCMRgl between groups were estimated on a voxel by voxel basis, after correcting for age. For each voxel in stereotaxic space, the ANCOVA (analysis of covariance) generated a group specific adjusted mean rCMRgl value and an associated adjusted error variance.35,36 This allowed planned comparisons of the mean rCMRgl distributions between conditions (that is, groups). For each voxel, the mean rCMRgl values were compared with the t statistic and thereafter transformed into normally distributed Z statistics. The resulting set of Z values constituted a statistical parametric map (SPM{Z} map).35 For the contrasts of interest, the significances of these SPMs were assessed by comparing the expected and observed distribution of the t statistic under the null hypothesis of no differential group effect on rCMRgl, and differences between groups were estimated using t contrasts, according to the General Linear Model (GLM).36 Based on previous FDG-PET findings32 we defined the precuneus, posterior cingulate, parietal, temporal, and prefrontal cortex, on both hemispheres, as candidate areas for possible rCMRgl reductions in the AD group as compared to NC. Since we had an a priori hypothesis as to the brain regions showing group differences, results were considered significant at p<0.001, uncorrected for multiple comparisons.35
The main interest here was the assessment of significant rCMRgl alterations associated with the age of AD onset and the ApoE genotype in AD. A two factor ANOVA was therefore performed with SPM’99, taking onset group (EOAD v LOAD) and ApoE groups (E4+ v E4−) as grouping factors, and accounting for age.
The main effects of the factors and their interactions were estimated on a voxel by voxel basis. For each voxel in stereotaxic space, the two way ANOVA generated a condition specific adjusted mean rCMRgl value and an associated adjusted error variance.35,36 Again, this allowed planned comparisons of the mean rCMRgl distributions across all sets of conditions. The mean rCMRgl values were then compared for each of the main effects and the interaction effect with the F statistic and thereafter transformed into normally distributed Z statistics. For the contrasts of interest, the significances of the resulting SPMs were examined as described above, and significant main effects for the onset age and ApoE groups as well as onset age by ApoE interaction effects were assessed according to the GLM.36 Therefore, separate SPM analyses were carried out to assess: (i) the main effect of onset age, that is rCMRgl differences between EOAD and LOAD, (ii) the main effect of ApoE genotype, that is rCMRgl differences between E4+ and E4−, and (iii) onset by ApoE group interaction effects. Main group and interaction effects on rCMRgl were examined using appropriate F contrasts and post hoc t tests were performed to assess differences across groups, according to the GLM.36 Based on previous FDG-PET studies we defined the posterior association and frontal cortex, and the medial temporal lobe (MTL) areas, as candidate areas for possible rCMRgl differences between onset groups,7–11 and the cingulate and parieto-temporal areas for rCMRgl differences between ApoE groups.17–20 Results were considered significant at p<0.001, uncorrected. The image smoothness after Gaussian filtering was 18.2 20.9 20.0 (FWHM, mm) and the search volume (number of voxels analysed) was 164 300 voxels.
Localisation of activations
Brain areas reaching the significance threshold were identified and labeled according to the Talairach and Tournoux space,34 after coordinate conversion from the MNI to the Talairach space using M Brett’s sets of linear transformations (http://www.mrc-cbu.cam.ac.uk/Imaging/).
RESULTS
Clinical and demographic data
Of the 92 patients included in the study, 27 were EOAD and 65 were LOAD. The EOAD group included 12 E4+ patients (six E3/E4 carriers and six E4/E4 carriers) and 15 E4− patients. The LOAD group included 31 E4+ patients (22 E3/E4 carriers and nine E4/E4 carriers) and 34 E4− patients. The characteristics of the groups under study are reported in table 1.
Clinical and demographic characteristic of the EOAD and LOAD patients under study, divided between ApoE E4 carriers (E4+) and non-carriers (E4−)
AD patients were comparable to NC with respect to the age at examination, gender distribution, and educational level. On two factor ANOVA, group differences were observed for age (F = 138.48, p<0.001) and post hoc tests revealed significantly lower age for EOAD patients as compared to LOAD (p<0.001; table 1), as expected. The influence of age on rCMRgl was therefore taken into account setting this variable as covariate of no interest in the subsequent two factor ANOVA carried out with SPM’99. No difference was found across groups for disease severity and duration, educational level, and gender.
PET data
As compared to the NC, AD patients demonstrated the expected rCMRgl reductions within the parieto-temporal areas, entailing the inferior parietal lobule (Brodmann Area, BA 40) and the inferior temporal gyrus (BA 20), the precuneus (BA 7) and posterior cingulate cortex (BA 23/31), and the superior frontal gyrus (BA 8), bilaterally (data not shown).
The two factor ANOVA yielded significant main effects for both the onset and ApoE groups, as well as significant onset by ApoE group interactions (table 2).
Results from SPM two way ANOVA
Significant main effects for the onset age were found in several brain areas (table 2A). Post hoc comparisons between EOAD and LOAD groups showed that the EOAD patients have lower rCMRgl with respect to the LOAD group within the orbitofrontal gyrus (BA 11), the inferior parietal lobule (BA 40), and the inferior temporal gyrus (BA 20) (table 3, fig 1A). Conversely, the LOAD group has lower rCMRgl compared to the EOAD within the paralimbic and limbic areas, involving the bilateral anterior cingulate cortex (BA 24/32) and the right hippocampus (table 3, fig 1A).
SPM post hoc comparisons between EOAD and LOAD patients

(A) Metabolic differences between EOAD and LOAD patients. Statistical parametric maps (SPMs) showing areas of significantly lower rCMRgl in EOAD as compared to LOAD patients (top row) and lower rCMRgl in LOAD as compared to EOAD patients (bottom row). From left to right: Results are superimposed onto the right lateral/medial, superior, and inferior views of a volume rendered spatially normalised MRI image. Results are shown at p<0.001, uncorrected. The t value color coded scale is reported at the right side of the image. (B) SPMs showing reduced metabolism in ApoE E4 carriers compared to the non-carriers. Results are superimposed onto anterior and superior views of a volume rendered spatially normalised MRI image. Results are shown at p<0.001, uncorrected. The t value color coded scale is reported at the right side of the image. (C) SPMs showing significant interactions of the onset age (EOAD and LOAD) and the ApoE genotype (E4− and E4+) on rCMRgl. Results are displayed as SPM projections in the three orthogonal right lateral, posterior, and superior views (top row) and superimposed on a spatially normalised MRI image at x = 0 mm, y = −35 mm, z = −2 mm relative to the AC-PC line (bottom row). Results are reported at p<0.001, uncorrected and corresponding F values are rendered in a color coded scale shown at the bottom right of the figure.
Significant effects of the ApoE genotype were found in the bilateral anterior cingulate cortex (BA 24/32) and the basal frontal cortex (BA 11), and in the right medial frontal gyrus (BA 10) (table 2B). Post hoc t tests showed lower rCMRgl for the E4+ as compared to the E4− carriers in all the above brain regions (fig 1B).
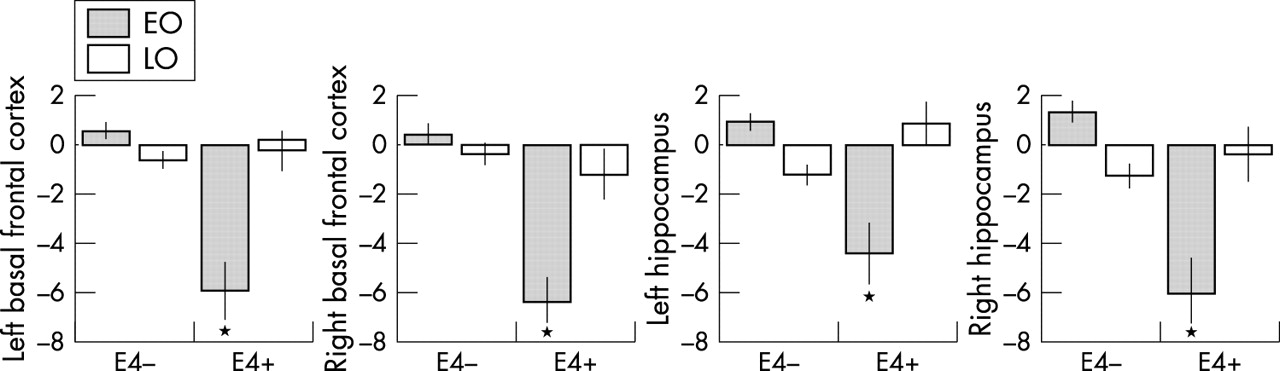
Significant onset by ApoE interaction effects were found in the basal frontal cortex (BFC, BA 11) and the hippocampi, bilaterally. Such interaction remained significant after accounting for the length of illness, educational level, and severity of dementia (table 2C; fig 1C). Post hoc comparisons showed that such interaction was driven by the EOAD/E4+ patients, since BFC and hippocampus rCMRgl was significantly lower for the EOAD/E4+ group with respect to all other subgroups (p<0.001). Figure 2 displays such interaction in terms of the percentage rCMRgl values extracted from the BFC and hippocampus regions at the peaks of maximum statistical significance listed in table 2C.

Percentage rCMRgl values (normalised to a mean value of 50) extracted from the local maxima of statistical significance from the brain regions showing significant interaction effects between onset age (EOAD, LOAD) and ApoE genotype (E4−, E4+) on two way ANOVA (p<0.001, uncorrected). Corresponding coordinates and probability values can be found in table 2.
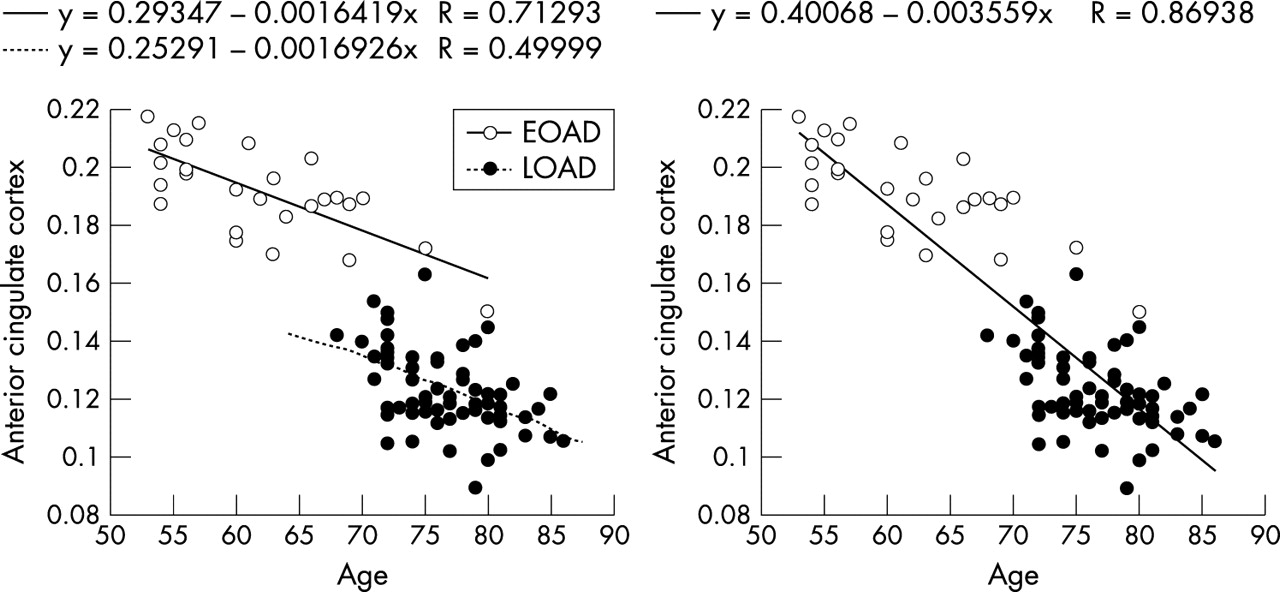
The above two way ANOVA with onset and ApoE groups was performed correcting for age, given the significant different ages between onset groups (mean (SD) age: EOAD = 63 (7) years; LOAD = 77 (4) years). This statistical procedure, although necessary, may have overcorrected the results and removed genuine onset age effects. We therefore checked whether such correction was too conservative on the results by performing two SPM correlation analyses for each onset group separately, to see if there was a within onset group correlation between glucose uptake and age and if the ANCOVA with age was needed. Negative correlations between rCMRgl and age were found in the bilateral ACC (BA 24/32) for both the EOAD (cluster extent, Ke = 795, x = −4, y = 43, z = 1, Z score = 4.65, and x = 5, y = 41, z = 4, Z score = 4.55; p<0.001, uncorrected) and the LOAD groups (Ke = 1181, x = −4, y = 46, z = 8, Z score = 5.08, and x = 3, y = 35, z = 12, Z score = 4.75; p<0.001, uncorrected). Results from the ANOVA analysis showed that the LOAD patients have lower rCMRgl in the ACC as compared to the EOAD group (fig 1A), although, as fig 3 shows, the correlation with age occurs both within and across groups and was not only driven by age of onset effects (that is, rCMRgl differences between groups). ANCOVA with age was therefore needed and did not appear to lead to overcorrection of the ANOVA results, since group differences within the ACC could still be detected after removal of linear age effects.
Correlations between rCMRgl and age within the EOAD and LOAD groups. Percentage rCMRgl values (normalised to a mean value of 50) extracted from the anterior cingulate cortex, in which a significant negative correlation between rCMRgl and age was found for both onset groups at p<0.001. As the plots show, two separate round data clouds are apparent (caused by age of onset effects on rCMRgl) but the correlation with age was significant within and across onset groups. Since the correlation was not only driven by age of onset effects (that is, rCMRgl differences between EOAD and LOAD groups), then the correction for age in the two way ANOVA was needed.
DISCUSSION
The present FDG-PET study revealed that the interaction of the ApoE genotype with the age at AD onset, expressing the underlying level of brain reserve capacity (BRC), is disruptive to brain metabolism, in that EOAD patient carriers of the ApoE4 allele show the greatest rCMRgl reduction in the hippocampi and basal frontal cortex.
The concepts of BRC and symptoms threshold have been proposed to explain heterogeneity in the outcome of the clinical symptoms of dementia and particularly why, although AD patients could be comparable for overall dementia severity, still they express the clinical manifestations of dementia at an earlier or later age and with different phenotypic profiles.1,2 The clinical expression of AD is thought to occur as the amount of brain damage in specific regions exceeds a critical threshold of BRC, beyond which normal cognitive function cannot be maintained.1,2 Individual differences in the amount of available BRC could modulate the timing and onset of clinical symptoms and possibly in interaction with the ApoE4 genotype, which is thought to intervene in this process by enhancing brain tissue damage and synapse loss.2 Indeed, ApoE directly influences brain functioning at the neuronal level because of its role in reparative cellular mechanisms, with the ApoE4 isoform having the poorer potential.12,21,31
As direct measures of severity of AD pathology are not currently available, several studies have proposed the metabolic reductions detected by PET and FDG as one biomarker of severity of synapse loss in AD.8,23 It is widely accepted that, among functional brain imaging techniques, FDG-PET has the unique ability to estimate local cerebral glucose consumption in vivo, and several studies have consistently demonstrated a close coupling between CMRgl and local neuronal activity.37,38 CMRgl is generally considered an index of the integrated local synaptic activity,39 mainly reflecting glutamatergic transmission.38 Although the specific cellular and molecular mechanisms of neuronal activity that are coupled to energy metabolism have not yet been exactly identified and quantitated, it seems like much of the glucose metabolism measured by PET is coupled to glutamate driven astrocytic glucose uptake,38 so that most of the changes in CMRgl consumption may be directly related to excitatory glutamate neurotransmitter release, and thus neuronal activity. Moreover, there is recent evidence for an association between CMRgl and synaptic density, as demonstrated by Rocher et al,40 who found significant correlations between CMRgl, as measured in vivo by PET, and postmortem levels of synaptophysin, a well established marker of synaptic density.
Actually, progressive neuronal dysfunction and loss could be seen as the most proximal brain event associated with the clinical expression of dementia and have turned out to be the major correlate of cognitive impairment in AD.41 Synaptic dysfunction and loss induce a reduction of neuronal energy demand and the resulting decreased glucose metabolism could be assessed with FDG-PET,8 so that hypometabolism in AD has been largely associated with loss of synaptic activity and density.42 Since brain metabolism is necessary to neuronal activity,37–40 and brain reserve is supposed to rely on such a background of neural networks and synapse availability,1,2 changes in brain metabolism have been linked to the underlying BRC status.
As compared to healthy controls, patients showed the typical rCMRgl decreases within the brain regions critical to AD, namely the temporo-parietal, posterior cingulate, and frontal areas.32 In addition, the comparison between EOAD and LOAD patients showed that, although patients were comparable for overall dementia severity, still the earlier or later ages at which they expressed the clinical manifestations of dementia were associated with specific patterns of metabolic differences. Indeed, EOAD patients presented with greater metabolic impairment in the heteromodal cortices, mainly involving the parieto-temporal and orbitofrontal areas, with respect to the LOAD group. Conversely, LOAD patients had reduced rCMRgl in the limbic and paralimbic areas, entailing the anterior cingulate cortex and the hippocampal formation, as compared to the EOAD patients. These results confirm findings from previous functional studies, which reported that EOAD patients have a more severe rCMRgl reduction in the associative cortices7–11 while the LOAD patients have more prominent MTL involvement.10,11
The EOAD patients showed greater rCMRgl dysfunction within posterior cortical areas that partially overlapped those typically hypometabolic for the entire patient sample as compared to control. Alternatively, the LOAD group showed more severe rCMRgl reductions in MTL areas, thus outside the parieto-temporal regions. In the context of the BRC hypothesis the present findings indicate that, although an earlier age at AD onset indicates globally less BRC, the descent below the critical threshold is attained in different brain regions depending on the age at disease onset. Therefore, synapse loss should be more prominent in the associative areas for clinical expression of AD at an earlier age, and in the limbic areas for AD at a later age. Such preferential involvement of different target regions seems to lead to different impacts of brain pathology on function. Indeed, clinical and neuropsychological studies revealed that EOAD patients usually present with impairments in visuo-spatial skills, which are mainly sustained by the association posterior cortex, whereas LOAD patients show more marked memory defects, suggesting a limbic involvement.7,43,44
The assessment of ApoE related effects showed a significant impact of the ApoE genotype on cerebral metabolism, after dementia severity, length of illness, and education were accounted for. The comparison between ApoE groups showed reduced rCMRgl in the anterior cingulate, and medial and basal frontal cortex of the E4 carriers with respect to the non-carriers. These findings replicate results from our previous study on a smaller sample size,20 showing that the E4 allele affects brain metabolism leading to more global impairment in a dose dependent fashion, involving the anterior cingulate and frontal cortex.20 Further support to the above findings derives from FDG-PET studies that have associated the ApoE4 genotype with greater risk of functional decline in elders without dementia17,18 and with more severe perfusion deterioration as detected by longitudinal single photon emission computed tomography (SPECT) studies in clinical AD patients.19
Interestingly enough, the E4 carriers showed lower rCMRgl as compared to the non-carriers mainly within anterior cortical regions, and therefore outside areas of hypometabolism typically seen in AD, but which are rather affected by age related processes.32 Findings from PET studies suggested that the rate of glucose consumption impairment could be accelerated by the combined effect of the aging process itself and the presence of the E4 allele,18,45 leading to enhanced vulnerability for the frontal areas. Taken together, these findings suggest that even one single copy of the E4 allele makes healthy individuals unable to cope successfully with age related changes and AD patients less effective in compensating for advancing AD pathophysiology. Moreover, no significant metabolic reduction was found in the E4 non-carriers with respect to the E4 carriers. This result is supported by genetic data providing evidence for a protective effect exerted by the E2 and E3 alleles against advancing brain damage, thus reducing or delaying the clinical expression of AD.12–14
The main interest of the present study was the effect of the interaction between ApoE and onset age on brain metabolism, resulting in the greatest rCMRgl reduction within the hippocampus and basal frontal cortex of the EOAD patients carrying the E4 allele with respect to all other subgroups (fig 2). To our knowledge, only the study by Hirono et al24 investigated the relationship between ApoE and age at AD onset, although the authors did not perform the omnibus two way ANOVA but only the within group t tests, so that the onset age by ApoE interaction was not taken into account. Within the EOAD group, lower rCMRgl was found in the MTL, basal frontal cortex, basal ganglia, postcentral gyri, and medial occipital cortex for the ApoE E4 homozygotes as compared to the ApoE E3 homozygotes. Conversely, the ApoE4 homozygotes had relatively higher rCMRgl in the temporal and inferior parietal cortex as compared to the ApoE3 homozygotes.24 Moreover, no significant rCMRgl difference was found between ApoE4 and Apoe3 homozygotes in the LOAD group.24
With respect to the above mentioned study, we performed a standard two way ANOVA also including ApoE4 heterozygote patients, since previous studies showed that one E4 allele copy is sufficient to carry rCMRgl dysfunctions.17,18 Only results from the present post hoc t tests could be compared to those of Hirono and colleagues,24 confirming that EOAD patients carrying the ApoE4 genotype have MTL rCMRgl reductions with respect to the non-carriers, and additionally providing evidence of a significant interaction driven by the EOAD carriers of the E4 allele. However, the finding of higher rCMRgl for the EOAD E4 carriers as compared to the non-carriers was not replicated, possibly because of clinical differences between the AD samples investigated, since we focused on very mild AD. However, taken together these studies underline that the E4 allele affects brain metabolism of the EOAD patients with a major impact within the MTL structures. These findings are in accordance with the BRC hypothesis2 and further suggest that ApoE4 effects may be particularly disruptive to brain metabolism in the brain areas characterised for the major load of synaptic plasticity. Indeed, neuropathological studies showed that the hippocampal formation and basal frontal cortex, together with the entorhinal cortex, are the areas affected earliest and most severely by the deposition of NFT46 and synapse loss.47 Such greater damage may determine the demand for more frequent reparative interventions by cellular agents involved with cerebral neuroplasticity, such as ApoE.21 Since the ApoE E4 allele is not very effective for this purpose, then its interaction with already decreased BRC could be particularly disruptive to brain metabolism in the regions characterised by reduced resistance against advancing AD pathophysiology. This assumption is consistent with the study by Borenstein Graves and colleagues48 who showed that carriers of the E4 allele and with smaller head circumference, an indirect index of brain size and thus of BRC, are at higher risk for earlier onset of AD.
The present findings are also compatible with MRI studies showing that the effect of the E4 allele is region specific and particularly evident in the hippocampus where the ApoE4 genotype was associated with greater atrophy.15,16 Since a correction for atrophy was not performed in this study, the present results could represent either pronounced metabolic dysfunction or the combined effects of hypometabolism and atrophy. However, studies that have performed voxel based atrophy correction of resting glucose metabolism reported a relative independence of metabolic measurements from brain atrophy.49
It is also worthwhile mentioning that the association between ApoE genotype and the histopathological markers of AD is far from being conclusive. Neuronal damage and cell death in AD seem to be secondary to the pathological convergence of neurofibrillary tangles (NFT) and extra-cellular and vascular amyloid deposits, and lipid peroxidation.50 Several postmortem studies have reported that amyloid plaque density is correlated to the ApoE genotype in a dosage dependent manner, with E4 homozygous subjects having significantly increased plaque density as compared to E3/E4 and E3/E3 patients.47,51 Moreover, the E4 allele has been related to a more severe loss of cholinergic innervation in the cortex and hippocampus, another prominent feature of AD.52 However, other groups have failed to confirm such association and studies seeking a relationship between NFT density and ApoE are even less conclusive (for a review, see Poirier et al51).
On the other hand, neuronal loss, density of NFT and neuritic plaques, and brain atrophy appear to be greater in early than late onset AD, irrespective of the ApoE status.53–56
Other studies are thus needed to clarify whether the present findings of reduced rCMRgl in patients with early disease onset and carriers of the E4 allele may be attributable to more severe AD histopathology. For purposes of discussion, while it is speculative to assume that the CMRgl abnormalities detected in this study reflect the histopathology of AD, our results are consistent with the hypothesis of an E4 related increased vulnerability to pathology within certain brain structures. ApoE is believed to play a role in the repair of damaged neurons, in response to both brain insults and normal cellular detriment due to the ageing process.51 It has been hypothesised that genetic factors such as the E4 allele, increase the burden of neuroplasticity by accelerating the temporal course of events that lead to AD.57 Such plasticity failure may be more pronounced within small brain regions which subserve a major load of synaptic activity (that is, the hippocampus)57 and further studies are needed to address this issue, possibly combining brain imaging with biomarkers for AD.
In addition, it should be noted that none of the EOAD patients had mutations of the APP, PS-1, and PS-2 genes and the ApoE allelic distribution was balanced between EOAD and LOAD. Although a higher number of patients with a positive familial history of AD would be expected in the EOAD group, we found no significant difference between groups in the frequency of this variable. Overall, these findings support the hypothesis that the interaction of additional genetic or epigenetic risk factors may contribute to an early onset of disease, and possibly of individual factors leading to greater or lower resistance against advancing brain damage. Indeed, future studies should assess the specific impact of other possible BRC modifying factors, such as educational level58,59 and a positive family history for AD,60 on the interaction structure.
Lastly, from a neuropsychological perspective, the present findings suggest that EOAD ApoE4 carriers could have the most severe memory impairment due to the greater hippocampal metabolic dysfunction with respect to the other subgroups. Although in the present study neuropsychological examinations were not available, preliminary support for this hypothesis derives from neuropsychological studies showing that age related memory decline occurs earlier and deteriorates faster in cognitively healthy E4 carriers.61,62 In this regard it should also be underlined that a distinction exists between brain reserve and cognitive reserve theories, in that the former relies on a more biological basis (in the form of synapse availability) while the latter mainly refers to cognitive strategies and compensatory skills used to deal with advancing brain damage and could thus be better assessed by activation studies (for a review, see Stern2). In this resting FDG-PET study we were interested in assessing whether the ApoE4 allele potentiates rCMRgl impairment in the presence of a lower brain reserve, which is a “biological” interaction. Future studies are required to investigate whether such interactive effects on brain physiology also lead to behavioral abnormalities.
It should also be emphasised that the ApoE genotypes of control subjects were not available in the present study, although comparison of the AD group to the controls was carried out only to confirm the presence of the typical AD hypometabolism and was not the main interest here. Nonetheless, the presence of the E4 allele among the controls, which previous studies have demonstrated as being associated with metabolic reductions in healthy subjects as well as AD patients,17,18 may have led to an underestimation of the severity of rCMRgl reductions in the AD groups.
Moreover, pixel counts were normalised to mean global activity to obtain relative metabolic values from FDG radioactivity measurements. This procedure may lead to the underestimation of metabolic reductions in more severe cases. It is also likely that normalisation to brain regions that are thought to be relatively preserved in AD (that is, primary motor cortex, pons, or cerebellum27) instead of to the mean activity, may improve the detection of glucose abnormalities, provided that voxel counts within such reference regions are extracted using an MRI guided approach. Future studies, and mainly using quantitative glucose sampling, are thus needed to assess whether cortical and limbic rCMRgl reductions are actually even greater than those found in the present study.
Lastly, a possible limitation of the present study relies on the fact that results were assessed at a probability level of p<0.001, uncorrected for multiple comparisons. Such a threshold was chosen because we had an a priori hypothesis as to the brain areas of expected activation in the statistical parametric maps and were restricting our interest to a subset of brain regions.35,36 Correcting for the entire brain volume would have been too conservative in such a case, with the risk of not detecting significant results within small areas, such as the hippocampi. Although prior published studies with SPM largely adopted the same strategy,17,18,20,24 the use of an uncorrected threshold may not fully protect against results due to chance, that is results may be prone to type I error (false positive), and the present results need to be replicated in order to assess their validity.
In conclusion, the present FDG-PET study demonstrates that the ApoE genotype and the age at AD onset interact in their effect on brain metabolism in specific brain areas characterised by the major burden of brain damage and therefore reparative demands against advancing AD pathology. Overall, it emerges from the above results that the deteriorating factors examined in this study (age and ApoE E4 genotype) may induce regional modifications in critical brain structures rather than disrupting global BRC functioning. The finding of a greater metabolic dysfunction, reflecting synapse loss, for EOAD carriers of the ApoE4 allele adds support to the BRC hypothesis.
Acknowledgments
The authors gratefully acknowledge Drs E Salmon and V Holthoff for kindly providing part of the database of healthy controls. We would like to thank Drs A Tedde, E Cellini, and S Bagnoli for their contribution in genetic assessments, and Drs A Passeri and G Comis for their assistance.
REFERENCES
Footnotes
-
This study was conducted to comply with the Network for Efficiency and Standardization of Dementia Diagnosis (NEST-DD) with support from the European Commission (Framework V; European Union grants QLK-6-CT-1999-02178 and QLK-6-CT-1999-02112). Work at Florence was also supported by the Ministero dell’Università e della Ricerca Scientifica e Tecnologica (MURST), and by Regione Toscana, Progetto MINISTERO della SANITA, “Diagnosi Tempestiva e Differenziale della Malattia di Alzheimer. Uso delle Tecnologie avanzate”.
-
Competing interests: none declared