


Abstract
In contrast with the Parkinson's-like effects associated with the mitochondrial neurotoxin N-methyl-4-phenyl-1,2,3,6-tetrahydropyridine (MPTP) and the neuroleptic agent haloperidol, there exist no reports on adverse central nervous system (CNS) effects with the structurally related N-substituted-4-arylpiperidin-4-ol derivative and antidiarrheal agent loperamide. Although this difference can be attributed to loperamide's P-glycoprotein substrate properties that prevent it from accessing the brain, an alternative possibility is that loperamide metabolism in humans is different from that of MPTP and haloperidol and does not involve bioactivation to a neurotoxic pyridinium species. In the current study, loperamide bioactivation was examined with particular focus on identification of pyridinium metabolites. A NADPH-dependent disappearance of loperamide was observed in both rat and human liver microsomes (human t1/2 = 13 min; rat t1/2 = 22 min). Loperamide metabolism was similar in human and rat and involved N-dealkylation to N-desmethylloperamide (M3) as the principal metabolic fate. Other routes of loperamide biotransformation included N- and C-hydroxylation to the loperamide-N-oxide (M4) and carbinolamide (M2) metabolites, respectively. Furthermore, the formation of an additional metabolite (M5) was also discernible in human and rat liver microsomes. The structure of M5 was assigned to the pyridinium species (LPP+) based on comparison of the liquid chromatography/tandem mass spectrometry characteristics to the pyridinium obtained from loperamide via a chemical reaction. Loperamide metabolism in human microsomes was sensitive to ketoconazole and bupropion treatment, suggesting P4503A4 and -2B6 involvement. Recombinant P4503A4 catalyzed all of the loperamide biotransformation pathways in human liver microsomes, whereas P4502B6 was only responsible for N-dealkylation and N-oxidation routes. The wide safety margin of loperamide (compared with MPTP and haloperidol) despite metabolism to a potentially neurotoxic pyridinium species likely stems from a combination of factors that include a therapeutic regimen normally restricted to a few days and the fact that loperamide and perhaps LPP+ are P-glycoprotein substrates and are denied entry into the CNS. The differences in safety profile of haloperidol and loperamide despite a common bioactivation event supports the notion that not all compounds undergoing bioactivation in vitro will necessarily elicit a toxicological response in vivo.
Circumstantial evidence suggests that bioactivation of inert functional groups within drug substances is the rate-limiting step in the etiology of some adverse drug reactions (Uetrecht, 2003). For instance, there are myriad examples in the literature of hepatotoxic drugs for which bioactivation mechanisms have been proposed (Evans et al., 2004). These literature reports often recommend that functional groups that have been associated with bioactivation in the past should potentially be avoided in future drug design efforts.
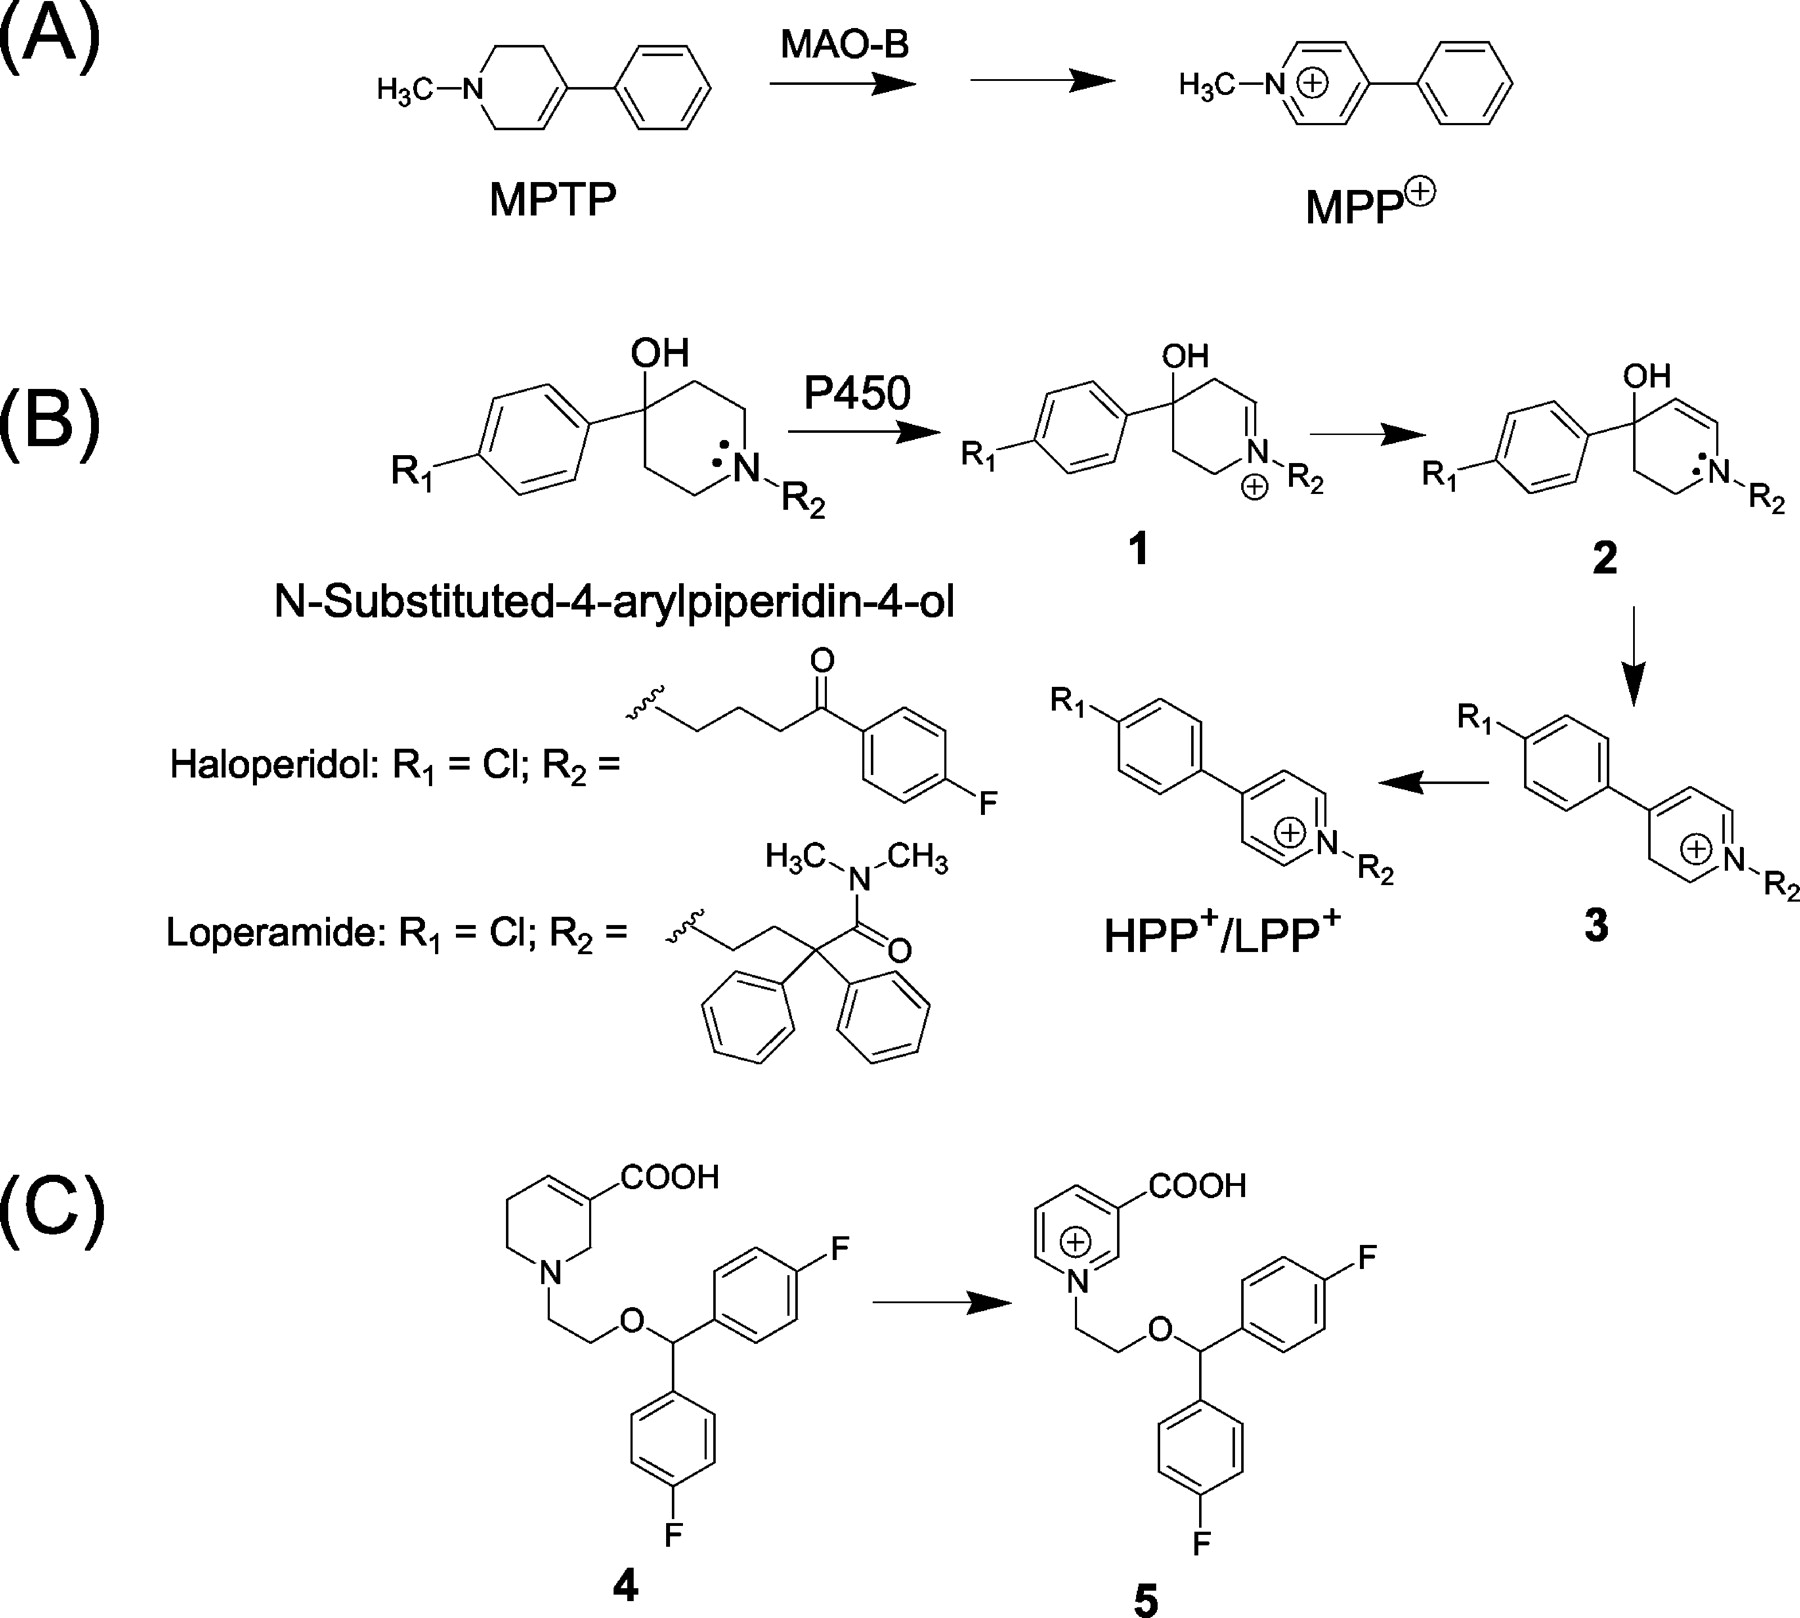
One such structural motif that is categorized in the list of potential toxicophores/structural alerts is the N-substituted-4-arylpiperidin-4-ol template (Fig. 1). This dubious distinction stems from reports on the bioactivation of this cyclic tertiary amine system to the corresponding N-alkyl-4-phenylpyridinium species, which structurally resembles the mitochondrial neurotoxin N-methyl-4-phenylpyridinium (MPP+) derived from the monoamine oxidase-B-catalyzed oxidation of the parkinsonian agent N-methyl-4-phenyl-1,2,3,6-tetrahydropyridine (MPTP) (Fig. 1A) (Chiba et al., 1984; Trevor et al., 1987). This is exemplified with the N-substituted-4-arylpiperidin-4-ol-containing neuroleptic agent 4-(4-chlorophenyl)-1-[4-(4-fluorophenyl)-4-oxobutyl]-4-piperidinol (haloperidol), widely used in the treatment of schizophrenia. Patients treated with haloperidol often experience extrapyramidal side effects including acute dystonic reactions and parkinsonism and, following chronic treatment, tardive dyskinesia that, in many cases, is irreversible (Tarcy and Baldessarini, 1986). The occurrence of some of these adverse events has been linked to the bioactivation of the piperidin-4-ol moiety in haloperidol to the corresponding 4-(4-chlorophenyl)-1-[4-(4-fluorophenyl)-4-oxobutyl]-pyridinium (HPP+) species via a reaction sequence involving initial P450-mediated formation of the cyclic iminium species 1 which, via the free base amino enol 2, can undergo rapid conversion to the 4-(4-chlorophenyl)-1-[4-(4-fluorophenyl)-4-oxobutyl]-2,3-dihydropyridinium (HPDP+, 3). Subsequent oxidation of HPDP+ generates HPP+ (Fig. 1B) (Subramanyam et al., 1991a; Usuki et al., 1996). Additional circumstantial evidence for HPP+ involvement in the neurotoxic complications include: 1) HPP+ detection in the urine and brain (postmortem) samples from patients who have undergone haloperidol treatment (Subramanyam et al., 1991b; Eyles et al., 1994, 1997), 2) HPP+ toxicity to dopaminergic and serotonergic mesencephalic cells present in cultures derived from rat embryos (Bloomquist et al., 1994) and to cultured dopaminergic neuroblastoma cells (Fang et al., 1995), 3) inhibition of radiolabeled dopamine uptake by brain preparations treated with HPP+ (Fang and Yu, 1995), and 4) the fact that, like MPP+ (Nicklas et al., 1985), HPP+ is a potent inhibitor of complex I of the mitochondrial respiratory chain (Bloomquist et al., 1994; Rollema et al., 1994; Fang et al., 1995). Compromised mitochondrial energy production is considered to be a potentially important link between Parkinson's disease and extrapyramidal disorders (Beal, 1995). Finally, the 1,2,3,6-tetrahydropyridine carboxylic acid-based anticonvulsant agent 4 (Fig. 1C), which demonstrated Parkinson's-like effects after administration of a single 25-mg dose to humans, provides an additional example of the causal link between neurotoxicity and pyridinium metabolites because the corresponding pyridinium species 5 was characterized as the major urinary metabolite of 4 in humans (Radulovic et al., 1993).

Bioactivation of N-substituted-4-arylpiperidin-4-ol derivatives to the potentially neurotoxic N-alkyl-4-arylpyridinium species.
Of significant interest in this context, then, is the lack of adverse CNS effects with the structurally related N-substituted-4-arylpiperidin-4-ol derivative 4-(4-chlorophenyl)-4-hydroxy-N,N-dimethyl-α,α-diphenyl-1-piperidine-butyramide (loperamide). Loperamide is available by prescription (Imodium) and over the counter (Imodium A-D) and has opiate activity that is normally restricted to the gastrointestinal tract, making it an effective therapy for diarrheal illnesses (Sherman and Fish, 2000). A likely explanation for the lack of CNS toxicity of loperamide as opposed to MPTP and haloperidol is the well established P-glycoprotein substrate properties of loperamide that restrict brain penetration and prevent bioactivation of this drug in the brain (Mahar Doan et al., 2002; Wandel et al., 2002). This proposal also aids in explaining the absence of central opiate effects of loperamide. An alternate possibility is that the metabolic fate of loperamide in humans is different from that of haloperidol and does not involve bioactivation to the corresponding 4-(4-chlorophenyl)-N,N-dimethyl-α,α-diphenyl-1-pyridinium-butyramide (LPP+) species via the pathway depicted in Fig. 1. The latter hypothesis is supported by the observations that the principal metabolic fate of loperamide in humans involves oxidative N-dealkylation of the tertiary amide group to the corresponding secondary amide metabolite (Heykants et al., 1974; Lavrijsen et al., 1995). Since the potential for LPP+ formation from loperamide in humans is unknown, the purpose of the present study was to examine metabolism of loperamide in human liver microsomes with focus on characterization of biotransformation pathways involving LPP+ formation. For comparative purposes, the metabolism of loperamide was also examined in rat liver microsomes. Additional studies on the characterization of the drug-metabolizing enzymes involved in loperamide metabolism were also conducted since this information is not available in the primary literature.
Materials and Methods
Materials. Haloperidol freebase and loperamide hydrochloride salt were purchased from Sigma-Aldrich (St. Louis, MO). All chemicals and solvents were purchased from Aldrich Chemical Co. (Milwaukee, WI). 1H NMR spectra in CDCl3 or DMSO-d6 were recorded on a Varian Unity M-400 MHz spectrometer (Varian, Inc., Palo Alto, CA); chemical shifts are expressed in parts per million (ppm; δ) calibrated to the deuterium lock signal for CDCl3 or DMSO-d6. Spin multiplicities are given as s (singlet), d (doublet), and m (multiplet). Positive ion electrospray ionization and collision-induced dissociation (CID) mass spectra were obtained on a Sciex API model 2000 triple quadrupole mass spectrometer (Applied Biosystems/MDS Sciex, Foster City, CA).
Synthesis of m-Chlorobenzoate Salt of Loperamide-N-Oxide. To a solution of loperamide hydrochloride salt (0.25 g, 0.5 mmol) in anhydrous methanol (5 ml) was added tetramethylammonium carbonate-3 (SiliCycle, Quebec City, QC, Canada) (1.26 g, 1 mmol), and this suspension was stirred under argon for 5 h. The suspension was filtered and the solvent evaporated under reduced pressure to afford loperamide freebase. A reaction mixture containing loperamide freebase (100 mg, 0.2 mmol) and m-chloroperoxybenzoic acid (70%, 100 mg, 0.4 mmol) in 5 ml of anhydrous methylene chloride was stirred at 25°C for 12 h. The solvent was removed under reduced pressure and the residue crystallized from acetone/diethyl ether to afford 41 mg (32%) of loperamide-N-oxide as its m-chlorobenzoate salt. 1H NMR (DMSO-d6) δ 7.78 (m, 2H, ArH), 7.24-7.76 (m, 16H, ArH), 3.49-3.51 (d, 2H, CH2), 3.30-3.32 (d, 2H, CH2), 3.17 (d, 2H, CH2), 2.87 (s, 3H, CH3), 2.71-2.73 (d, 2H, CH2), 2.38-2.42 (m, 2H, CH2), 2.19 (s, 3H, CH3), 1.58-1.61 (d, 2H, CH2). Electrospray ionization analysis in the positive ion mode revealed a single peak [retention time (Rt) = 14.86 min] with a molecular ion at 493 and base fragment ion at 266.
Chemical Conversion of Loperamide-N-Oxide to LPP+ To a solution of loperamide-N-oxide in the m-chlorobenzoate salt form (10 mg) in 2 ml of anhydrous methylene chloride was added trifluoroacetic anhydride (20 μl) in 5 ml of anhydrous methylene chloride at 0°C. After stirring at 0°C for 1 h, the solvent was removed under reduced pressure, and the residue was dissolved in 2 ml of anhydrous methanol and treated with 10% Pd-C (10 mg). This mixture was stirred at room temperature for 24 h. The reaction was filtered through celite and the solvent was removed under reduced pressure. The crude residue was examined for LPP+ formation by liquid chromatography/tandem mass spectrometry (LC-MS/MS).
Enzymology. Microsomal fractions were prepared from male Sprague-Dawley rats (pool of 10-15 livers) (Charles River Laboratories, Inc., Wilmington, MA) and human livers (International Institute for the Advancement of Medicine, Exton, PA) using standard procedures. Protein concentrations were determined using the bicinchoninic acid assay method (Pierce Chemical, Rockford, IL). Total P450 content was measured according to published protocols (Omura and Sato, 1964), and human liver microsomes were characterized using P450-specific marker substrate activities. Human liver microsomes were isolated from 56 individual livers, and aliquots from the individual preparations were pooled on the basis of equivalent protein concentrations to yield a representative microsomal pool. Ketoconazole, bupropion, sulfaphenazole, quinidine, ticlopidine, and NADPH were obtained from Sigma-Aldrich. Furafylline and recombinant human P450 isozymes, coexpressed with NADPH-P450 oxidoreductase in baculovirus-insect cells, were purchased from BD Gentest (Woburn, MA).
Incubations with Liver Microsomes.Microsomal stability. Loperamide stock solutions were prepared in methanol. The final concentration of methanol in the incubation media was 0.2% (v/v). Loperamide t1/2 in microsomes was determined in triplicate after its incubation (1 μM) with rat or human liver microsomes (P450 concentration, 0.25 μM) in 0.1 M potassium phosphate buffer (pH 7.4) at 37°C. The total incubation volume was 0.6 ml. The reaction mixture was prewarmed at 37°C for 2 min before adding NADPH (1.2 mM). Aliquots (75 μl) of the reaction mixture at 0, 5, 15, and 30 min (time period associated with reaction linearity) were added to acetonitrile (200 μl) containing haloperidol (0.05 μg/ml) as internal standard, and the samples were centrifuged at 2500g for 5 min before LC-MS/MS analysis of loperamide disappearance. For control experiments, NADPH and/or liver microsomes were omitted from these incubations.
Metabolite identification. For the purposes of metabolite identification studies, the concentration of loperamide in the microsomal incubations was raised to 20 μM and that of P450 in rat and human liver microsomes was raised to 0.5 μM. The duration of the incubation was increased from 30 min to 45 min. After quenching the incubation mixtures with 2 volumes of acetonitrile, the solutions were centrifuged (3000g, 15 min) and the supernatants were dried under a steady nitrogen stream. The residue was reconstituted with mobile phase and analyzed for metabolite formation by LC-MS/MS. Chemical reduction of the enzymatic LPP+ to the corresponding 1,2,3,6-tetrahydropyridine was performed by treatment of the supernatants from loperamide-human liver microsomal incubations with sodium borohydride (1 mg) for 10 min before LC-MS/MS analysis.
Identification of the Human P450 Isozymes Responsible for Loperamide Metabolism.Chemical inhibition studies. For the mechanism-based inhibition studies on P4501A2, human liver microsomes (P450 concentration = 0.25 μM) were preincubated with NADPH (final concentration, 1.2 mM) at 37°C in the presence of the P4501A2 inactivator furafylline at a final concentration of 20 μM for 10 min. Loperamide (final concentration, 1 μM) in methanol was then added, and the reaction mixture was further incubated for 30 min at 37°C. For competitive P450 inhibition studies, human liver microsomes (P450 concentration, 0.25 μM) were incubated with loperamide (1 μM), NADPH (1.2 mM), a P450 inhibitor, quinidine at a final concentration of 1 μM (P4502D6), sulfaphenazole at a final concentration of 5 μM (P4502C9), ticlopidine at a final concentration of 10 μM (P4502C19), bupropion at a final concentration of 150 μM (P4502B6), and ketoconazole at a final concentration of 2 μM (P4503A4/5) for 30 min at 37°C. Incubations were conducted in duplicate. The final concentration of methanol in the incubation media was 0.2% (v/v), and the total incubation volume was 0.6 ml. Periodically (0-30 min), aliquots (75 μl) of the reaction mixture were added to acetonitrile (200 μl) containing haloperidol (0.05 μg/ml) as internal standard, and the samples were centrifuged at 2500g for 5 min and then analyzed for loperamide disappearance.
Metabolism by heterologously expressed P450 isozymes. Loperamide (final concentration, 1 μM) in methanol was incubated with microsomes from cells containing human recombinant P450s 1A2, 2B6, 2C9, 2C19, 2D6, 3A4, and 3A5 (P450 concentration, 0.01 μM) in the presence of NADPH (1.2 mM) at 37°C. Reactions were conducted in 0.1 M potassium phosphate buffer (pH 7.4) and were prewarmed at 37°C for 2 min before the addition of NADPH. All incubations were conducted in triplicate. The final concentration of methanol in the incubation media was 0.2% (v/v), and the total incubation volume was 0.6 ml. Periodically (0-30 min), aliquots (75 μl) of the reaction mixture were added to acetonitrile (200 μl) containing haloperidol (0.05 μg/ml) as internal standard, and the samples were centrifuged at 2500g for 5 min and analyzed for loperamide disappearance. For the purposes of metabolite identification studies, the concentration of loperamide in the recombinant P450 incubations was raised to 20 μM and the duration of the incubation was increased from 30 min to 45 min.
Data Analysis. For t1/2 determinations in loperamide depletion experiments, loperamide/internal standard peak height ratios were determined and normalized to the value obtained at time t = 0. The percentage of loperamide remaining versus time was fitted to first-order decay functions to yield in vitro t1/2 values. If loperamide demonstrated nonlinearity on log percentage remaining versus time curves, only those initial time points wherein log-linearity was observed were used to determine t1/2 values.
LC-MS/MS Analysis. Loperamide depletion was monitored on a Sciex API model 3000 LC-MS/MS triple quadrupole mass spectrometer. Analytes were chromatographically separated using a Hewlett Packard Series 1100 HPLC system (Hewlett Packard, Palo Alto, CA). An autosampler was programmed to inject 20 μl on a Phenomenex Primesphere 5-μm C18-HC 30 × 2.0 mm column (Phenomenex, Torrance, CA) using a mobile phase consisting of 10 mM ammonium acetate buffer/acetonitrile (60:40 v/v) containing 0.2% (v/v) triethylamine and 0.1% (v/v) acetic acid at a flow rate varying from 1 to 1.5 ml/min. Ionization was conducted in the positive ion mode at the ionspray interface temperature of 400°C, using nitrogen for nebulizing and heating gas. The ionspray voltage was 5.0 kV and the orifice voltage was optimized at 30 eV. Loperamide and haloperidol were analyzed in the multiple reaction monitoring mode (loperamide: m/z 477 → 266; haloperidol: 376 → 165).
Metabolite identification. Qualitative assessments of loperamide metabolism were conducted on a Sciex API model 2000 LC-MS/MS triple quadrupole mass spectrometer in conjunction with an LDC Analytical SpectroMonitor 3200 variable-wavelength UV detector. Analytes were chromatographically separated using a Hewlett Packard Series 1100 HPLC system. An autosampler was programmed to inject 50 μl of the sample on a Zorbax Rx-C8 4.6 × 150 mm column using a binary gradient consisting of a mixture of 10 mM ammonium formate, 0.1% formic acid (solvent A) and acetonitrile (solvent B) at a flow rate of 1 ml/min. The LC gradient was programmed as follows: solvent A to solvent B ratio was held at 100:0 (v/v) for 3 min and then adjusted from 100:0 (v/v) to 10:90 (v/v) for 20 min, and from 10:90 (v/v) to 100:0 (v/v) from 20 to 25 min. The column was re-equilibrated for 5 min before the next analytical run. Postcolumn flow was split such that mobile phase was introduced into the mass spectrometer via an ionspray interface at a rate of 50 μl/min. The remaining flow was diverted to the UV detector positioned in-line to provide simultaneous UV detection (λ = 254 nm) and total ion chromatogram. Ionization was conducted in the positive ion mode at the ionspray interface temperature of 150°C, using nitrogen for nebulizing and heating gas. The ionspray voltage was 4.5 kV, and the orifice voltage was optimized at 40 eV. Initial full scans were performed between m/z 50 and m/z 500. Metabolites were identified by comparing t = 0 samples to t = 45 min samples (with or without NADPH cofactor), and structural information was generated from CID spectra of the corresponding protonated molecular ions and/or comparison with synthetic standards.
Results
Human and Rat Liver Microsomal Stability of Loperamide.The microsomal stability of loperamide (final concentration = 1 μM) was assessed by monitoring its degradation following incubation with human and rat liver microsomes in the presence of NADPH cofactor for 30 min at 37°C. In control experiments, NADPH or microsomes were omitted from the incubations. The estimated t1/2 for loperamide disappearance in human and rat liver microsomes in the presence of NADPH was 13 ± 2.5 and 22 ± 3.0 min, respectively. Loperamide was stable in incubations lacking NADPH or liver microsomes from rat and human.
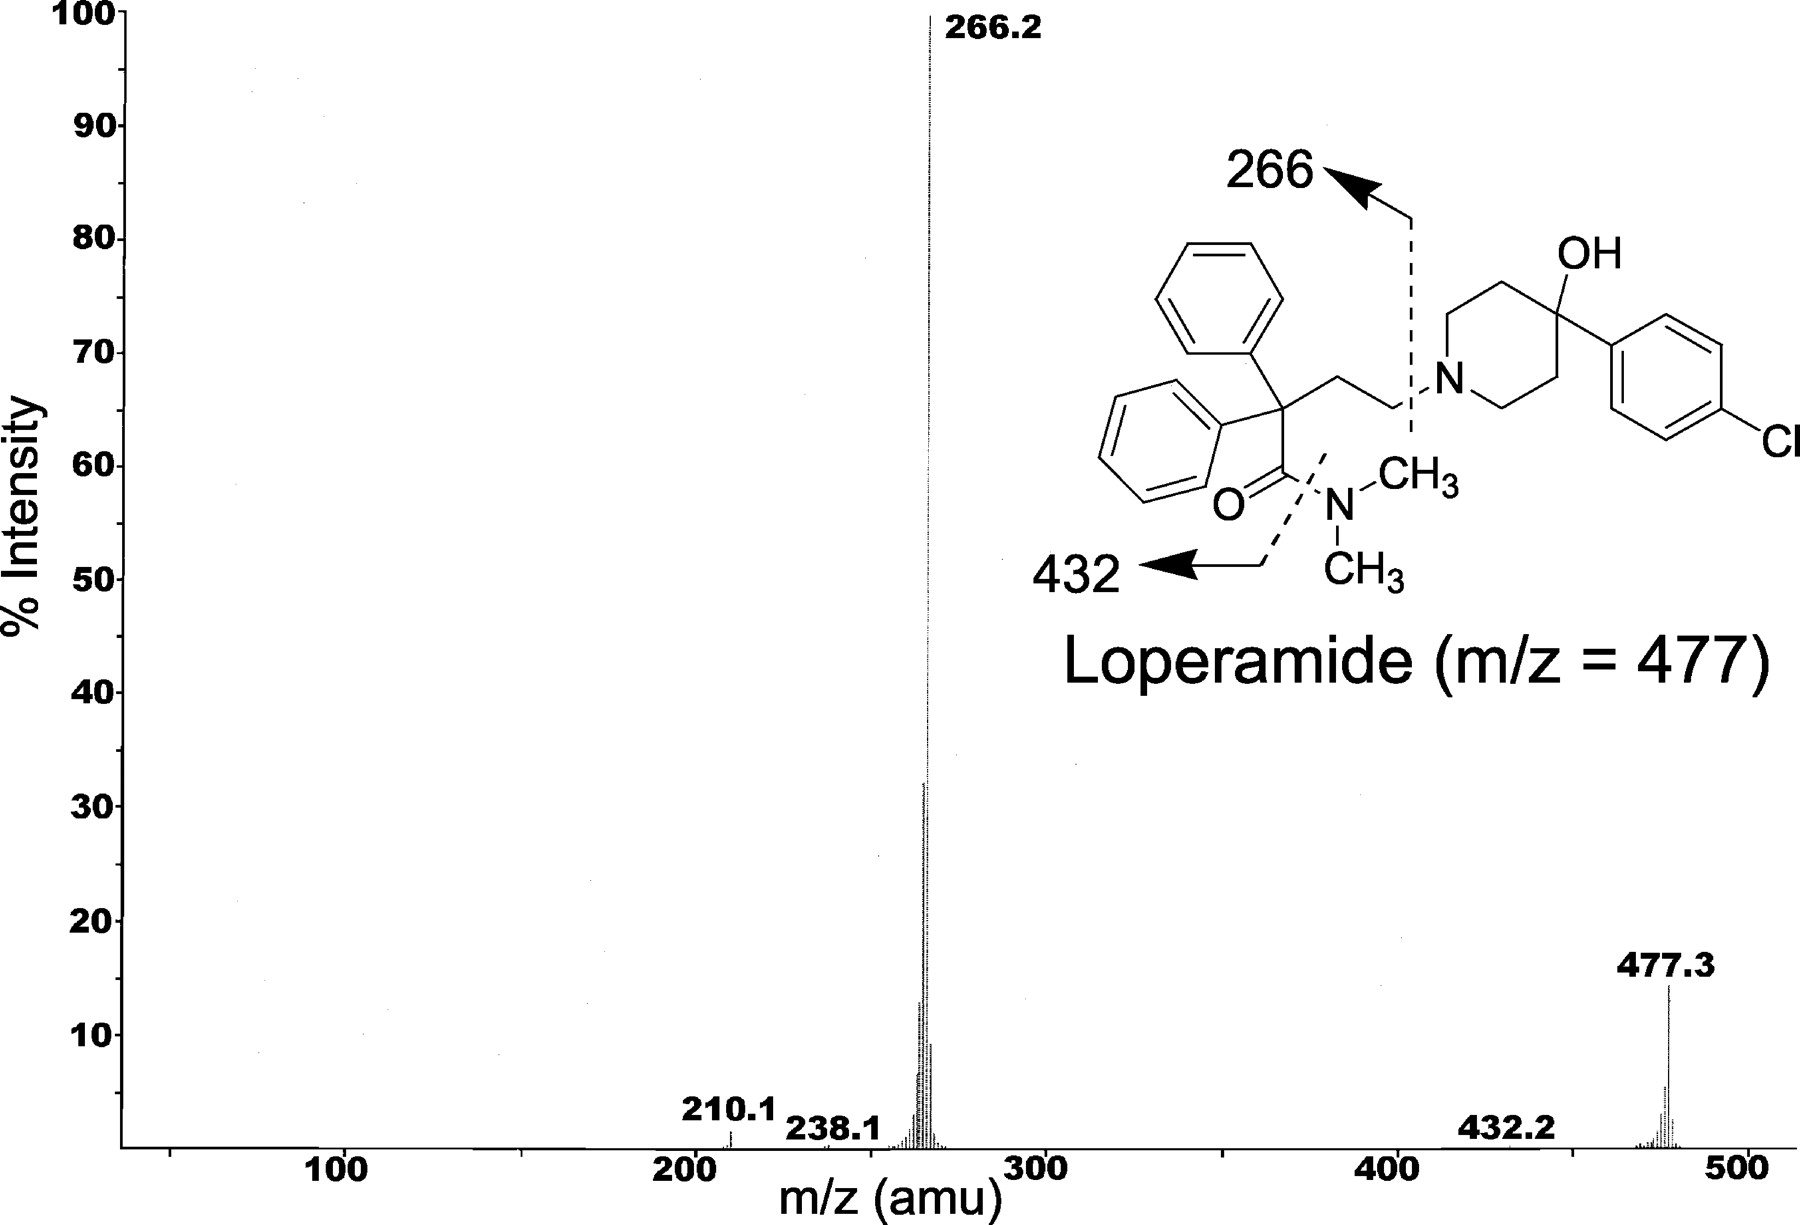
Characterization of Loperamide Metabolites in Human Liver Microsomes. Incubation of loperamide (20 μM) with human liver microsomes revealed the NADPH-dependent formation of several metabolites. The 20 μM concentration of loperamide was used to identify all possible metabolites produced in vitro. LC-MS/MS analysis revealed five peaks, M1, M2, M3, M4, and M5 at Rt = 12.8, 13.4, 13.9, 14.9, and 15.4 min, respectively, that gave protonated molecular ions at m/z 479, 493, 463, 493, and 455 (Fig. 2). Under the present experimental conditions, loperamide eluted at Rt = 14.7 min. The protonated m/z 463 for the dominant metabolite M3 was 14 amu less than m/z 477 (protonated loperamide). The CID spectrum of m/z 463 also indicated a diagnostic fragment ion at m/z 252 that was 14 amu less than the fragment ion at m/z 266 observed in the mass spectrum of loperamide (Fig. 3). Considering that the fragment ion at m/z 266 is associated with the N,N-dimethyl-α,α-diphenylbutyramide substituent, the fragment ion at m/z 252 in the CID spectrum of M3 must correspond to the N-monomethyl-α,α-diphenylbutyramide group. This observation strongly suggests that M3, the major metabolite of loperamide in human liver microsomes, is N-desmethylloperamide. This finding is consistent with previous reports that indicate loperamide N-dealkylation to N-desmethylloperamide as the principal metabolic fate of the drug in humans (Tayrouz et al., 2001).

Total ion chromatogram of an incubation mixture of loperamide (20 μM) in NADPH-supplemented human liver microsomes.

Collision-induced dissociation spectrum of loperamide.
The signals for both M2 and M4 at m/z 493 were 16 amu higher than m/z 477 (the protonated molecular ion of loperamide), suggesting that both M2 and M4 were monohydroxylated metabolites of loperamide. The structure of M4 was established as the corresponding loperamide-N-oxide metabolite based on LC Rt (14.9 min) and mass spectrum (MH+ 493, m/z 266) identical with those of synthetic loperamide-N-oxide. The CID spectrum of the more polar monohydroxylated loperamide metabolite M2 indicated a base fragment ion at m/z 282 that was 16 amu higher than the fragment ion at m/z 266 observed for loperamide. This observation indicated that the site of hydroxylation was on the N,N-dimethyl-α,α-diphenylbutyramide substituent. Additional analysis of the CID spectrum of M2 indicated diagnostic transitions at m/z 493 → 463 and at m/z 282 → 252 that corresponded to the loss of 30 amu in each case. Based on these fragment ions, we propose the structure of M2 to be the corresponding carbinolamide derivative obtained via the P450-mediated hydroxylation of one of the tertiary amide methyl groups (see Fig. 6). The loss of 30 amu from m/z 493 and 282 is consistent with the elimination of formaldehyde (H2C=O) from the N-hydroxymethyl moiety in M2 to afford the corresponding N-desmethylloperamide and N-monomethyl-α,α-diphenylbutyramide ion fragments, respectively. With regard to the general stability of carbinolamide metabolites such as M2, previous studies (Ross et al., 1982; Constantino et al., 1992) have also noted the formation of stable carbinolamide metabolites from the P450-catalyzed biotransformation of aliphatic and aromatic N,N-dimethylamide substituents.
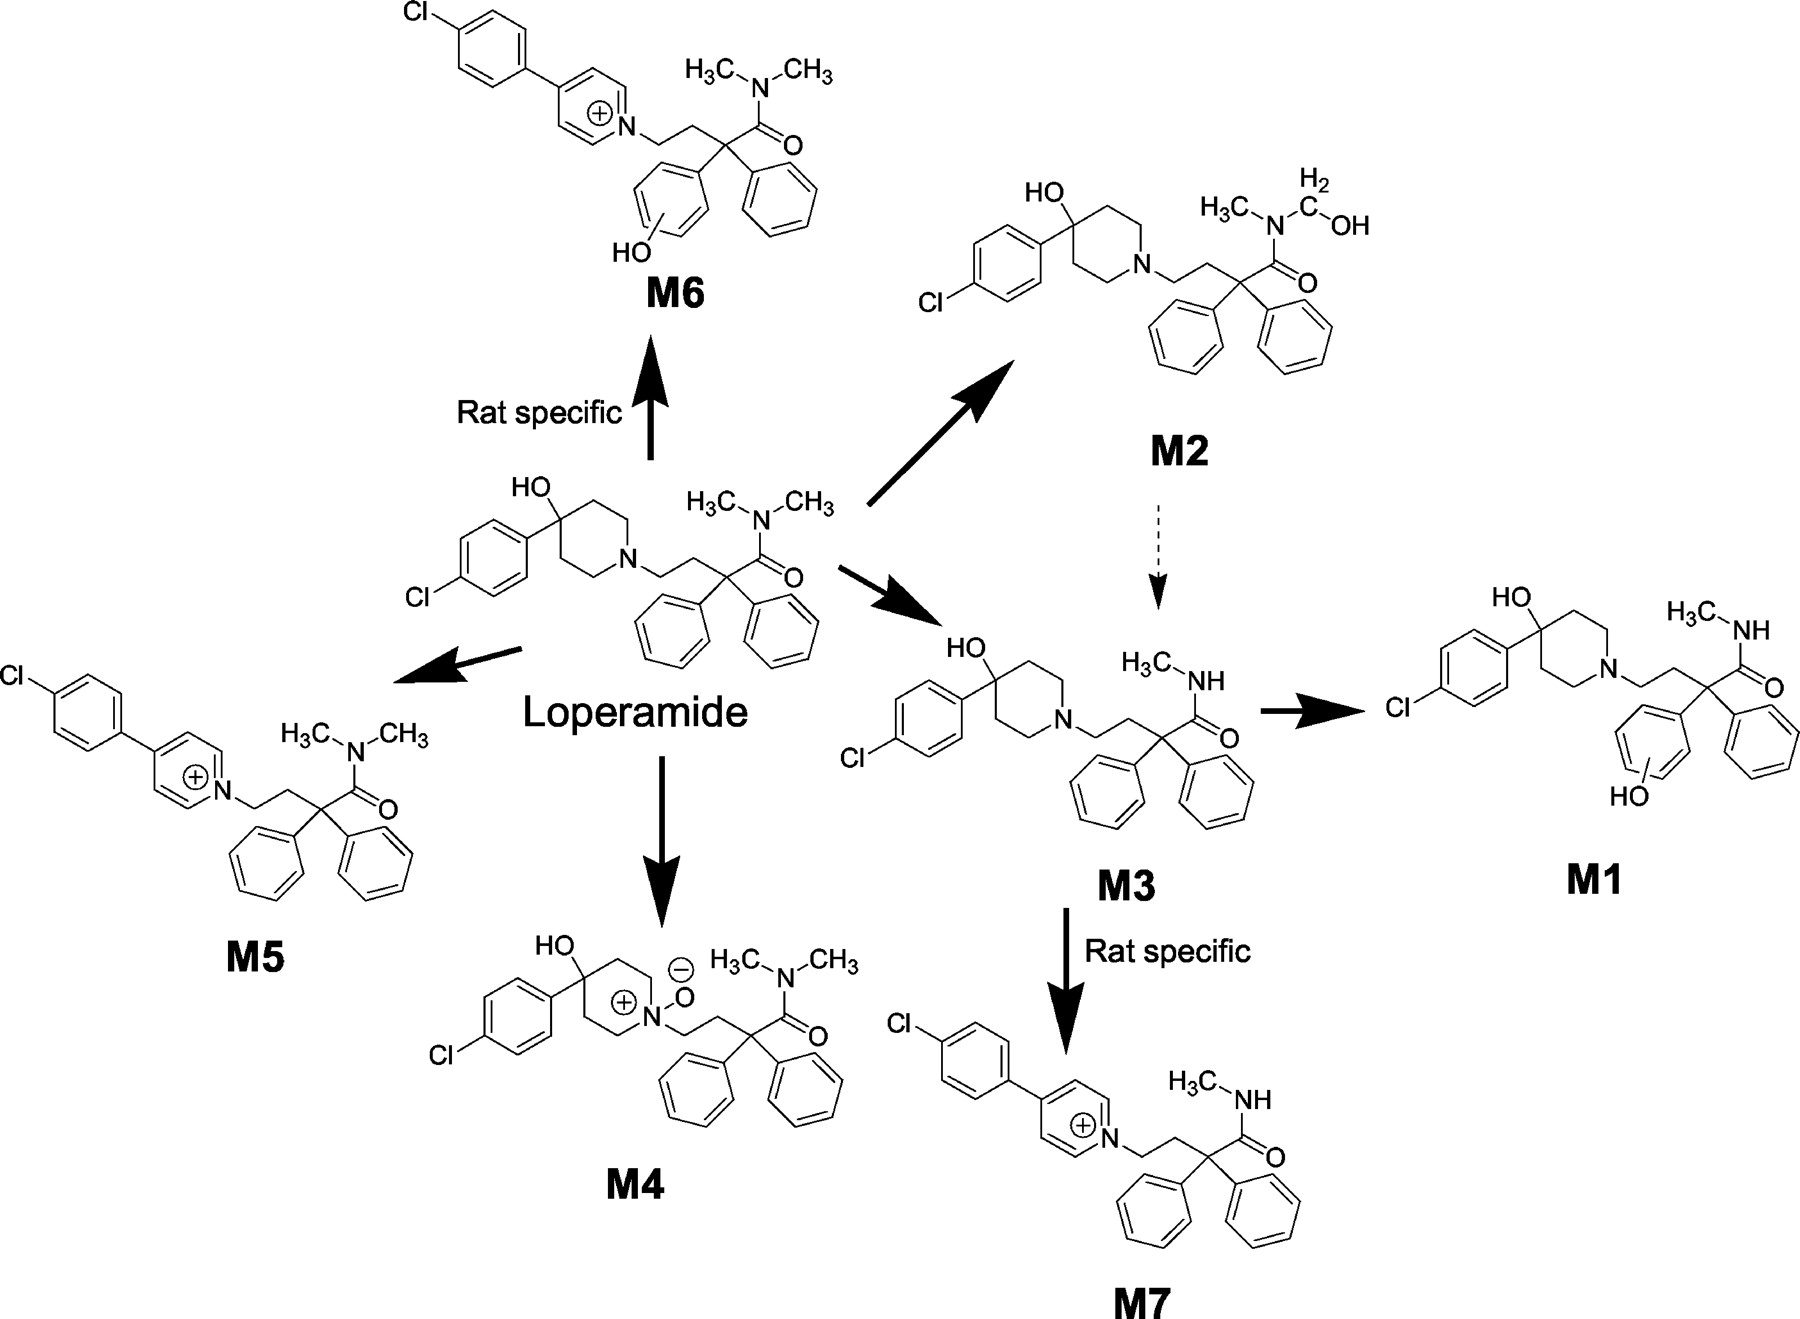
Proposed biotransformation pathways of loperamide in human and rat liver microsomes.
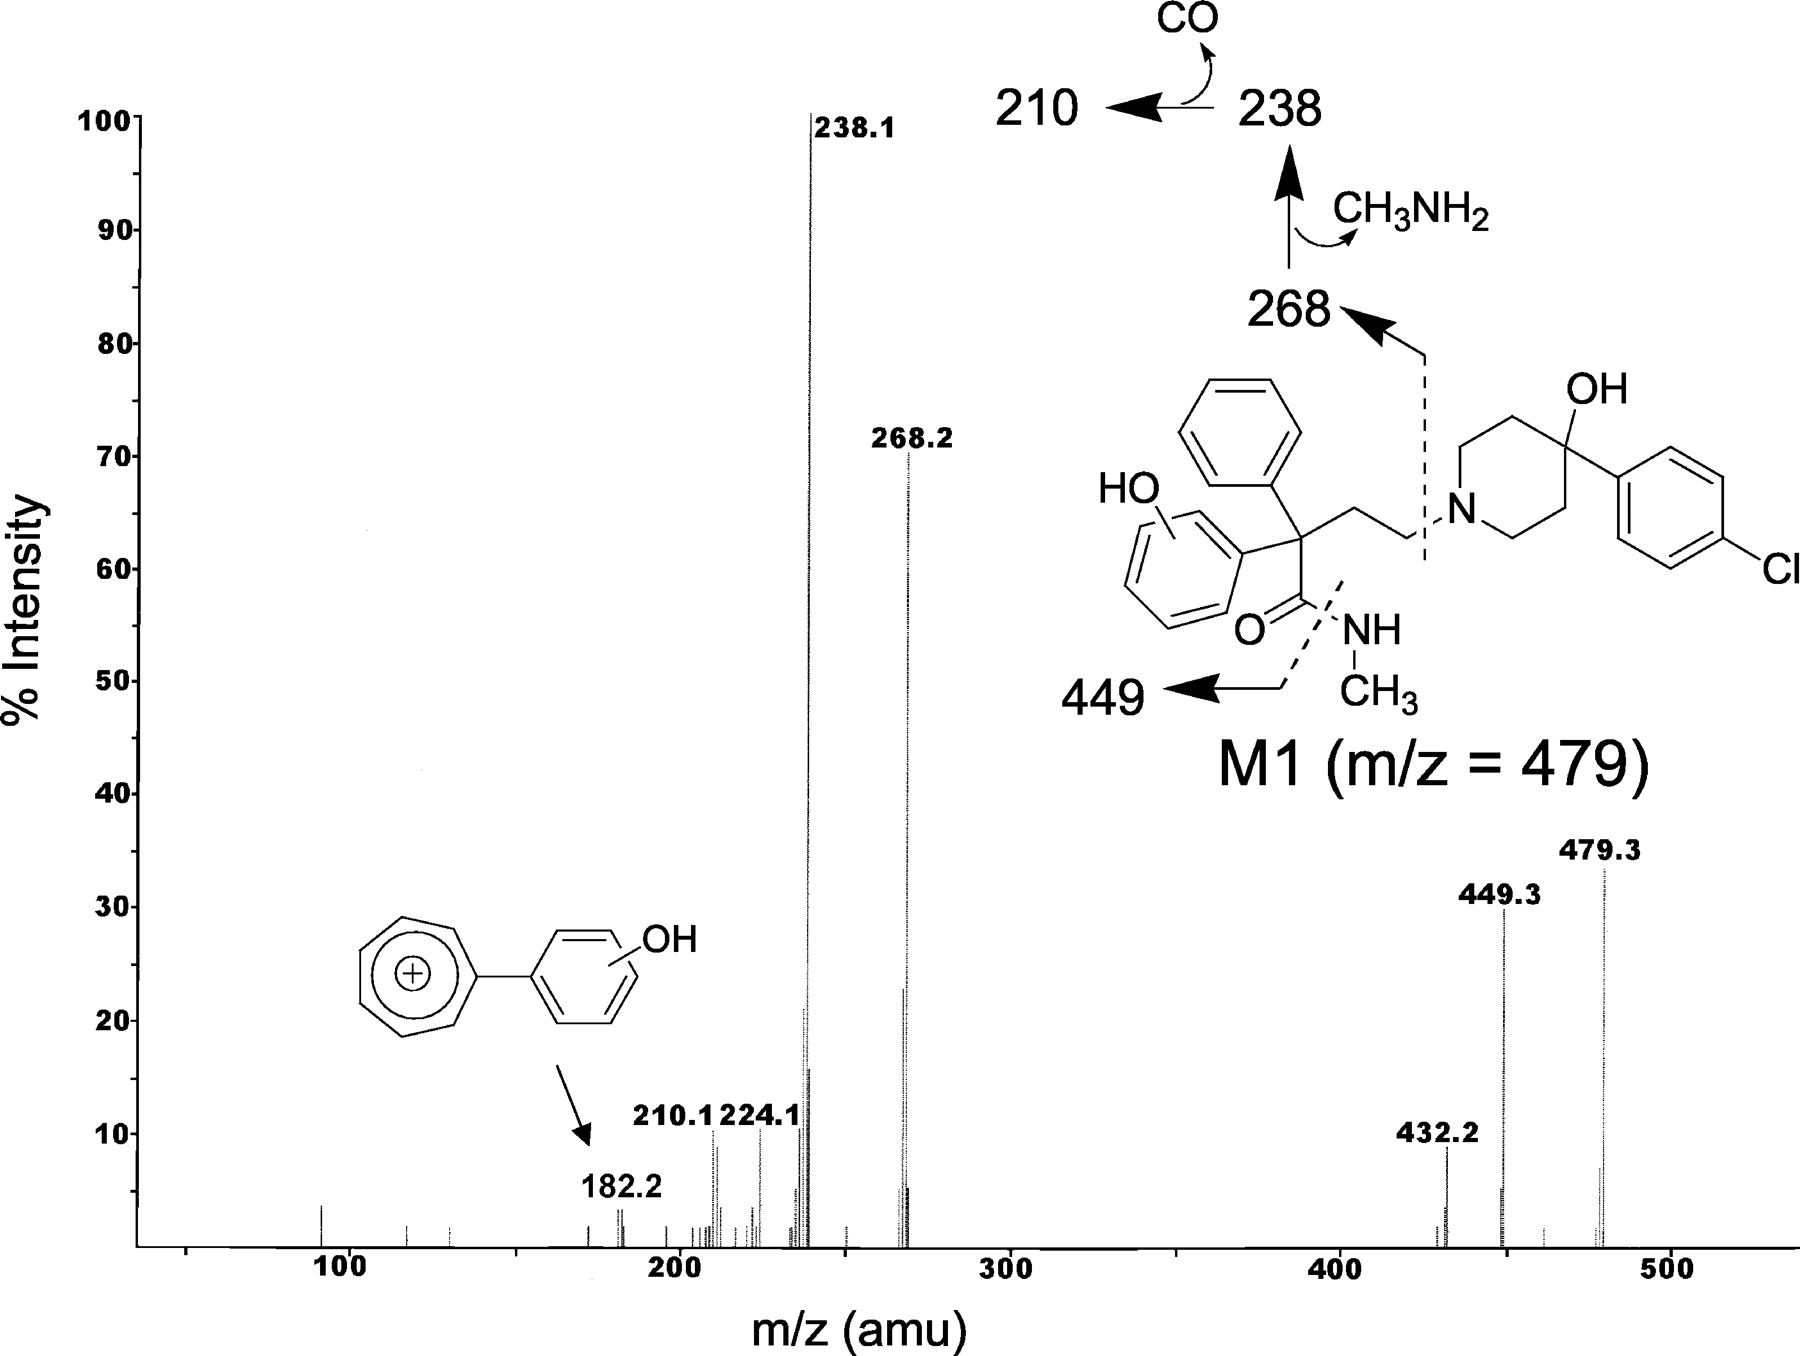
The most polar metabolite (Rt = 12.8 min) of loperamide in the human liver microsomal incubation M1 displayed a protonated molecular ion at m/z 479, 2 amu greater than m/z 477 (protonated loperamide). The CID spectrum of m/z 479 generated fragment ions at m/z 449, 432, 268, 238, 224, 210, and 182 (Fig. 4). The fragment ion at m/z 268 (2 amu greater than the fragment ion at m/z 266 in loperamide) is consistent with N-demethylation (loss of 14 amu)/hydroxylation (addition of 16 amu) on the N,N-dimethyl-α,α-diphenylbutyramide substituent. The fragment ions at m/z 449 and 238 were attributed to the acylium ion obtained after elimination of the methylamine group, whereas the fragment ion at m/z 210 is associated with the loss of CO (see Fig. 4). Therefore, possible sites of hydroxylation included either of the two pendant phenyl rings or on the methylene group β to the piperidine nitrogen. The general unstable nature of carbinolamines rules out hydroxylation on the methylene group α to the piperidine nitrogen. The most likely site of hydroxylation in M1 is on one of the phenyl groups on the N-monomethyl-α,α-diphenylbutyramide substituent, based on the fragment ion at m/z 182 that corresponds to the acylium ion indicated in Fig. 4. Establishing the regiochemistry of aromatic hydroxylation would require the use of NMR.

Collision-induced dissociation spectrum of the M1 metabolite of loperamide.
The signal for metabolite M5 at m/z 455 was 22 amu less than m/z 477 (the protonated molecular ion of loperamide). The CID spectrum of M5 revealed the characteristic fragment ion at m/z 266, indicative of a structural change on the 4-(4-chlorophenyl) piperidin-4-ol moiety (Fig. 5). The loss of 22 amu is consistent with the oxidative metabolism on the piperidin-4-ol ring system to the corresponding pyridinium LPP+. Preliminary indication that the signal for M5 corresponded to the pyridinium was evident from the observation that the pyridinium metabolite of haloperidol, i.e., HPP+, also eluted after the parent under the present experimental conditions (haloperidol Rt = 13.1 min; HPP+Rt = 13.4 min) (Kalgutkar et al., 2003). Treatment of the incubation mixture with sodium borohydride resulted in the disappearance of the signal for M5 (data not shown), which is consistent with reduction of the pyridinium metabolite to the corresponding 1,2,3,6-tetrahydropyridine analog as has been demonstrated for analogous pyridinium derivatives (Shetty et al., 1990). Furthermore, the LC-MS/MS characteristics (Rt at 15.4 min; m/z 455, 266) of the enzymatically generated metabolite were identical with those of the crude pyridinium derivative obtained via chemical manipulations on loperamide as described previously for haloperidol (Subramanyam et al., 1991a). This finding unambiguously confirms that M5 is the pyridinium metabolite of loperamide. The proposed biotransformation pathways of loperamide in human liver microsomes are depicted in Fig. 6.

Collision-induced dissociation spectrum of LPP+, the pyridinium metabolite of loperamide.
Characterization of Loperamide Metabolites in Rat Liver Microsomes. The biotransformation pathways of loperamide in rat liver microsomes were similar to those observed in human (see Fig. 6). A total ion chromatogram of the metabolites obtained after incubation of loperamide (20 μM) in NADPH-supplemented rat liver microsomes is depicted in Fig. 7. Similar to human, N-demethylation of loperamide to M3 constituted the principal metabolic fate of loperamide in the rat. Likewise, the formation of LPP+ was discernible in the rat liver microsomal incubations. Besides the formation of metabolites M1 through M5, two additional metabolites, designated M6 and M7, were detected in the rat liver microsomal incubates.

Total ion chromatogram of an incubation mixture of loperamide (20 μM) in NADPH-supplemented rat liver microsomes.
Metabolite M6, which eluted at 14.1 min, revealed a protonated molecular ion at m/z 471. Although the molecular weight of M6 was 6 amu lower than that of loperamide, the CID spectrum of M6 revealed a fragment ion at m/z 282 indicative of hydroxylation on the N,N-dimethyl-α,α-diphenylbutyramide substituent (addition of 16 amu to m/z 266). The presence of the fragment ion at m/z 238 in the CID spectrum of M6 (also observed in the CID spectrum of M1; see Fig. 4) ruled out carbinolamide formation. Likewise, the fragment ion at m/z 182, which was observed in the CID spectrum of M1, was also observed in the mass spectrum of M6. These observations suggest that the site of hydroxylation is on either of the two phenyl rings on the N,N-dimethyl-α,α-diphenylbutyramide substituent. A proposed structure for M6 that would be consistent with the observed protonated molecular ion at m/z 471 and the fragment ion at m/z 282 is the pyridinium species depicted in Fig. 6.
Metabolite M7, which eluted at 14.5 min, revealed a protonated molecular ion at m/z 441 (a difference of 36 amu from the protonated molecular ion of loperamide). The characteristic fragment ion at m/z 252 (N-monomethyl-α,α-diphenylbutyramide portion) in the CID spectrum of M7 was indicative of N-demethylation (loss of 14 amu). The additional loss of 22 mass units can be explained by oxidative metabolism on the piperidin-4-ol ring system to the corresponding pyridinium species. On this basis, we propose the structure of metabolite M7 to be the pyridinium derivative of the N-desmethylloperamide metabolite M3 (see Fig. 6).
Identification of the Human P450 Isozymes Responsible for Loperamide Metabolism. To identify the human P450 isozymes involved in loperamide metabolism, loperamide (final concentration = 1 μM) was incubated with human liver microsomes containing NADPH in the absence or presence of isozyme-selective P450 inhibitors. In the absence of selective P450 inhibitors, the estimated t1/2 for loperamide disappearance in NADPH-supplemented human liver microsomes was 10 min. Loperamide depletion was markedly inhibited in human liver microsomes pretreated with 2 μM ketoconazole, a selective P4503A4 inhibitor (extrapolated t1/2 = 50 min) (Fig. 8). Interestingly, coincubation of loperamide (1 μM) with bupropion (150 μM), a marker substrate for P4502B6 (Faucette et al., 2000), also resulted in a modest increase in loperamide microsomal stability (t1/2 = 25 min) (Fig. 8). A further increase in the human liver microsomal stability of loperamide was observed following coincubation with a combination of ketoconazole (2 μM) and bupropion (150 μM) (extrapolated t1/2 = 70 min). In contrast with these observations, pre-treatment of human liver microsomes with quinidine (P4502D6 inhibitor), sulfaphenazole (P4502C9 inhibitor), ticlopidine (P4502C19 inhibitor), and furafylline (P4501A2 inactivator) did not alter loperamide metabolism (data not shown). Thus, in human liver microsomes, P4503A4 appears to be the major isozyme responsible for loperamide metabolism with minor contributions from P4502B6.

Effect of the selective P4503A4 and P4502B6 inhibitors ketoconazole and bupropion on the human liver microsomal stability of loperamide. Loperamide (final concentration = 1 μM) was incubated with human liver microsomes containing NADPH in the absence (closed circles) or presence of ketoconazole (2 μM) (open circles), bupropion (150 μM) (closed triangles), and ketoconazole (2 μM)/bupropion (150 μM) (open triangles) at 37°C, and aliquots of the incubation mixture were periodically analyzed (0-30 min) for remaining loperamide in the incubates. Each data point is an average from two separate determinations.
To further establish the role of P450 enzymes in loperamide metabolism, loperamide depletion was also monitored over a period of 30 min following its incubation at a concentration of 1 μM with several recombinant human P450 enzymes (P4501A2, -2B6, -2C9, -2C19, -2D6, -3A4, and -3A5) in the presence of NADPH cofactor at 37°C. Consistent with the results obtained from the chemical inhibition studies in human liver microsomes, only recombinant P4503A4 and -2B6 catalyzed the NADPH-dependent loperamide degradation with estimated t1/2 values of 23 and 58 min, respectively. Loperamide was stable in the presence of the other P450 isozymes included in the analysis.
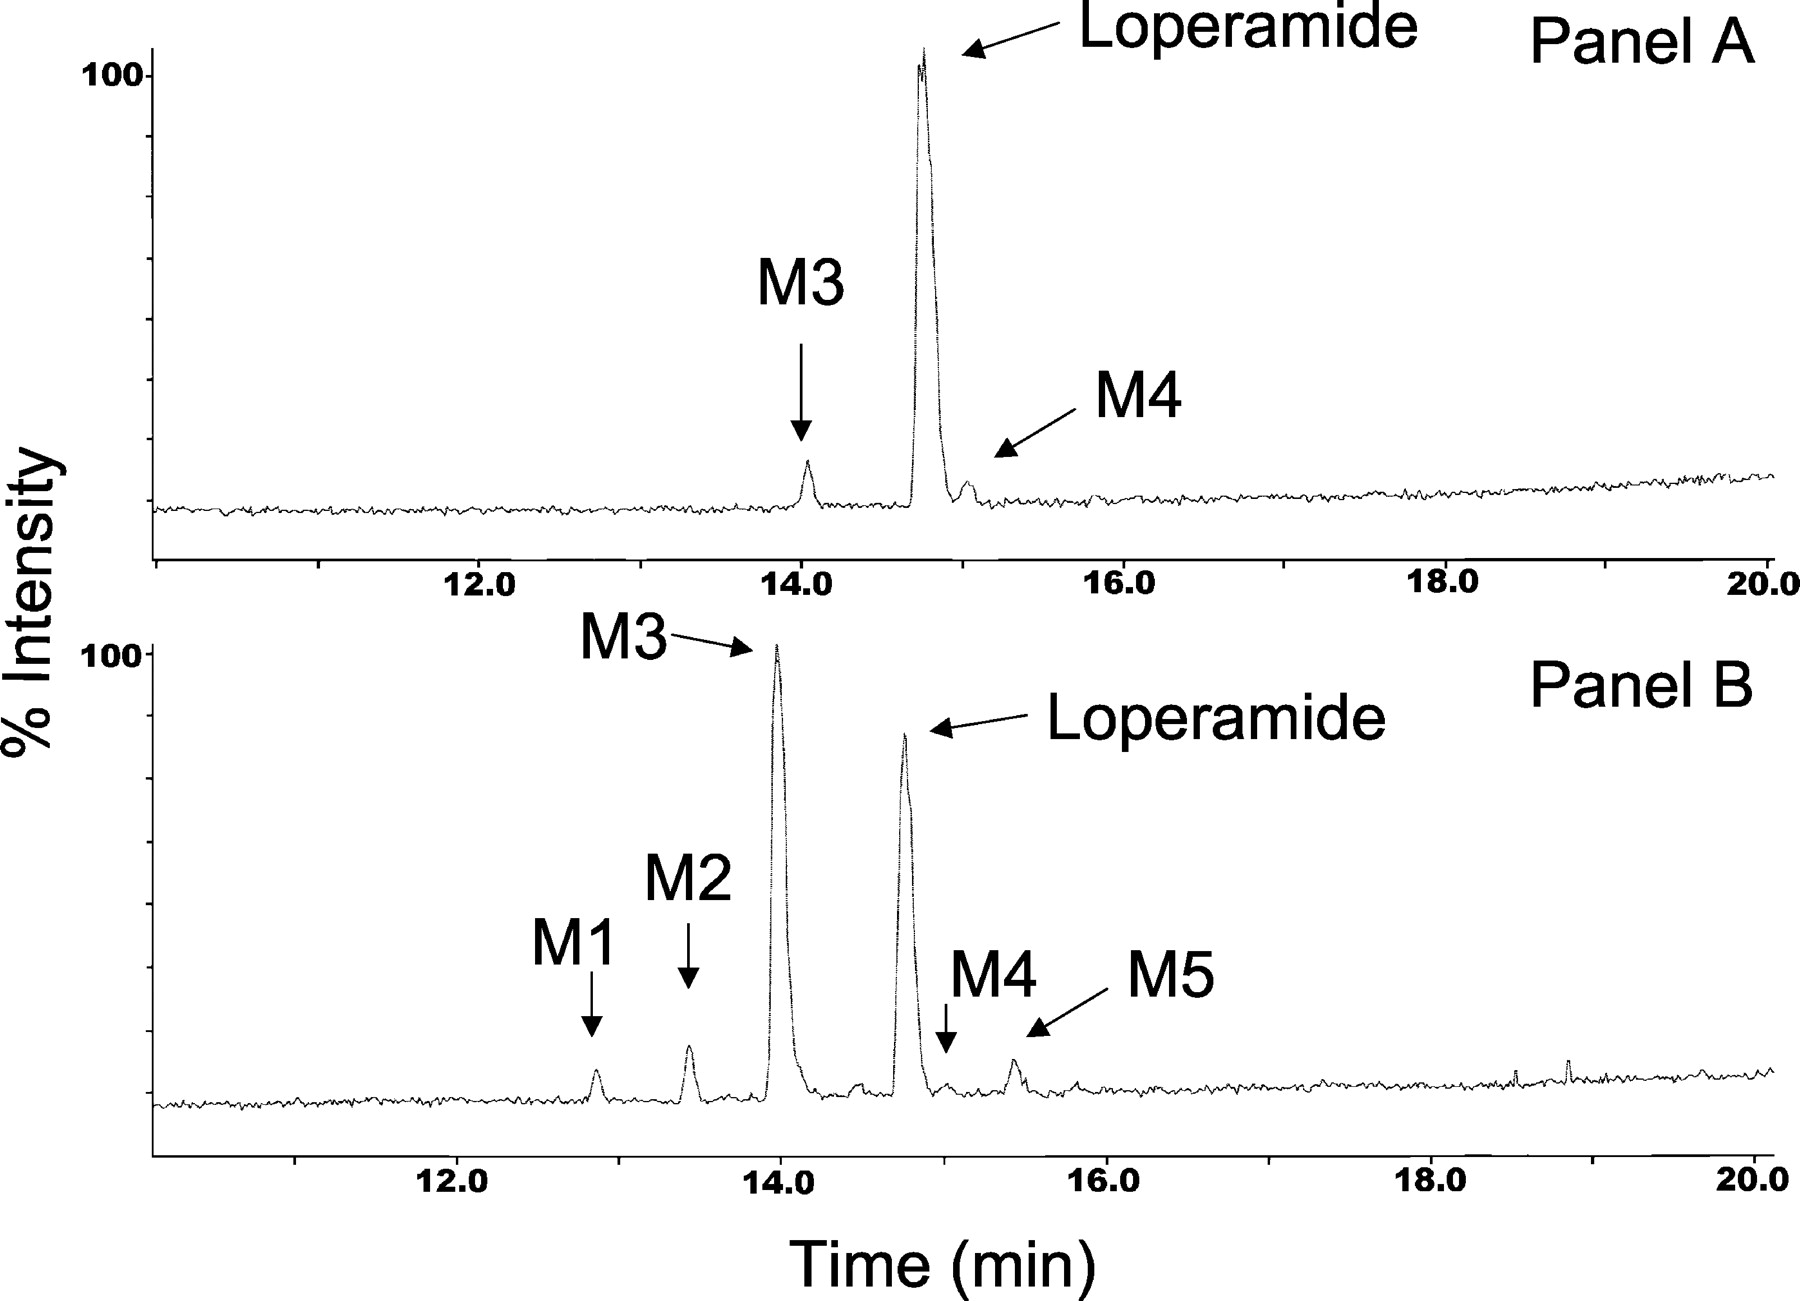
The metabolic profile of loperamide was also examined in human recombinant P4503A4 and P4502B6 at a final loperamide concentration of 20 μM. All of the loperamide metabolites (M1-M5) observed in human liver microsomes were also detected in human recombinant P4503A4 incubations (Fig. 9B). In contrast, N-desmethylloperamide (M3) and loperamide-N-oxide (M4) were the only two loperamide metabolites observed after incubation with recombinant P4502B6 (Fig. 9A).

Total ion chromatogram of an incubation mixture of loperamide (20 μM) in human recombinant P4502B6 (A) and P4503A4 (B) isozymes.
Discussion
Several new observations on loperamide metabolism were noted in the current investigation, including the finding that P4503A4 metabolized loperamide to a potentially neurotoxic pyridinium metabolite in human liver microsomes. The proposed mechanism of LPP+ formation is most likely similar to that indicated for the conversion of haloperidol to HPP+ (Subramanyam et al., 1991a,b; Usuki et al., 1996) (see Fig. 1) and involves the obligatory P4503A4-catalyzed α-carbon oxidation of loperamide to the iminium species 1. Rearrangement of 1 yields the corresponding enamine 2 that undergoes β-elimination to afford the loperamide-2,3-dihydropyridinium species 3. Further two-electron oxidation or disproportionation of 3 generates the fully oxidized LPP+ species. Attempts to trap 3 as the corresponding cyano adduct in both human and rat liver microsomal incubations pretreated with excess potassium cyanide (5 mM) were unsuccessful (data not shown). It is interesting to note that prior attempts to characterize the cyano adduct of the haloperidol-2,3-dihydropyridinium species in microsomal incubations with haloperidol were also unsuccessful (Subramanyam et al., 1991a,b).
Despite the presence of the common 4-(4-chlorophenyl) piperidin-4-ol motif in the chemical structures of haloperidol and loperamide, the two drugs demonstrate significant differences in their overall metabolic fate in humans. Predominant routes of in vivo haloperidol metabolism (∼70% of the administered dose) in humans involve glucuronidation of the tertiary alcohol moiety attached to the piperidine ring and reduction of the carbonyl group on the N-4-fluorophenylbutyrophenone substituent. Cytochrome P4503A4-mediated haloperidol biotransformation pathways that collectively comprise N-dealkylation, aromatic hydroxylation, and HPP+ formation represent a minor component of overall haloperidol metabolism (∼30% of the administered dose) (for a review, see Kudo and Ishizaki, 1999). In contrast, cytochrome P4503A4 plays a dominant role in the in vivo and in vitro metabolism of loperamide in humans, principally through the N-dealkylation pathway leading to N-desmethylloperamide. The circulating plasma concentrations of the “minor” loperamide metabolites including LPP+ remain to be determined in humans.
The metabolic fate of loperamide in rat liver microsomes was comparable to that observed in human and included N-dealkylation to the N-desmethylloperamide metabolite M3 as the major biotransformation pathway. This finding is consistent with the previous report that N-desmethylloperamide formation constitutes the major metabolic fate of loperamide in the rat after intraperitoneal administration of [14C]loperamide (Yoshida et al., 1979). Furthermore, the characterization of the phenolic metabolite M6 and the pyridinium metabolite of N-desmethylloperamide M7 in rat liver microsomes is consistent with their in vivo detection in rat fecal extracts after [14C]loperamide administration (Yoshida et al., 1979).
The present set of studies also indicated a predominant role for P4503A4 in all of the loperamide biotransformation pathways depicted in Fig. 6. The characterization of N-desmethylloperamide (M3) as the major metabolite of loperamide in microsomes is consistent with previous findings that N-dealkylation of loperamide to N-desmethylloperamide constitutes the principal in vivo metabolic fate of the drug in humans (Tayrouz et al., 2001). The principal involvement of P4503A4 in loperamide metabolism in vitro is also consistent with the in vivo pharmacokinetic interaction in humans between loperamide and the P4503A4 inhibitor ritonavir, which leads to a statistically significant 3-fold increase in the area under the concentration time curve of loperamide (Tayrouz et al., 2001). Competitive inhibition studies in human liver microsomes using the selective P4502B6 probe substrate bupropion (Faucette et al., 2000) also indicated a minor role for P4502B6 in loperamide metabolism. However unlike P4503A4, P4502B6 was only responsible for the biotransformation pathways involving N-desmethylloperamide and loperamide-N-oxide formation. The contribution of P4502B6 toward loperamide clearance in humans needs to be assessed in vivo.
The potential neurotoxicological significance of the bioactivation sequence loperamide → LPP+ as it relates to the now well established nigrostriatal neurotoxin MPTP will be modulated by the inherent toxicity of LPP+ and the access it will have to critical constituents in the CNS. The selective destruction of the nigrostriatal neurons by MPP+ is remarkable since these neurons do not catalyze MPTP bioactivation to MPP+, presumably because they lack monoamine oxidase-B activity. This dilemma appears to have been resolved by the demonstration that after synthesis in the monoamine oxidase-B-rich glial cells, MPP+ is selectively sequestered by the striatal dopaminergic neurons via the dopamine transporter (Javitch et al., 1985). Once localized intraneuronally, MPP+ is concentrated further within the inner mitochondrial membrane, where it selectively inhibits complex I of the electron transport chain. Like MPP+, HPP+ was also shown to inhibit dopamine uptake into brain synaptosomes, suggesting an interaction with the dopamine transporter (Wright et al., 1998). Considering the structural resemblance of LPP+ with MPP+ and HPP+, it is tempting to speculate that LPP+ can function as a dopamine transporter substrate and gain access to the nigrostriatal neuronal architecture. Furthermore, based on the MPP+-like neurotoxicity observed with HPP+ (Rollema et al., 1994; Fang et al., 1995) and structurally diverse N-substituted pyridinium compounds (Rollema et al., 1990), the likelihood that LPP+ also exhibits MPP+-like neurotoxicity in similar biological matrices also remains a strong possibility. In reality, however, loperamide is a perfectly safe antidiarrheal agent that exhibits selective (peripheral) opiate-like effects on the gastrointestinal tract; central opiate effects including analgesia and respiratory depression are rarely observed at the standard or even high clinical doses. This apparent tissue selectivity is consistent with the fact that loperamide is a P-glycoprotein substrate, so that normally it does not gain access to the CNS. The argument that P-glycoprotein in the blood-brain barrier is the key factor responsible for the selective (peripheral) pharmacological behavior of loperamide is strengthened by the appearance of full-blown opioid/narcotic effects (analgesia and respiratory depression) after oral administration of loperamide to mice lacking the P-glycoprotein gene (Schinkel et al., 1996) and upon oral coadministration of loperamide and the P-glycoprotein inhibitor quinidine to humans (Sadeque et al., 2000). In light of these data, we speculate that the restricted CNS access to loperamide is a critical feature in preventing bioactivation of the antidiarrheal agent in the brain.
Despite structural similarity to loperamide, haloperidol is not a P-glycoprotein substrate (Mahar Doan et al., 2002). This difference is not altogether surprising since lipophilicity has been implicated as a key determinant of P-glycoprotein substrate specificity of amines (Wiese and Pajeva, 2001) and loperamide (clog P = 4.66) is significantly more lipophilic than haloperidol (clog P = 3.85). Furthermore, the detection of HPP+ in rat brain after intravenous administration of the pyridinium suggests that this positively charged metabolite is also capable of blood-brain barrier penetration via passive diffusion (Kawashima et al., 2002). These findings raise the possibility that haloperidol neurotoxicity could also be mediated by partitioning of HPP+ into the CNS following its formation in the liver. Although permanently cationic compounds are generally associated with poor passive permeability, it is important to note that the clog P of HPP+ (1.2) falls in the range of values (0.8-2.5) associated with compounds that can pass freely through the blood-brain barrier by passive diffusion (Kawashima et al., 2002). Since LPP+ (clog P = 1.89) is significantly more lipophilic than HPP+ and therefore would be expected to cross the blood-brain barrier more readily than HPP+, the possibility that LPP+ is also a P-glycoprotein substrate seems distinct. The recent finding that quaternary amine analogs of P-glycoprotein substrates/inhibitors (e.g., quinidine) possess P-glycoprotein substrate affinity comparable to that of the parent tertiary amine (Hooiveld et al., 2002) further strengthens our hypothesis. Efforts are currently underway to scale up the synthesis of LPP+ in an attempt to shed light on some of these questions.
Finally, an additional parameter that could account for the differences in the neurotoxicity profile of loperamide and haloperidol is the difference in the therapeutic regimen of the two drugs. Although systemic exposure of the two drugs after a single oral dose of ∼5 to 8 mg is comparable (Cmax range 1-3 ng/ml), haloperidol is administered in a chronic setting, whereas loperamide is usually taken for a short period of time. The extrapyramidal side effects associated with haloperidol therapy can be further subdivided into reversible short-term and irreversible long-term events. The short-term effects associated with haloperidol use in humans are primarily a consequence of the dopamine D2 receptor antagonist activity of the drug (Lahti et al., 1993) and not due to the bioactivation event leading to HPP+ formation. This hypothesis is consistent with the findings that chlorpromazine and other antipsychotic drugs also cause short-term side effects despite the absence of the piperidin-4-ol ring that can form a pyridinium metabolite (Lyles-Eggleston et al., 2003). Although the short-term side effects are troublesome, it is the long-term, debilitating, parkinsonism-like effects, including tardive dyskinesia, that have hampered the widespread use of haloperidol. Therefore, it is in the chronic setting where prolonged neuronal exposure to HPP+ could result in a drug-induced pathological lesion leading to neuronal injury and, ultimately, to the irreversible parkinsonism-like syndrome. Since loperamide usage is restricted to a few days of treatment, the local concentration of LPP+ to which dopaminergic neurons would be exposed would be minimal at best.
In conclusion, the clinical safety of loperamide despite bioactivation to an MPP+/HPP+-like species serves as an excellent illustration to support the notion that not all compounds that are bioactivated in vitro will elicit a toxicological response in vivo. It is crucial to place results from in vitro bioactivation studies within the proper context of overall factors (e.g., indication, acute versus chronic therapy, dose size and regimen) when making a final decision on whether to proceed with the development of the drug.
Acknowledgments
We thank Drs. Cornelis E. Hop, Sharon Ripp, and Samit K. Bhattacharya for helpful discussions and a critical reading of the manuscript.
Footnotes
-
ABBREVIATIONS: MPP+, N-methyl-4-phenylpyridinium; MPTP, N-methyl-4-phenyl-1,2,3,6-tetrahydropyridine; haloperidol, 4-(4-chlorophenyl)-1-[4-(4-fluorophenyl)-4-oxobutyl]-4-piperidinol; HPP+, 4-(4-chlorophenyl)-1-[4-(4-fluorophenyl)-4-oxobutyl]-pyridinium; HPDP+, 4-(4-chlorophenyl)-1-[4-(4-fluorophenyl)-4-oxobutyl]-2,3-dihydropyridinium; loperamide, 4-(4-chlorophenyl)-4-hydroxy-N,N-dimethyl-α,α-diphenyl-1-piperidinebutyramide; LPP+, 4-(4-chlorophenyl)-N,N-dimethyl-α,α-diphenyl-1-pyridinium-butyramide; P450, cytochrome P450; CNS, central nervous system; DMSO-d6, dimethyl sulfoxide-d6; Rt, retention time; CID, collision-induced dissociation; LC-MS/MS, high-performance liquid chromatography/tandem mass spectrometry; amu, atomic mass unit(s).
- Received March 17, 2004.
- Accepted June 3, 2004.
- The American Society for Pharmacology and Experimental Therapeutics


