A baseline for the multivariate comparison of resting-state networks
- 1The Mind Research Network, Albuquerque, NM, USA
- 2Department of Electrical and Computer Engineering, University of New Mexico, Albuquerque, NM, USA
- 3Department of Family and Community Medicine, University of New Mexico, Albuquerque, NM, USA
- 4Department of Psychiatry, University of New Mexico, Albuquerque, NM, USA
- 5Department of Biological and Medical Psychology, Faculty of Psychology, University of Bergen, Bergen, Norway
- 6Department of Psychology, University of New Mexico, Albuquerque, NM, USA
- 7Center on Alcoholism Substance Abuse and Addiction, University of New Mexico, Albuquerque, NM, USA
- 8Department of Neuroscience, University of New Mexico, Albuquerque, NM, USA
- 9Center for BrainHealth, School of Behavioral and Brain Sciences, University of Texas at Dallas, Dallas, TX, USA
- 10 Department of Neurology, University of New Mexico, Albuquerque, NM, USA
- 11 Department of Neurosurgery, University of New Mexico, Albuquerque, NM, USA
- 12 Center for Development and Disability, University of New Mexico, Albuquerque, NM, USA
- 13 Department Obstetrics and Gynecology, University of New Mexico, Albuquerque, NM, USA
- 14 Olin Neuropsychiatry Research Center, The Institute of Living, Hartford, CT, USA
- 15 Department of Psychiatry, Yale University, New Haven, CT, USA
- 16 Department of Neurobiology, Yale University, New Haven, CT, USA
- 17 Behavioral Health Care Line, New Mexico VA Health Care System, Albuquerque, NM, USA
As the size of functional and structural MRI datasets expands, it becomes increasingly important to establish a baseline from which diagnostic relevance may be determined, a processing strategy that efficiently prepares data for analysis, and a statistical approach that identifies important effects in a manner that is both robust and reproducible. In this paper, we introduce a multivariate analytic approach that optimizes sensitivity and reduces unnecessary testing. We demonstrate the utility of this mega-analytic approach by identifying the effects of age and gender on the resting-state networks (RSNs) of 603 healthy adolescents and adults (mean age: 23.4 years, range: 12–71 years). Data were collected on the same scanner, preprocessed using an automated analysis pipeline based in SPM, and studied using group independent component analysis. RSNs were identified and evaluated in terms of three primary outcome measures: time course spectral power, spatial map intensity, and functional network connectivity. Results revealed robust effects of age on all three outcome measures, largely indicating decreases in network coherence and connectivity with increasing age. Gender effects were of smaller magnitude but suggested stronger intra-network connectivity in females and more inter-network connectivity in males, particularly with regard to sensorimotor networks. These findings, along with the analysis approach and statistical framework described here, provide a useful baseline for future investigations of brain networks in health and disease.
1 Introduction
Measurement of the blood oxygen level-dependent (BOLD) signal with functional magnetic resonance imaging (fMRI) has become a powerful tool for studying large-scale in vivo brain function. Following the seminal discovery by Biswal et al. (1995) that distinct brain regions exhibit synchronous fluctuations in intrinsic activity, our understanding of so-called functional connectivity has grown substantially. Several different methods have successfully delineated a large number of temporally coherent networks that subserve critical functions such as vision, audition, motor planning, and directing attention (Calhoun et al., 2002a; Beckmann et al., 2005; Damoiseaux et al., 2006; Smith et al., 2009). These networks show surprisingly consistent, though not identical, patterns of activation in the presence or absence of a particular task (Calhoun et al., 2008a; Harrison et al., 2008; Laird et al., 2009; Smith et al., 2009), and are often acquired while subjects are at rest. Despite evaluation during a relatively unconstrained state, resting-state networks (RSNs) exhibit high reproducibility (Damoiseaux et al., 2006) and moderate to high test-retest reliability (Franco et al., 2009; Shehzad et al., 2009; Zuo et al., 2010), suggesting a robust examination of the intrinsic functional architecture, or “connectome, of the human brain (Biswal et al., 2010).
Because functional connectivity between regions is believed to characterize large-scale system integrity (Van Dijk et al., 2010), there is great interest in understanding the variability of these networks in normal development and clinical contexts. Studies of the default-mode network (DMN), a set of brain regions preferentially active when subjects are not focused on the external environment (Raichle et al., 2001; Buckner et al., 2008), have established that this network not only shows a high degree of heritability (Glahn et al., 2010), but also shows alterations in a number of different neurological disorders (see Greicius, 2008 and Broyd et al., 2009 for recent reviews). For example, in autism, functional connectivity between DMN regions is substantially reduced, though coactivation within the dorsal attention network, a set of brain regions implicated in directing attention during cognitively demanding tasks, appears relatively unaffected (Kennedy and Courchesne, 2008). The parallel between altered connectivity (specific to regions associated with internal, self-referential processes) and symptoms that characterize autism suggests that straightforward investigations into functional connectivity can elucidate the etiology of complex disorders. Similar success has been found with regard to schizophrenia, where impaired modulation of the DMN has been observed in schizophrenia patients as well as their first-degree relatives, identifying an endophenotype based on large-scale connectivity (Whitfield-Gabrieli et al., 2009; Abbott et al., 2010). Furthermore, increased connectivity between particular DMN regions is associated with the severity of positive symptoms, suggesting a correspondence between specific “hyperconnectivity” and psychosis (Garrity et al., 2007; Whitfield-Gabrieli et al., 2009). The spectral properties of network activation in schizophrenia have also been explored, revealing a signature of reduced low frequency power and increased high frequency power in the DMN as well as many other RSNs (Garrity et al., 2007; Calhoun et al., 2008b, 2009).
While multiple aspects of intrinsic functional connectivity show potential for clinical applications, the utility of network evaluation as a reliable diagnostic tool depends on the ability to interpret aberrant findings in the presence of an appropriate baseline. Fundamental factors, such as age and gender, are expected to exert large influences on functional connectivity based on their strong associations with underlying anatomy. For instance, most cortical regions show rapid gray matter loss as the brain matures through adolescence, followed by more gradual reductions in adulthood and advanced aging (Good et al., 2001; Sowell et al., 2003; Tamnes et al., 2010), though this trend is heterogeneous across structures and particularly variable in subcortical regions (Østby et al., 2009). White matter shows a different developmental trajectory, with volume and tract integrity peaking in adulthood (approximately 25–35 years of age) then declining slowly with age (Sowell et al., 2003; Sullivan and Pfefferbaum, 2006; Tamnes et al., 2010). Structural differences are also observed between genders; effects are smaller and some findings lack consistency, however studies concur that females show modest increases in gray matter volume localized to frontal, temporal, and parietal cortices and basal ganglia (BG) structures (Good et al., 2001; Luders et al., 2005, 2009; Sowell et al., 2007).
As anticipated, recent investigations have identified effects of age and gender on functional connectivity. With regard to age, reports suggest network maturation in childhood (Szaflarski et al., 2006; Karunanayaka et al., 2007; Fair et al., 2008), progressive decreases in network mutual influences throughout adolescences into adulthood (Stevens et al., 2009), followed by decreases in functional connectivity and coherence in middle and late adulthood (Andrews-Hanna et al., 2007; Damoiseaux et al., 2008; Esposito et al., 2008; Koch et al., 2009; Biswal et al., 2010). Gender-related differences have received less attention but there appears to be some consensus of slightly greater connectivity in females localized to the precuneus and posterior cingulate cortex (Bluhm et al., 2008; Biswal et al., 2010). While these studies establish the influence of age and gender on functional connectivity, most unfortunately limit their investigations to the DMN, creating a dearth of reported effects with regard to other regions. In part, this bias reflects the unique function of the DMN related to internal mental processes and the desire to explicitly explore the “cognitive baseline” (Raichle et al., 2001). However, the relatively narrow scope of prior studies may also reflect the difficulty and somewhat overwhelming nature of investigations of full brain connectivity (Bullmore and Sporns, 2009). As the dimensions of data increase, so do the challenges associated with each analysis step, extending from data collection and processing to interpretation and visualization (Biswal et al., 2010; Costafreda, 2010).
Given the need for a more comprehensive understanding of functional connectivity and the methodological challenges associated with such a pursuit, the current study has two primary goals. First, we aim to present a statistical framework optimized for the analysis of large datasets that can be easily applied to investigations in other areas. We advocate a hierarchical approach where multivariate models are used first to identify important covariates, reducing the number of subsequent univariate tests and decreasing the risk of spurious findings. For multivariate analyses, we exploit the autoregressive structure common to many types of data and recommend appropriate dimension reduction of response variables to enhance the sensitivity and specificity of model estimation.
Our second goal is to apply this statistical framework in a detailed and careful investigation of the effects of age and gender on large-scale resting-state functional connectivity throughout the brain. To this end, we focus our analysis on data from a large number of healthy subjects (M = 603) collected on a single instrument, and employ group independent components analysis (GICA) to identify a set of robust and reliable RSNs (Calhoun et al., 2001). We examine the effects of age and gender on three ICA-derived outcome variables describing distinct but complementary facets of functional connectivity. These include (1) the power spectra of RSN time course (TCs), related to level of coherent activity within a network; (2) the intensities of RSN spatial map (SMs), related to the connectivity and degree of coactivation within a network; and (3) the functional network connectivity (FNC; Jafri et al., 2008), related to the connectivity between networks. Furthermore, we consider these outcome measures as a function of local gray matter concentration (GMC) to determine the extent to which functional changes reflect those observed in the structural domain (Damoiseaux et al., 2008; Glahn et al., 2010).
Using the described statistical approach, we identify numerous effects of age and gender on different aspects of functional connectivity throughout cortical and subcortical structures. Our results corroborate previous observations and provide novel findings that motivate future in-depth investigations.
2 Materials and Methods
2.1 Participants
This analysis combines existing data from 603 subjects scanned on the same scanner and spread across 34 studies and 18 principal investigators at the Mind Research Network (MRN). Informed consent was obtained from all subjects according to institutional guidelines at the University of New Mexico (UNM) and all data were anonymized prior to group analysis. None of the participants were taking psychoactive medications at the time of the scan or had a history of neurological or psychiatric disorders. Subjects were excluded from analysis if their functional scans showed extreme motion (maximum translation >6 mm, roughly two voxels) or showed poor spatial normalization to the EPI template (see below). Subjects were also excluded if they maintained high levels of substance use (smoking an average of 11 or more cigarettes per day; drinking 2.5 or more drinks per day).
Table 1 provides characteristics of the participants under investigation. The sample is nearly balanced on gender (305 females), and the age distributions for genders are very similar. Because the sample is overwhelmingly right-handed (46 ambidextrous or left-handed individuals) and preliminary tests showed no handedness effects, we do not consider handedness from this point forward. Similarly, because participants in the white racial category are overrepresented, and some studies did not collect racial information, we do not consider race from this point forward. Age is right skewed with only seven people older than 50 and the majority of individuals in adolescence or young adulthood (80% of subjects between 13 and 30 years old). We therefore use a normalizing transformation, log(age), to reduce the leverage of older subjects in regression analyses (Figure 2A).
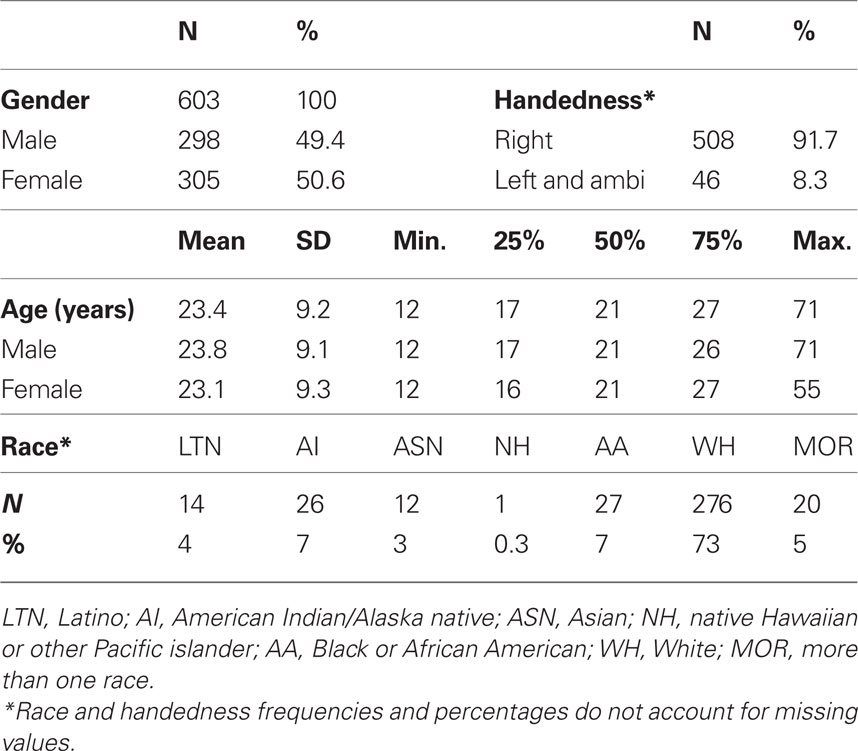
Table 1. Demographic information. Distributions for primary variables gender and age, as well as secondary variables handedness and race.
2.2 Data Acquisition
All images were collected on a 3-Tesla Siemens Trio scanner with a 12-channel radio frequency coil. High resolution T1-weighted structural images were acquired with a five-echo MPRAGE sequence with TE = 1.64, 3.5, 5.36, 7.22, 9.08 ms, TR = 2.53 s, TI = 1.2 s, flip angle = 7°, number of excitations = 1, slice thickness = 1 mm, field of view = 256 mm, resolution = 256 × 256. T2*-weighted functional images were acquired using a gradient-echo EPI sequence with TE = 29 ms, TR = 2 s, flip angle = 75°, slice thickness = 3.5 mm, slice gap = 1.05 mm, field of view 240 mm, matrix size = 64 × 64, voxel size = 3.75 mm × 3.75 mm × 4.55 mm. Resting-state scans were a minimum of 5 min, 4 s in duration (152 volumes). Any additional volumes were discarded to match data quantity across participants. Subjects were instructed to keep their eyes open during the scan and stare passively at a foveally presented fixation cross, as this is suggested to facilitate network delineation compared to eyes-closed conditions (Van Dijk et al., 2010).
2.3 Data Preprocessing
Functional and structural MRI data were preprocessed using an automated preprocessing pipeline and neuroinformatics system (Figure 1, step 1) developed at MRN (Bockholt et al., 2009) and based around SPM51. Following the completion of a scan, data are automatically archived and copied to an analysis directory where preprocessing is performed. In the functional data pipeline, the first four volumes are discarded to remove T1 equilibration effects, images are realigned using INRIalign, and slice-timing correction is applied using the middle slice as the reference frame. Data are then spatially normalized into the standard Montreal Neurological Institute (MNI) space (Friston et al., 1995), resliced to 3 mm × 3 mm × 3 mm voxels, and smoothed using a Gaussian kernel with a full-width at half-maximum (FWHM) of 10 mm. To ensure quality and consistency of spatial normalization across subjects we calculate the spatial correlation between each subjects normalized data and the EPI template, as well as the degree of intersection between the EPI mask (determined by retaining voxels greater than the mean of the distribution) and the subject mask (determined by the same criteria). For the analysis presented here, these two metrics flagged datasets from 35 subjects, three of which were uncorrectable due to incomplete brain coverage and one that was unusable due to large signal dropout. The remaining 31 scans were corrected by manually reorienting the original images (shift in the yaw direction), then were re-preprocessed through the pipeline. Subsequent to automated preprocessing, the data were intensity-normalized to improve the accuracy and test-retest reliability of independent components analysis (ICA) output (Allen et al., 2010). Intensity normalization divides the time series of each voxel by its average intensity, converting data to percent signal change units.
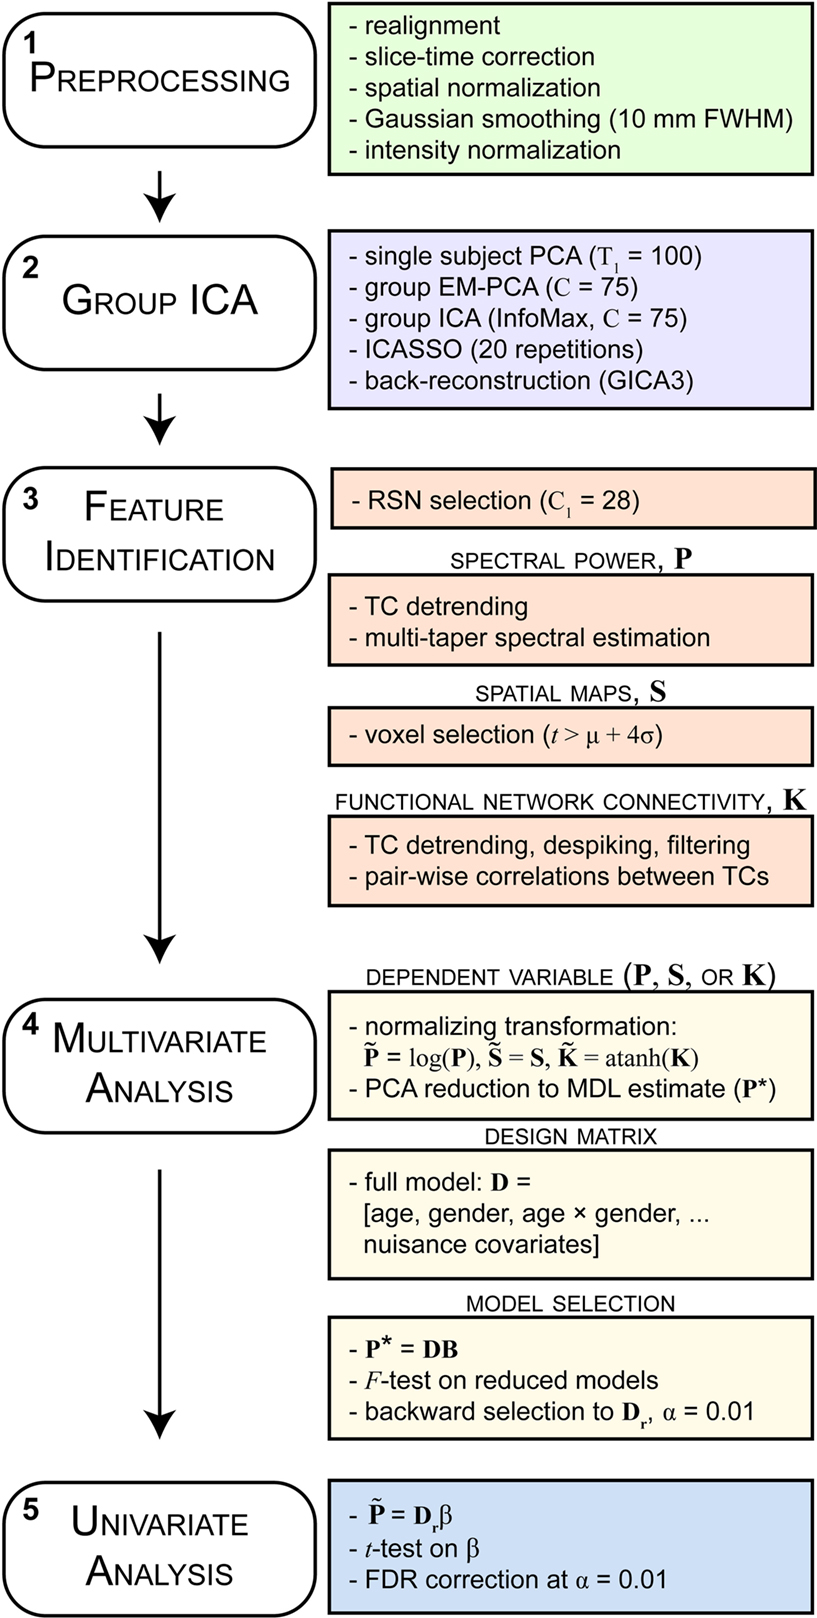
Figure 1. Schematic of the analysis pipeline. Boxes on the left indicate general steps potentially applicable to a variety of data and analysis types; boxes on the right indicate particular choices made for the data and analysis presented here. See Section 2 for details and abbreviations.
For the structural data pipeline, tissue classification, bias correction, image registration, and spatial normalization were automatically performed using voxel-based morphometry (VBM) in SPM5, wherein the above steps are integrated into a unified model (Ashburner and Friston, 2005). Unmodulated gray matter images, estimating local GMC were then smoothed using a Gaussian kernel with a FWHM of 10 mm and resliced to 3 mm × 3 mm × 3 mm to match the functional image dimensions. Our choice of unmodulated rather than modulated images is based on a previous study showing that modulated images confer greater inter-subject variability and thus reduced sensitivity to detect differences between groups (see Figure 2 of Meda et al., 2008). For the analyses presented here, modulated data, i.e., gray matter volume (GMV), yielded similar findings to those found with GMC, and the choice of GMC or GMV would have little impact on our general results or interpretation.
2.4 Group Independent Component Analysis
Data were decomposed into functional networks using spatial ICA. Spatial ICA applied to fMRI data identifies temporally coherent networks by estimating maximally independent spatial sources, referred to as SMs, from their linearly mixed fMRI signals, referred to as TCs (Figure 1, step 2). We use ICA, rather than seed-based approaches, to identify networks as this multivariate data-driven method eliminates the somewhat arbitrary choice of seed regions and simultaneously takes into account the relationships between all voxels (as opposed to simple pairwise correlations). Furthermore, compared to seed-based methods, ICA may provide increased sensitivity to detect subtle differences between subjects (Koch et al., 2009).
A detailed description of the GICA implemented in this study is provided in Appendix A. Here, we describe the choices we made to prioritize detailed and reliable ICA outcome measures, as well as a processing strategy to accommodate our large dataset and resource-intensive analysis.
Group independent components analysis was performed using the GIFT toolbox2. We chose relatively high model order ICA (number of components, C = 75) as previous studies have demonstrated that such models yield refined components that correspond to known anatomical and functional segmentations (Kiviniemi et al., 2009; Smith et al., 2009; Abou-Elseoud et al., 2010; Ystad et al., 2010). Subject-specific data reduction principal components analysis (PCA) retained T1 = 100 principal components (PCs) using a standard economy-size decomposition. The relatively large number of subject-specific PCs has been shown to stabilize subsequent back-reconstruction (Erhardt et al., 2010). Group data reduction retained C = 75 PCs using the expectation-maximization (EM) algorithm, included in GIFT, to avoid otherwise prohibitive memory requirements (Roweis, 1998). The Infomax ICA algorithm (Bell and Sejnowski, 1995) was repeated 20 times in Icasso3 and resulting components were clustered to estimate the reliability of the decomposition (Himberg et al., 2004). The quality of component clusters was quantified using the index Iq, which ranges from 0 to 1 and reflects the difference between intra-cluster and extra-cluster similarity (Himberg et al., 2004). Aggregate SMs were estimated as the centrotypes of component clusters to reduce sensitivity to initial algorithm parameters. Subject-specific SMs and TCs were estimated using the recently developed GICA3 back-reconstruction method based on PCA compression and projection (Calhoun et al., 2001, 2002b; Erhardt et al., 2010). There are desirable properties in GICA3 not available in other methods, including that the aggregate SM is the sum of the subject-specific SMs, analogous to a random effects model where the subject-specific effects are zero-mean distributed deviations from the group mean effect. Compared with dual regression, a least-squares alternative to back-reconstruction (Filippini et al., 2009), evidence suggests that noise-free PCA with noise-free ICA using GICA3 provides more robust results with a more intuitive and natural interpretation (Erhardt et al., 2010).
2.5 Feature Identification
2.5.1 RSN selection
We identified a subset of C1 components considered to be RSNs (as opposed to physiological artifacts) by inspecting the aggregate SMs and average power spectra (see below; Figure 1, step 3). Four viewers rated the components from 0 (definite artifact) to 1 (certain RSN) based on expectations that RSNs should exhibit peak activations in gray matter, low spatial overlap with known vascular, ventricular, motion, and susceptibility artifacts, and TCs dominated by low frequency fluctuations (Cordes et al., 2000). To facilitate evaluation, spectra were characterized with two metrics used previously to classify components (Robinson et al., 2009): dynamic range, the difference between the peak power and minimum power at frequencies to the right of the peak, and low frequency to high frequency power ratio, the ratio of the integral of spectral power below 0.10 Hz to the integral of power between 0.15 and 0.25 Hz (Figure 3). Tallied votes from the four raters were used to separate components into three broad classes: artifact (score equal to zero), mixed (score between zero and three), and RSN (score of three or greater and no votes equal to zero). This classification scheme constitutes somewhat conservative selection criteria for RSNs, though we feel it is appropriate given our larger goal of discovering associations with gender and age.
2.5.2 Outcome measures
For the set of selected RSNs, we considered three outcome variables: (1) component power spectra, (2) component SMs, and (3) between component connectivity (FNC).
Spectra were estimated on the detrended subject-specific TCs (involving removal of the mean, slope, and period π and 2π sines and cosines over each TC) using the multi-taper approach as implemented in Chronux4, with the time-bandwidth product set to 3 and the number of tapers set to 5 (Mitra and Bokil, 2008).
Component SMs were thresholded to focus our analysis on the subset of voxels most representative of each network. Thresholding was based on the distribution of voxelwise t-statistics to identify voxels with strong and consistent activation across subjects, as explained in Appendix B (Figure A1). From this point forward, descriptions of component SMs refer to the thresholded maps, which include regions most associated with component TCs.
Functional network connectivity was estimated as the Pearson’s correlation coefficient between pairs of TCs (Jafri et al., 2008). Subject-specific TCs were detrended and despiked using 3dDespike5, then filtered using a fifth-order Butterworth low-pass filter with a high frequency cutoff of 0.15 Hz. Pairwise correlations were computed between RSN TCs, resulting in a symmetric C1 × C1 correlation matrix for each subject. For all FNC analyses, correlations were transformed to z-scores using Fisher’s transformation, z = atanh(k), where k is the correlation between two component TCs.
2.6 Statistical Analysis
2.6.1 Overview
Our primary aim is to develop a statistical approach optimized for the large dimensions of the three ICA-derived outcome measures. We propose a multivariate model selection strategy to reduce the total number of statistical tests performed and facilitate testing predictors on the response matrices as a whole (Figure 1, step 4). Analogous to a standard ANOVA F-test with subsequent pairwise univariate contrasts, our strategy performs backward selection by testing whether each predictor in our model explains variability in the multivariate response using a multivariate analysis of covariance (MANCOVA), and for the reduced model of significant predictors proceeds to perform univariate tests corrected for multiple comparisons.
2.6.2 Design matrix
The design matrix, D, includes gender (coded as one for female and zero for male) and age as covariates of interest, as well as a gender by age interaction. In addition, we include three nuisance predictors related to motion and spatial normalization. Although spatial ICA successfully identifies motion-related sources which are removed from analysis (McKeown et al., 2003; Kochiyama et al., 2005), residual motion-related variance may also be present in RSNs. Thus we incorporate motion covariates, defined as the average scan-to-scan rotation and translation from INRIALIGN motion estimates, to improve our evaluation of age and gender effects. Similarly, we include a measure of spatial normalization accuracy, defined as the Spearman correlation between the warped T2*-weighted image and the EPI template. We apply normalizing transformations to all continuous variables to improve symmetry and reduce disproportionate influence (leverage) of outlying values on the model fit. Age, rotation, and translation are log-transformed, while spatial correlation is Fisher-transformed. The distributions of these variables and effects of transformation are displayed in Figure 2.
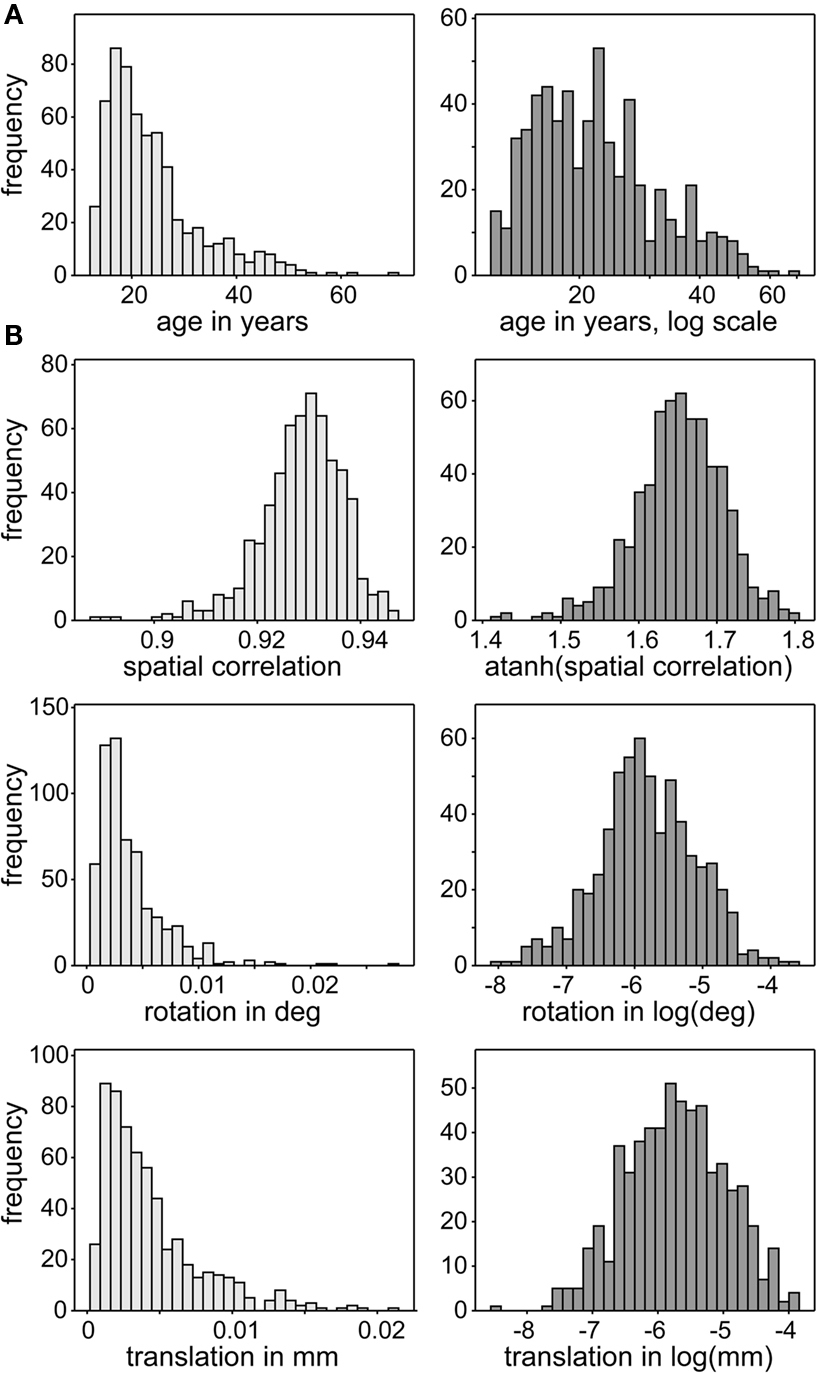
Figure 2. Distributions of continuous covariates of interest (A) and nuisance predictors (B). Distributions of covariates are skewed (light gray, left panels) so are transformed to have more symmetric distributions (dark gray, right panels). This reduces disproportionate influence of more extreme observations on the MANCOVA and univariate model fits.
In general, covariates of interest were not strongly associated with nuisance predictors. No significant correlations were observed between (transformed) age and translation (r = −0.02; p > 0.69), rotation (r = −0.04; p > 0.27), or spatial normalization (r = 0.01; p > 0.80). Genders did not show a difference in translation (t601 = 1.25; p > 0.20) or rotation (t601 = 1.22; p > 0.20), but showed a slight difference in spatial normalization (t601 = 2.53; p < 0.01), with females having higher correlations to the EPI template than males. Accurate estimation of model coefficients is unlikely to be affected by the relatively low correlation between these columns in the design matrix (r = 0.10).
In follow-up analyses, we also considered GMC (averaged over each component region) as a predictor variable. However, because GMC and age were highly negatively correlated over all regions (r ≈ −0.7, Figure A2A), we used a modified approach to disambiguate the predictive power of these covariates (see Appendix C) and did not include GMC in our standard design matrix.
2.6.3 Response variables
For each of i = 1, …, M subjects, we have c = 1, …, C1 power spectra (Pic), c = 1, …, C1 SMs (Sic), and a single vector of FNC correlations (Ki). Each of these response variables is modeled separately. Prior to modeling, response variables are transformed and dimension-reduced, as simulations suggest that these steps optimize model selection (see Appendix D and Figure A3). Spectra are element-wise log-transformed, which is useful because it normalizes the highly skewed power distribution and facilitates dimension estimation with minimum description length (MDL) in the next step. Similarly, FNC correlations are Fisher-transformed [z = atanh(k)]. Response matrices are then formed by concatenation of the subject response vectors: 
 and
and 
Because of the large number of columns of each response matrix, and because of autoregressive correlation structure between columns, we perform a PCA dimension reduction on each matrix. For dimension reduction, we use MDL to estimate the “true” number of dimensions, u. Let  be the dimension-reduced matrix of power spectra, keeping the first u PCs, with
  and K* defined similarly. Over the C1 components, spectra with 129 frequency bins were reduced to a range of 25–27 dimensions. SMs with 2000–6000 voxels were reduced to 10–25 dimensions, and the FNC matrix with 378 pairwise correlations was reduced to 31 dimensions.
2.6.4 Backward selection
In this section, we describe model selection in terms of the spectra; the procedure is identical for SM and FNC response matrices. For each of the C1 components, the MANCOVA model predicting spectral power is  where
where  is the M × u response matrix, D is the design matrix, B is the matrix of regression coefficients, and E is the matrix of errors. Backward selection is implemented in mStepwise from the MANCOVAN toolbox6. Each step performs an F-test using the Wilks’ Lambda likelihood ratio test statistic (Christensen, 2001) comparing the current full model with each reduced model, defined by removing one column of the current D and the associated interactions, if present. The F-test evaluates whether the associated row(s) of B are simultaneously equal to zero. When all reduced models have been assessed, the term associated with the least significant reduced model (largest p-value) is removed from the design matrix, and this reduced model becomes our full model in the next iteration. The final reduced model, Dr, has all terms not associated with higher-order interactions significant at α = 0.01. Note that reduced models are independently selected for each response matrix, i.e.,
  and
and  , for c = 1, …, C1, and K*.
There are criticisms of stepwise selection methods, including that redundant (or correlated) predictors can adversely affect model selection and that resulting models have an inflated risk of capturing chance features of the data (Mantel, 1970; Henderson and Velleman, 1981; Judd et al., 1989; Derksen and Keselman, 1992). We minimize the potential negative impact a stepwise procedure can have on a resulting model by carefully considering a small full model (for example, not blindly including all pairwise interactions or higher-order terms), by performing only backward selection for the fewest model comparisons, and by not including highly correlated predictors of interest (see Appendix C and Figure A2). Simulations evaluating the performance of backward selection on spectra-like data show that it typically identifies the correct model (see Appendix D and Figure A3) suggesting that backward selection of a well-considered full model is an effective heuristic for model selection.
2.6.5 Univariate tests
At last, we wish to discover which spectral bins, SM voxels, or FNC correlations are associated with gender and age. Given the reduced model terms, univariate models are fit to the original (not dimension-reduced) response data,  to test the association with gender and age (Figure 1, step 5). Associations are visualized by plotting the log of the p-value with the sign of the associated t-statistic, −sign(t) log10(p), which provides information on both the directionally and statistical strength of the result. Univariate tests were corrected for multiple comparisons at an α = 0.01 significance level using false discovery rate (FDR; Genovese et al., 2002). We calculate partial correlation coefficients to measure the strength of the linear relationship between two variables [e.g., log(power) and log(age)] after adjusting for other predictors (the remaining regressors in the model). This is calculated as the correlation between the residualized variables, obtained by fitting models between the remaining predictors and each of the variables as response vectors (Christensen, 1996). For visualization, scatter plots display the response adjusted for nuisance predictors, where the fitted nuisance terms of the model are subtracted from the response vector.
3 Results
We performed a 75-component GICA using resting-state fMRI data from 603 healthy participants. Demographic information for these subjects is provided in Table 1. Each of the 75-components had a cluster quality index greater than 0.8, indicating a highly stable ICA decomposition. Based on visual inspection of SMs and power spectra, we identified 35 components as ventricular, vascular, susceptibility or motion-related artifacts, 28 components as RSNs, and 12 components as mixed, representing a mixture of RSNs and artifactual sources (see Figure 3 and Section 2 for details). The set of mixed components is composed of networks with activation in subcortical regions (e.g., thalamus and caudate) that extends into neighboring ventricles, cerebellar components showing spatial overlap with sinuses, and components at frontal and occipital poles contaminated by motion. To reduce the likelihood of spurious results, only components classified as RSNs are considered further.
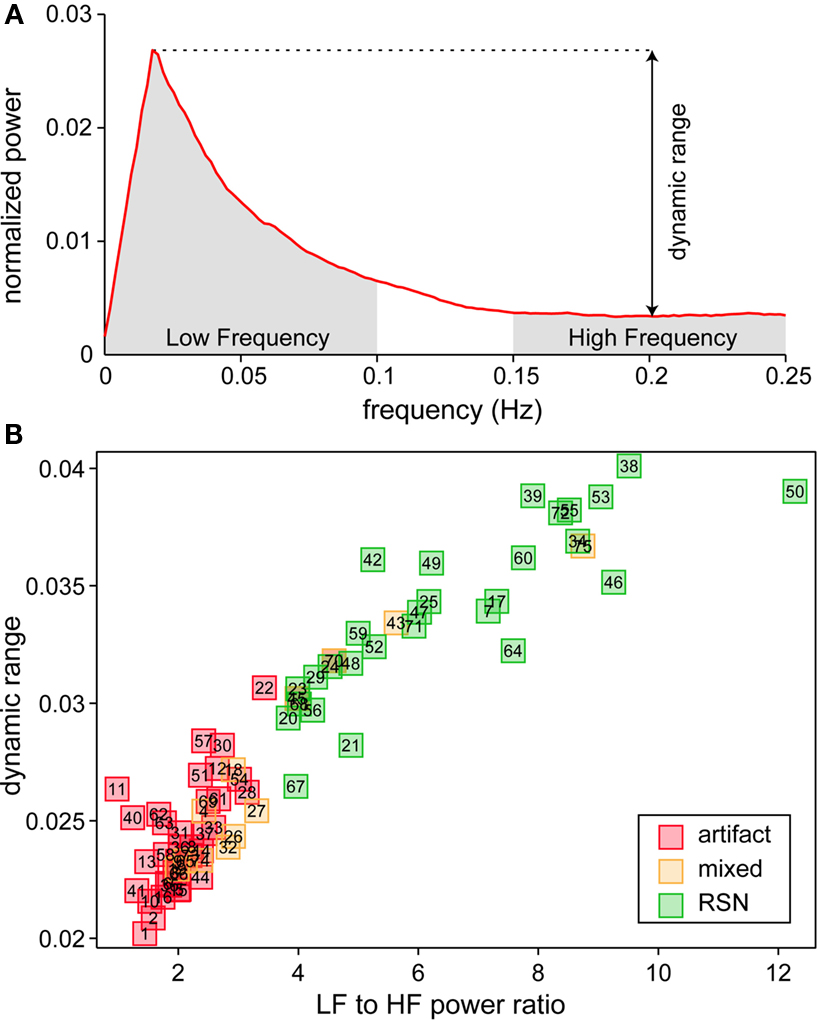
Figure 3. Spectral characteristics of component TCs. (A) Average power spectrum of independent component (IC) 52 illustrating the features used to compute dynamic range and low frequency (LF) to high frequency (HF) power ratio. (B) Scatter plot of LF to HF power ratio versus dynamic range for all components. Along with spectral characteristics, SMs were used to categorize components as RSNs (green), artifacts (red) or mixture of the two (yellow).
3.1 Resting-State Networks
Spatial maps of the 28 selected RSNs are shown in Figure 4A. Coordinates of their peak activations are provided in Table 2. The observed networks are similar to those identified previously with low model order ICA (roughly 20 components; Beckmann et al., 2005; Damoiseaux et al., 2006; Calhoun et al., 2008a; Smith et al., 2009) and nearly identical to those identified using high model order (roughly 70 components; Kiviniemi et al., 2009; Smith et al., 2009; Abou-Elseoud et al., 2010). For this reason, we describe the RSNs only briefly here, and provide citations to more comprehensive references.
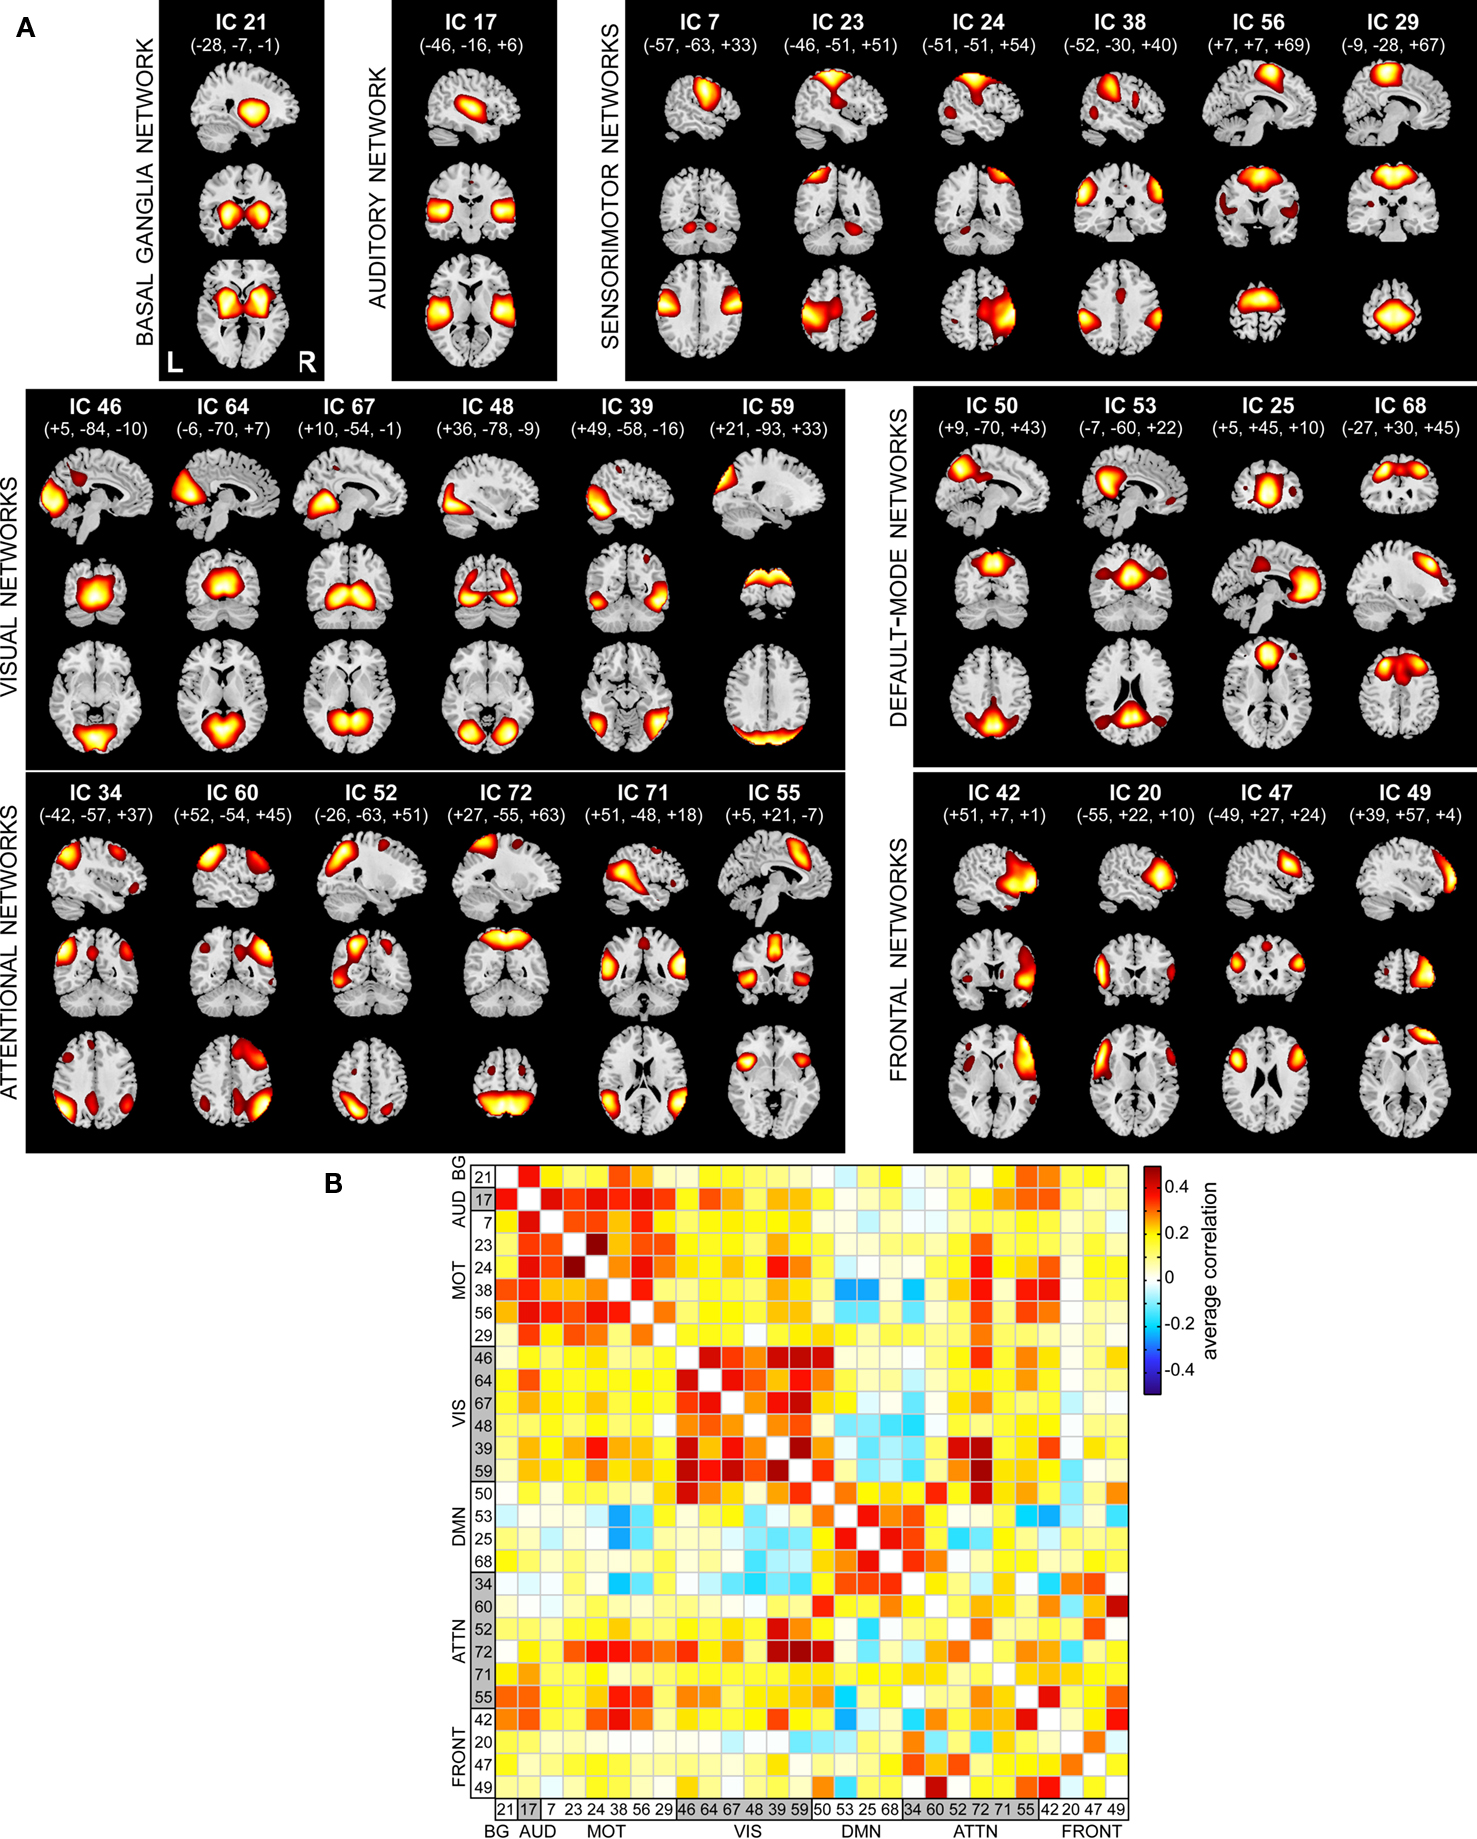
Figure 4. Functional connectivity within and between RSNs. (A) SMs of the 28 components identified as RSNs. SMs are plotted as t-statistics, thresholded at tc > μc + 4σc (see Appendix B), and are displayed at the three most informative slices. RSNs are divided into groups based on their anatomical and functional properties and include basal ganglia (BG), auditory (AUD), sensorimotor (MOT), visual (VIS), default-mode (DMN), attentional (ATTN), and frontal (FRONT) networks. (B) Functional network connectivity matrix. Pairwise correlations between RSN TCs were Fisher z-transformed and averaged across subjects, then inverse z-transformed for display.
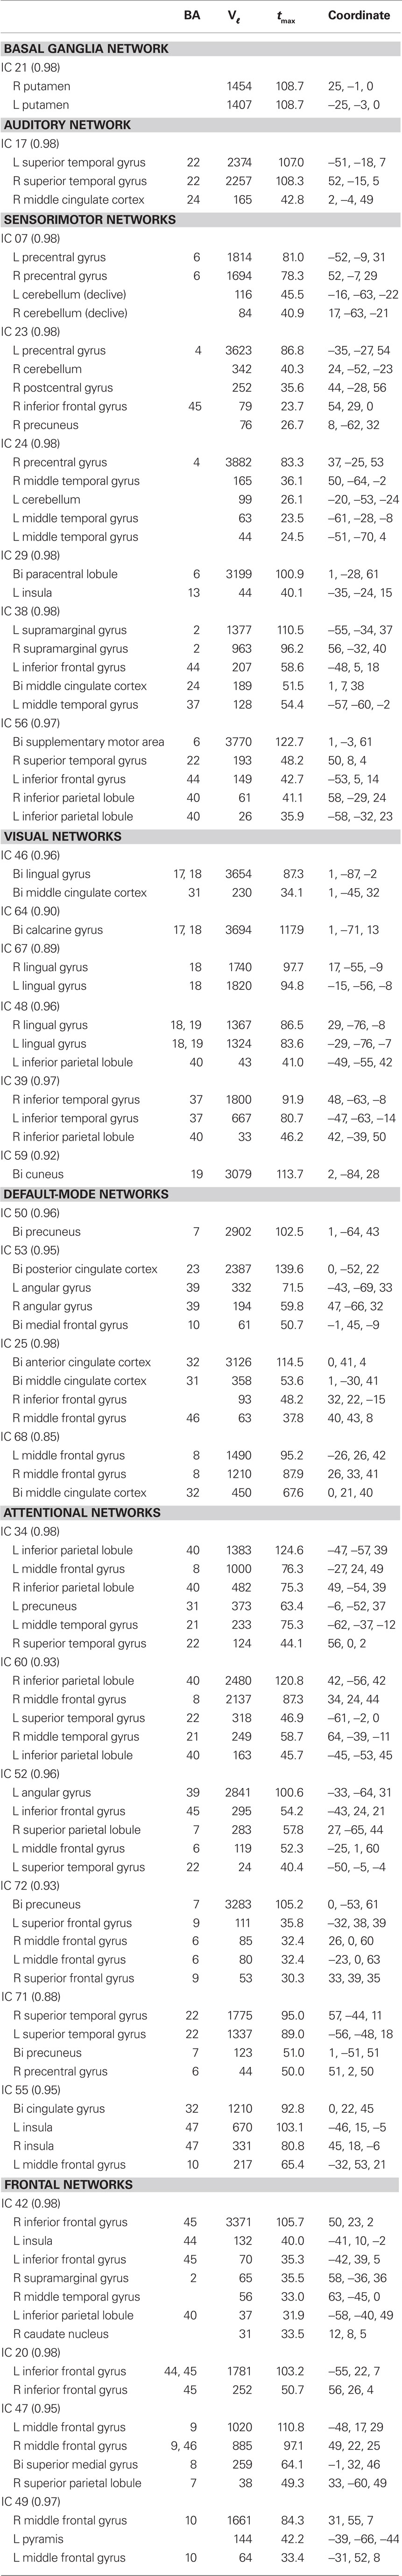
Table 2. Peak activations of RSN SMs. The quality index (Iq) associated with each RSN is listed in parentheses adjacent to the component number. BA, Brodmann area; Vℓ, number of voxels in each cluster; tmax, maximum t-statistic in each cluster; Coordinate, coordinate (in mm) of tmax in MNI space, following LPI convention.
Resting-state networks are grouped by their anatomical and functional properties. The BG are represented by a single component (IC 21) with activation focused in the putamen and pallidum (Robinson et al., 2009; Ystad et al., 2010). IC 17 forms a rather prototypical representation of the large parts of the auditory system (AUD), including bilateral activation of the superior temporal gyrus, superior temporal sulcus, and middle temporal gyrus (Seifritz et al., 2002; Specht and Reul, 2003). Motor and somatosensory functions (MOT) are captured by six components (ICs 7, 23, 24, 38, 56, and 29) situated in the vicinity of the central sulcus. Similar to previous studies (Krienen and Buckner, 2009; Abou-Elseoud et al., 2010), we find corresponding cerebellar coactivation in bilateral and lateralized networks. The visual system (VIS) is also represented by six components (ICs 46, 64, 67, 48, 39, and 59) in good agreement with the anatomical and functional delineations of occipital cortex (Grill-Spector and Malach, 2004). The DMN is captured in four components, separating the full map reported initially by Raichle et al. (2001) along the anterior-posterior and inferior-superior axes (Buckner et al., 2008; Harrison et al., 2008). We classify several RSNs known to be involved in directing and monitoring behavior as attentional networks (ATTN). These include lateralized fronto-parietal networks (IC 34 and 60) similar to the ventral attention network (Corbetta and Shulman, 2002; Vincent et al., 2008), a parietal and frontal-eye field network (IC 52) reminiscent of the dorsal attention network (Corbetta and Shulman, 2002), a component centered in the central and anterior precuneus (IC 72) which is implicated in directing attention (Cavanna and Trimble, 2006; Margulies et al., 2009), a bilateral component focused at the temporo-parietal junction (IC 71) and overlapping the alerting system (Fan et al., 2005), and an anterior cingulate and insular network (IC 55) observed to activate during demanding tasks and conflict processing (Ridderinkhof et al., 2004; Klein et al., 2007; Eichele et al., 2008). Finally, we observe a number of frontal networks (FRONT; ICs 42, 20, 47, and 49) known to mediate executive as well as memory and language functions (Koechlin et al., 2003; Koechlin and Summerfield, 2007). Consistent with previous findings (Krienen and Buckner, 2009), we observe coactivation between medial prefrontal cortex and the contralateral cerebellum (IC 49). We note that a similar fronto-cerebellar network was observed as the bilateral homologue of IC 49, however this component (IC 18) was not classified as an RSN due to contamination with motion.
Functional connectivity between RSNs is presented in Figure 4B. Correlations between component TCs reveal patterns of connectivity highly consistent with known functional relationships. For example, clusters of positive correlations correspond to greater connectivity within functional domains, and negative correlations between DMN components and sensory-related networks reflect the natural opposition of these systems as attention drifts between external and internal mental states (Buckner et al., 2008).
3.2 Multivariate Results
We applied a multivariate model selection strategy to determine the effects of age and gender on RSN power spectra, SMs, and FNC while accounting for variance associated with nuisance regressors. Results from the multivariate analysis are displayed in Figure 5, which provides the significance of model terms gender, log(age), their interaction, and several nuisance parameters related to motion and spatial normalization in predicting response variables for all RSNs. Darker colors correspond to more significant effects, while white squares indicate terms that were not retained in the backward selection process (α = 0.01). Gender was found to be mildly significant for a few of the spectra and slightly more significant for some of the SMs. Age was found to be highly significant in all models. Interestingly, the interaction term between age and gender was never retained in the backward selection process, suggesting that the effects of age are somewhat equivalent between genders for the age range and response variables investigated here. It should also be noted that either translation or rotation were retained in most models, meaning that these terms consistently accounted for significant variability in the outcome measures. This indicates considerable motion contamination of RSN SMs and, particularly, TCs, and strongly supports the incorporation of motion-related regressors to improve the estimates related to the covariates of interest.
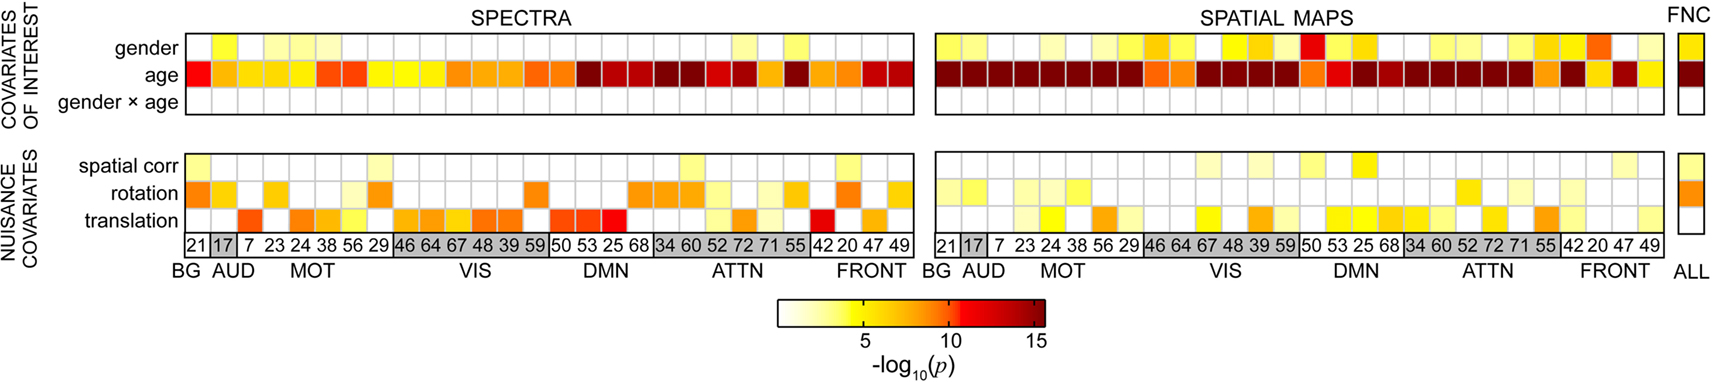
Figure 5. Results from the reduced MANCOVA models, depicting the significance of covariates of interest (top) and nuisance predictors (bottom) for power spectra (left), SMs (middle), and the FNC matrix (right) in log10(p) units. White cells indicate terms that were removed from the full model during backward selection process. Note that the term labels refer to continuous covariates following normalizing transformations (e.g., log(age); see Figure 2). Also note that the range of log10(p) is limited by computational precision. In our analysis, epsilon is 2−52, which corresponds to a maximal −log10(p) value of 15.65.
3.3 Univariate Results
The strength of a multivariate selection process is its ability to identify which covariates are important when each separate response vector (power spectrum, SM, or FNC matrix) is considered as a whole. The multivariate results of dimension-reduced responses, however, are difficult to interpret. Thus, we performed univariate tests on each of the covariates of interest retained in the final model to understand the nature and extent of the relationship between these variables and RSN properties.
3.3.1 Power spectra
Univariate results summarizing the effects of age on RSN power spectra are shown in Figure 6A. We observe a decrease in low frequency power with age across all RSNs (Figure 6A1). Significant effects are found primarily between 0 and 0.15 Hz, consistent with the frequency range over which synchronous fluctuations between brain regions are detected (Cordes et al., 2000; Sun et al., 2004). Age-related reductions in spectral power are slightly more significant in attentional and DMN components, however the rate of decrease is fairly consistent over networks (Figure 6A2), suggesting that a single process underlies these somewhat global trends.
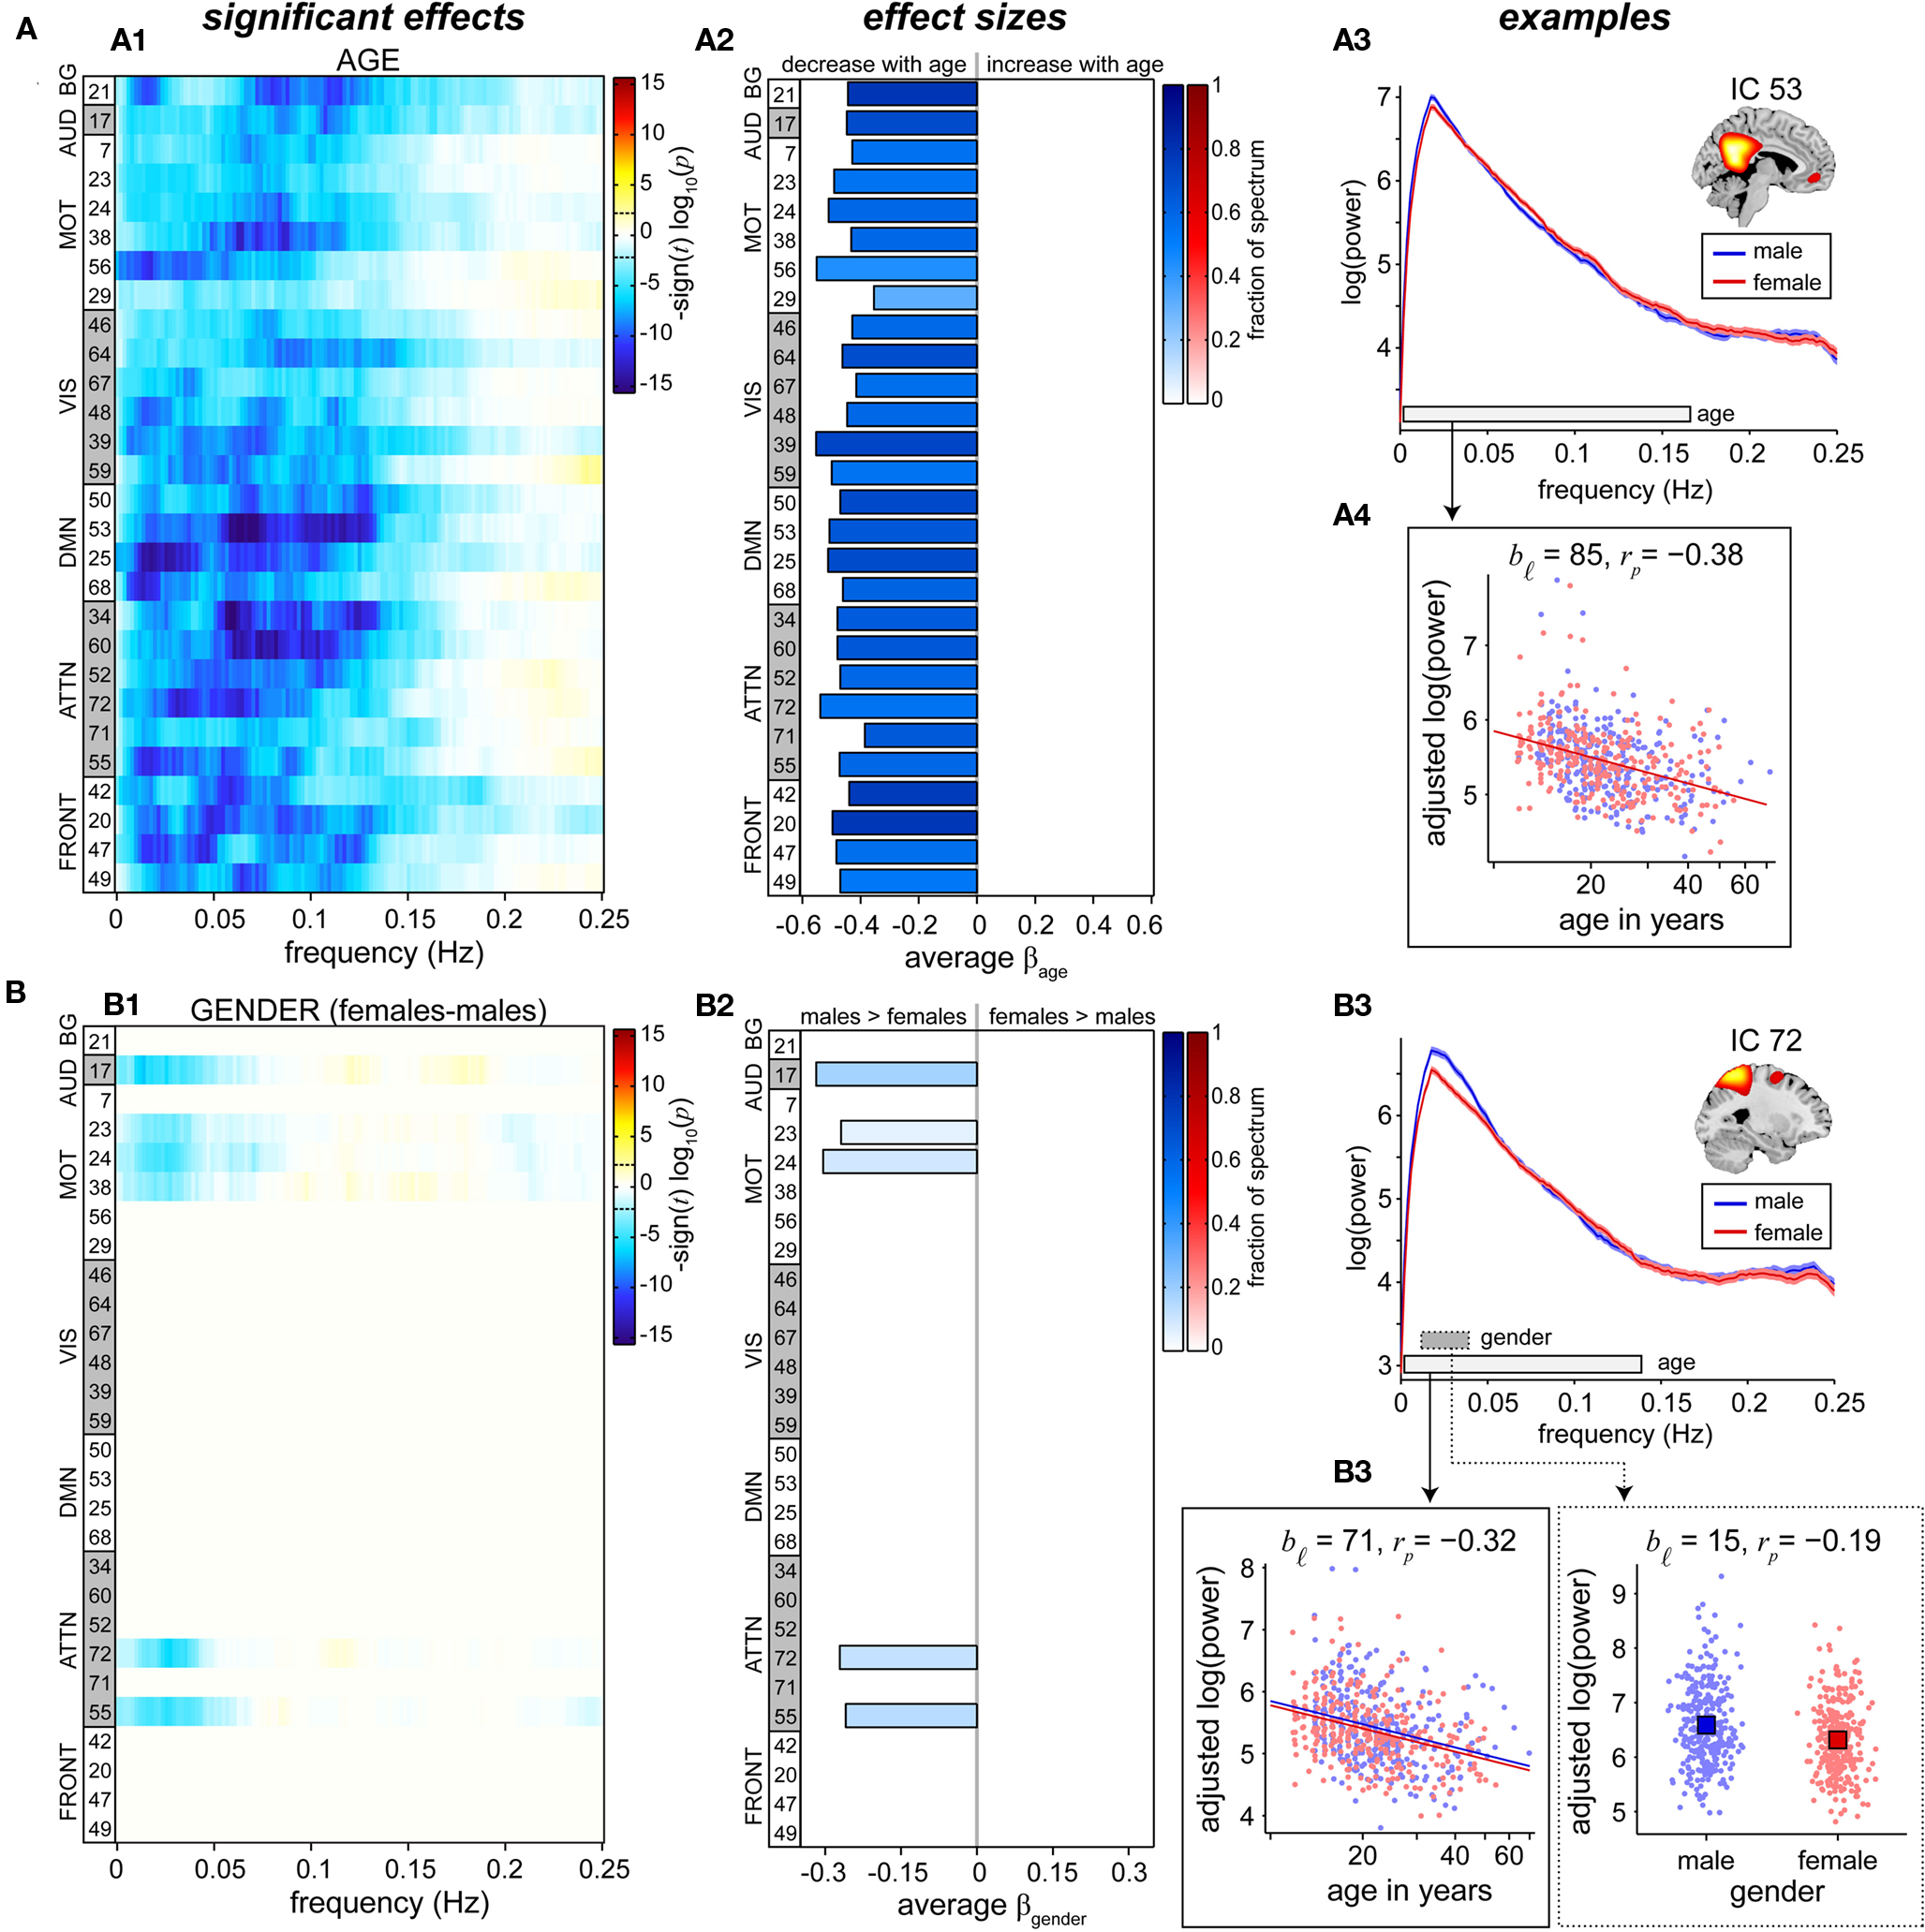
Figure 6. Univariate test results showing the effects of age (A) and gender (B) on power spectra. Univariate tests were performed only on covariates of interest retained in the reduced MANCOVA model (Figure 5). Left panels (A1,B1) depict the significance and direction of age (A) and gender (B) terms as a function of frequency for each component, displayed as the −sign(t)log10(p). Dashed horizontal lines on the colorbar designate the FDR-corrected threshold (α = 0.01). Middle panels (A2,B2) show bar plots of the average β-values for age (A) and gender (B) terms. β-Values were averaged over frequency bands with effects of the same directionality where test statistics exceeded the FDR threshold. The color of the bar is proportional to the fraction of contributing frequency bins; the absence of a bar indicates that univariate tests were not performed or test statistics were not significant. Right panels show examples of components with a sole age effect (A, IC 53, posterior DMN) and both age and gender effects (B, IC 72, precuneus). Line plots of the power spectra (A3,B3) show the mean log(power) ± 1 SE for males (blue) and females (red). Horizontal bars on the frequency axis denote bands with significant effects for age (white bar, solid line) and gender (gray bar, dotted line), and correspond to the range over which log(power) was averaged in the scatter plots. Scatter plots (A4, B4) show the covariate of interest versus log(power) after adjusting for nuisance regressors and age (for gender effects). The model fit is shown by colored lines and squares for age and gender, respectively. We indicate the number of frequency bins contributing to the data displayed (bℓ) and the partial correlation coefficient (rp) between the covariate of interest and log(power).
Given the profound structural changes that occur with age (Good et al., 2001; Sowell et al., 2003; Østby et al., 2009; Tamnes et al., 2010), we performed additional analyses to address the extent to which decreases in low frequency power could be explained by decreases in GMC (see Appendix C). These analyses demonstrated that age has more explanatory power over and above that of GMC than GMC has over and above that of age (Figure A2B), meaning that age is a better predictor of spectral power than GMC. While this could be due to the error associated with measuring and computing local GMC, it may also imply that age includes information related not only to gray matter but also other factors, such as vascular compliance or degree of neural activation, that are related to differences in RSN spectral power.
Information regarding the effects of gender on spectral power is displayed in Figure 6B. Gender differences are found in only a few sensorimotor and attention-related RSNs and indicate slightly greater spectral power in males than females at very low frequencies (<0.05 Hz). Effects of gender are considerably smaller than those observed for age, both in terms of the test statistics at individual frequency bins and the fraction of the spectrum showing significant effects (Figures 6B1,B2).
Typical examples of the relationships between spectral power and the covariates of interest are shown in the rightmost panels of Figure 6. IC 53, representing the “core” of the posterior DMN, shows no difference with regard to gender (Figure 6A3, as expected from the multivariate results in Figure 5), and a fairly linear relationship between log(age) and log(power; Figure 6A4). The partial correlation coefficient, rp = −0.38, is related to the variance accounted for by log(age) that is not accounted for by other regressors and indicates modest explanatory power. IC 72, composed largely of the central and anterior precuneus, shows a similar relationship with age and an additional gender effect (Figures 6B3,B4). Though the gender difference is statistically significant, distributions of power for males and females are highly overlapping and the gender term accounts for a relatively small portion of the response variance (Figure 6B4, right panel, rp = −0.19). For both IC 53 and IC 72, close inspection of the scatter plots between log(age) and log(power) reveals that decreases in power do not begin until roughly 15 or 16 years of age, with power staying approximately constant or possibly showing a slight increase between 12 and 15 years. This trend, which was observed in additional RSNs, suggests a more complex relationship between age and spectral power during development (see Section 4).
3.3.2 Spatial maps
The effects of age on SM intensities are summarized in Figure 7A. Significant age-related decreases were observed in all RSNs and extend across large areas of cortex. Decreases were particularly pronounced (with regard to significance and rate of change) in several motor networks, frontal regions, and the precuneus (Figures 7A1,A2). Increases in SM intensity with age were found in a few sensory-related components, however only the BG network (IC 21) showed this effect in large clusters comprising a substantial portion of the component. Additional analyses investigating the contribution of GMC to the changes in SM intensities again suggested that age has more explanatory power than GMC (Figure A2C).
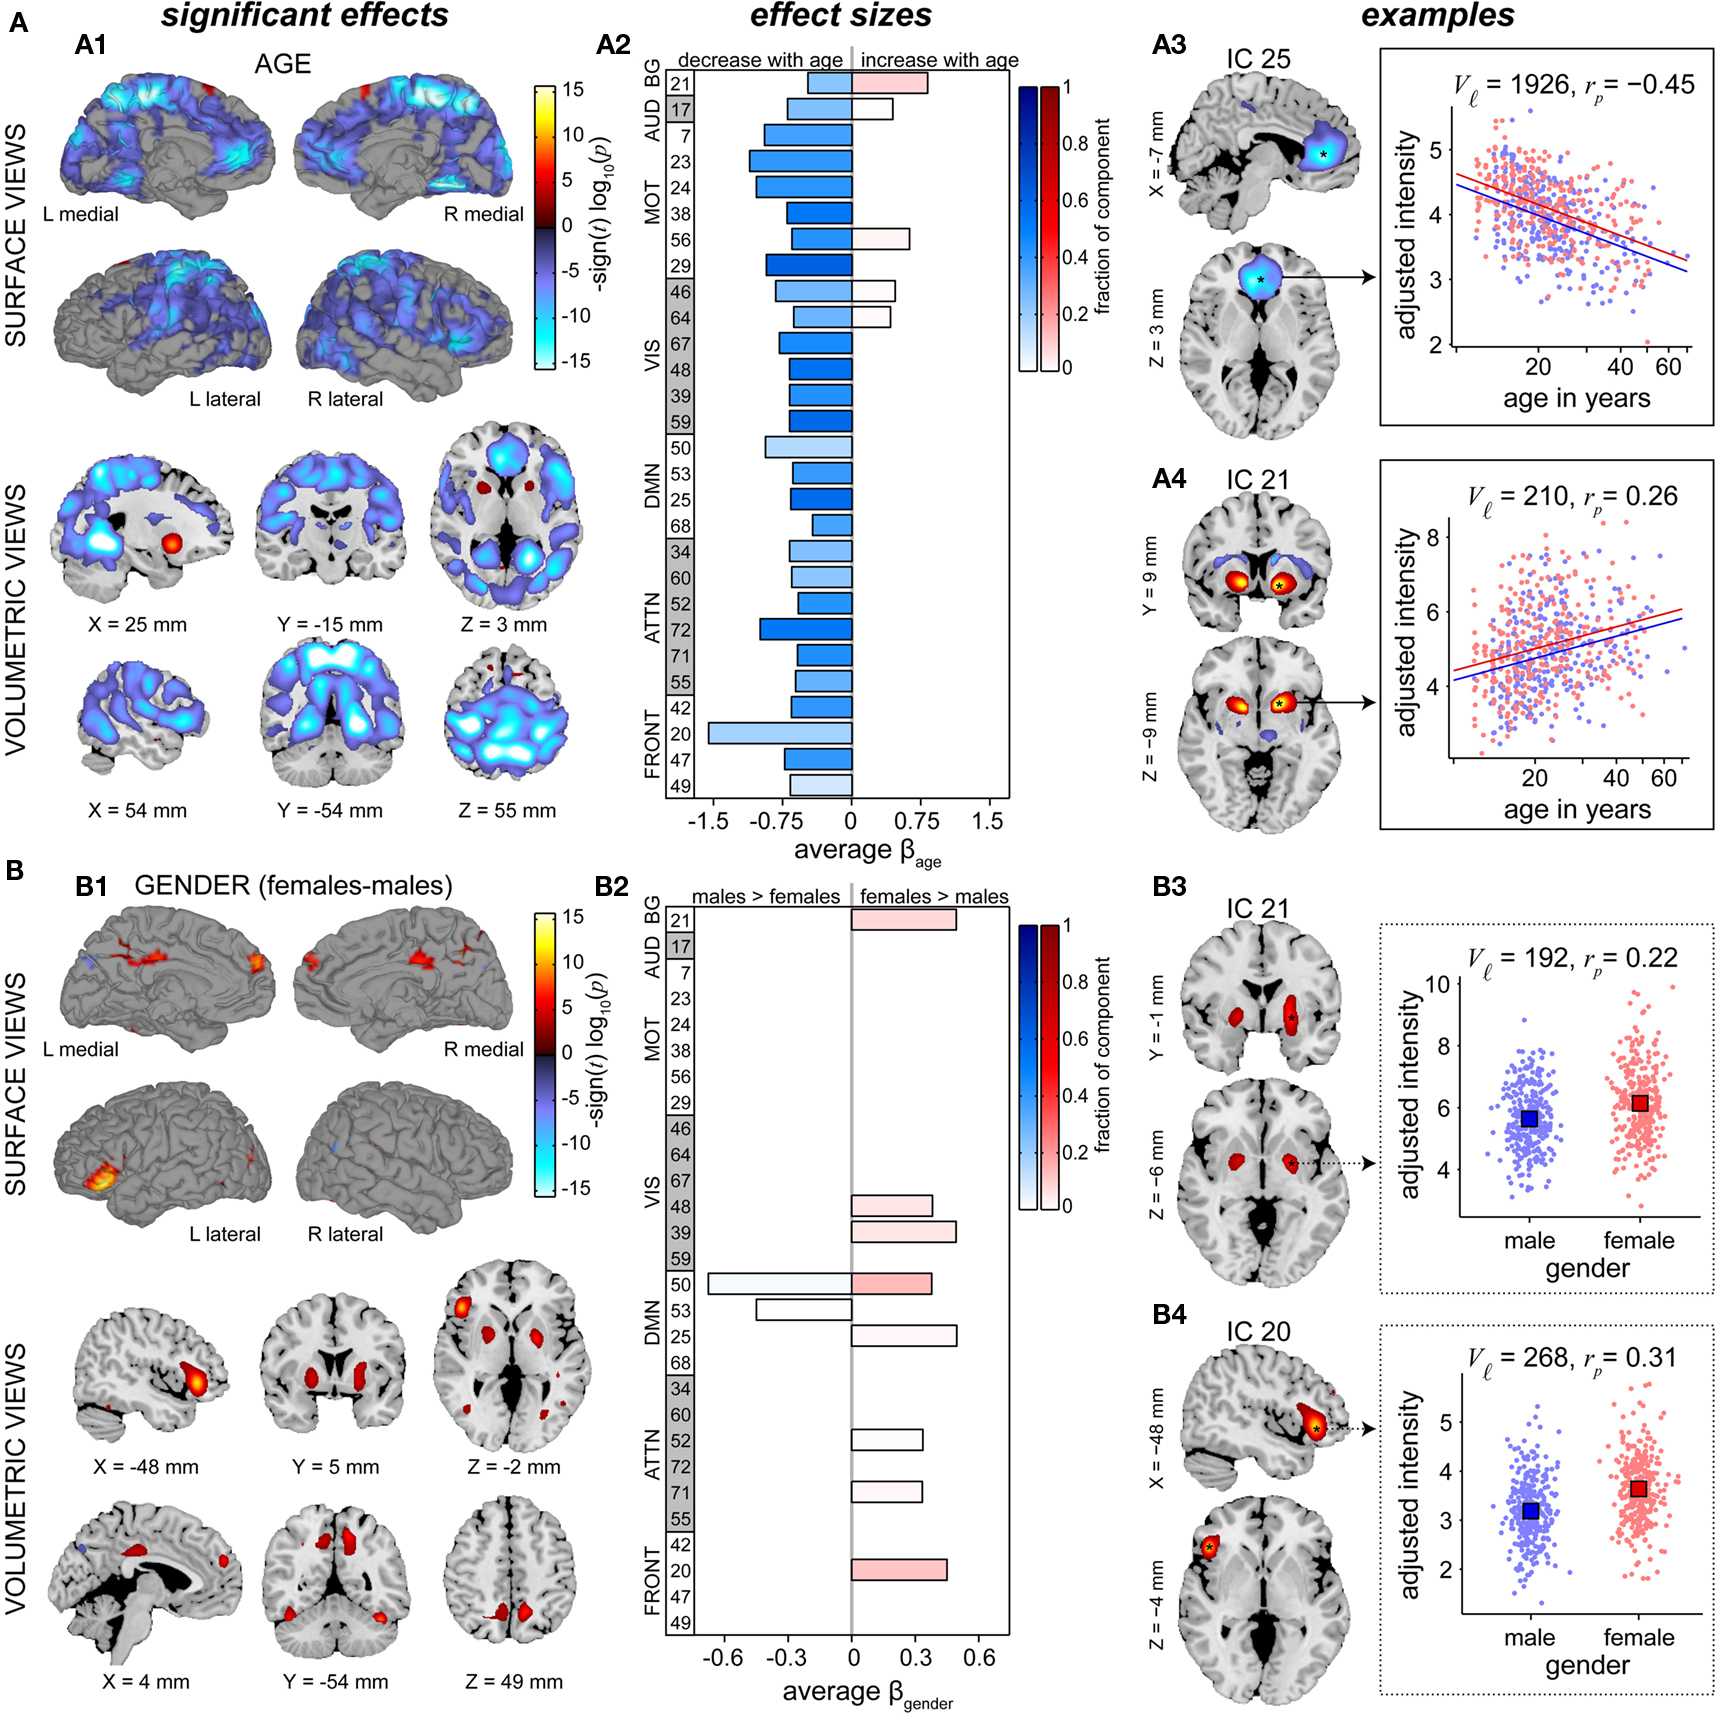
Figure 7. Univariate test results showing the effects age (A) and gender (B) on SMs, in a similar format to Figure 6. Left panels (A1,B1) show surface and volumetric maps depicting composite renderings of significant effects over all RSNs, displayed as the −sign(t)log10(p). Effects are considered significant if test statistics exceeded the FDR threshold (α = 0.01) with a cluster extent of at least 27 contiguous voxels. Middle panels (A2,B2) show bar plots of the average β-values for the age (A2) and gender (B2) terms. β-Values were averaged over significant clusters with effects of the same directionality and the color of the bar is proportional to the fraction of component voxels contributing to each effect. Right panels show examples of components with age effects (A3: IC 25, anterior DMN, and A4: IC 21, basal ganglia,) and gender effects (B3: IC 21, basal ganglia, and B4: IC 20, left IFG). Scatter plots show the effects for a single significant cluster (indicated by asterisks in the −sign(t) log10(p) maps), with the number of contributing voxels indicated on each plot (Vℓ).
In Figure 7A, right panels, we show examples of regions with age-related decreases (IC 25, centered in anterior cingulate cortex) and increases (IC 21, putamen) in SM intensity. Note that both these regions also showed slight gender effects, seen in the different intercepts of the regression lines for males and females. For IC 25, the relationship between log(age) and intensity (Figure 7A3) is approximately linear and the partial correlation coefficient (rp = −0.45) indicates moderate explanatory ability. For IC 21, the scatter plot (Figure 7A4) suggests a positive linear relationship between log(age) and intensity at younger ages (roughly 12–27 years) that flattens or even decreases after 30 years of age. This pattern again implies the presence of more complex relationships between age and functional connectivity that should be investigated in future studies.
Figure 7B describes differences in SMs with regard to gender. Similar to the results for power spectra, gender effects are weaker and more sparse than those observed for age. We find evidence of gender effects in both directions (i.e., males > females and males < females), however the majority of regions passing significance and those with the largest spatial extents show greater intensity in females (Figures 7B1,B2). Examples of the most pronounced gender effects are shown in Figures 7B3,B4, indicating slightly greater SM intensity in females than in males centered within the bilateral globus pallidus (IC 21) and left IFG (IC 20). As before, the distributions of intensity largely overlap between genders and the partial correlation coefficients (rp = 0.22 and rp = 0.31 for IC 21 and IC 20, respectively) suggest relatively low explanatory power.
3.3.3 Functional network connectivity
Figure 8 shows differences in FNC related to age and gender. The majority of between-network correlations decrease with age, and significant reductions appear to largely involve motor and attention networks (Figure 8A1). In particular, the supplementary motor area (IC 56) and precuneus (IC 72), two of the brain’s most interconnected regions (Hagmann et al., 2008; Gong et al., 2009), exhibit decreased correlations with a large number of other RSNs as a function of age. Gender-related differences in FNC are less significant than those observed for age, but show a consistent pattern of slightly greater correlations in males than females for connections involving motor networks (Figure 8B1). This is true for correlations between components within the motor system, for example IC 24 (right sensorimotor cortex) and IC 7 (bilateral precentral gyri), and between motor RSN and other sensory-related networks, for example IC 24 and IC 17 (auditory cortex). Examples of age and gender effects on FNC correlations are displayed in Figures 8A2,B2. Correlation magnitude between IC 38 (bilateral postcentral gyri) and IC 56 (supplementary motor area) decreases very slightly with age (rp = −0.20), and shows no difference with regard to gender (Figure 8A2). Correlations between IC 24 (right sensorimotor cortex) and IC 72 (precuneus) reveal a similar trend with age (rp = −0.19) and a very modest gender difference with males showing slightly stronger correlations than females (rp = −0.15)(Figure 8B2). These effects are noticeably weaker than those found in spectra and SMs (see Figures 6 and 7), suggesting that functional connectivity between regions may be less affected by age and gender than connectivity within regions.
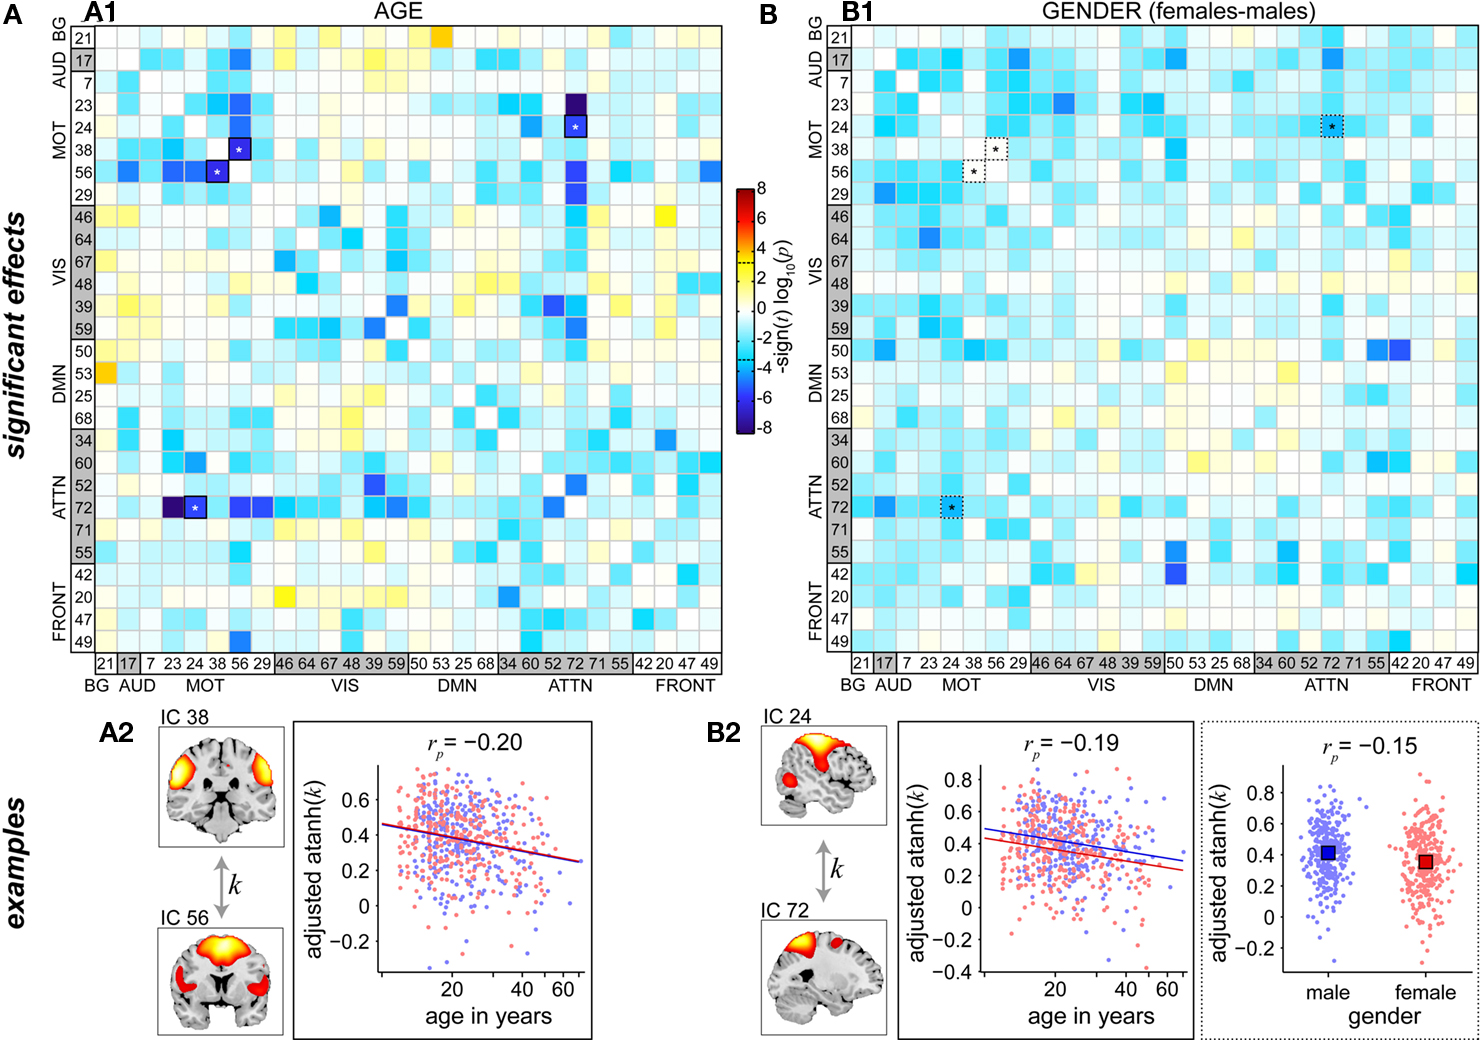
Figure 8. Univariate test results showing the effects age (A) and gender (B) on FNC, in a similar format to Figure 6. Top panels depict the significance and direction of age (A1) and gender (B1) terms for each pairwise correlation, displayed as the −sign(t)log10(p). Dashed horizontal lines on the colorbar designate the FDR-corrected threshold (α = 0.01). Bottom panels show examples of age effects (A2, temporal correlation (k) between motor RSNs IC 38 and IC 56) and both age and gender effects (B2, between motor RSN IC 24 and precuneus RSN IC 72). FNC examples are highlighted in panels (A1,B1) by asterisks.
4 Discussion
In the present study, we used a high model order ICA decomposition of resting-state functional imaging data to delineate a set of RSNs on a very large sample (n = 603). We outlined a framework to systematically analyze such high-dimensional datasets and estimated the effects of age and gender on the connectivity properties of RSNs. We discuss the findings of each of these steps and their relevance to the current literature in turn.
4.1 Resting-State Networks
Similar to recent reports, we found that high model order ICA yielded extremely stable sources with sufficient spatial segregation of functional regions (Kiviniemi et al., 2009; Smith et al., 2009; Abou-Elseoud et al., 2010; Ystad et al., 2010). From 75 components, we identified 28 RSNs whose peak activation clusters were confined to cortical gray matter that describe direct cortico-cortical axonal pathways, indirect polysynaptic connections, and common feed-forward projections among cortical, subcortical, and cerebellar structures. These components are highly reminiscent of those described in previous studies regardless of the method of determination (e.g., spatial ICA, tensor ICA, or seed-based correlation), suggesting that they are fundamental components of the human connectome (Damoiseaux et al., 2006; Kiviniemi et al., 2009; Smith et al., 2009; Abou-Elseoud et al., 2010; Van Dijk et al., 2010). An important limitation of the set of RSNs is their breadth. Due to contamination of putative RSNs and artifacts (see Figure 3), we lack “full coverage” of all brain regions. This is particularly problematic for areas neighboring known susceptibility artifacts (orbitofrontal cortex), motion edges (frontal/occipital poles), and ventricles (subcortical nuclei). Future analyses could employ preprocessing steps optimized for subcortical regions (e.g., masking areas not of interest, using a smaller Gaussian smoothing kernel) or potentially use higher model order to better separate artifactual sources. An alternative method to increase coverage is to be less conservative with regard to component selection. Though this is a reasonable approach for a primary analysis identifying and characterizing networks, our ultimate goal is a secondary association analysis thus we chose to err on the side of caution using highly selective criteria.
For the set of RSNs, we further characterized large-scale functional connectivity by computing temporal correlations between networks. Our examination of a large sample of healthy subjects may provide the best estimate of FNC to date, and the structure of the correlation matrix identifies a number of interesting features (see Figure 4). As would be expected, there is strong clustering within functional domains (e.g., VIS, MOT, and DMN), and components within the DMN are anti-correlated with other systems. Note that negative correlations are observed without the application of global mean regression in preprocessing (Murphy et al., 2009; Fox et al., 2009), supporting the interpretation that temporally anti-correlated networks subserve opposing functions (Fox et al., 2005; Fox and Raichle, 2007). We also observe that the precuneus (IC 72) exhibits heterogeneous functional connectivity with numerous components in motor, visual, and attentional systems. This is consistent with recent reports implicating the precuneus as a central core in the cortical anatomical network (Hagmann et al., 2008; Bullmore and Sporns, 2009; Gong et al., 2009; Margulies et al., 2009). Another notable feature is the distinction in connectivity between the left and right fronto-parietal networks (IC 34 and 60, respectively). The left network is positively correlated with the DMNs and anti-correlated with visual and motor networks. In contrast, the right fronto-parietal network shows weak positive correlations with visual and motor components. Disparate behavior of these lateralized networks has been noted previously (Calhoun et al., 2008a; Smith et al., 2009) and corresponds well with task-based findings, which demonstrate that the ventral attentional system involved in stimulus-driven orienting is right-lateralized (Corbetta and Shulman, 2002; He et al., 2007; Vincent et al., 2008), whereas the left fronto-parietal network is more implicated in explicit memory retrieval (Iidaka et al., 2006). Overall, these findings suggest highly distinct functional roles for these networks in a variety of mental states.
4.2 Age and Gender Effects
For our sample of healthy controls largely composed of adolescents and young adults, age accounted for 10–20% of the variance in all investigated properties of resting-state functional connectivity. With the exception of the BG (see below), age-related decreases were observed across all RSNs. These findings are consistent with previous studies focusing on DMN regions, though our examination of a large complement of RSNs suggests that age-related changes are most prominent in motor and attentional networks (Andrews-Hanna et al., 2007; Damoiseaux et al., 2008; Esposito et al., 2008; Koch et al., 2009; Biswal et al., 2010). A near-ubiquitous decrease in functional connectivity across cortex may appear at odds with Biswal et al. (2010), who in a large multi-site investigation report both age-related increases and decreases in connectivity. However, it should be noted that the cortical areas showing increases with age also exhibited negative SM loadings, i.e., were anti-correlated with seed regions or the component TC (e.g., see their Figure 2). Therefore, age-related increases in Biswal et al. (2010) correspond to reductions in the magnitude of anti-correlation, consistent with the notion that network activity decreases with age. In the current study, we confined analysis only to voxels with positive SM loadings, thus the directionality of age-related effects have an unambiguous interpretation.
In our analysis only the bilateral putamen (IC 21) showed pronounced age-related increases in functional connectivity (see Figure 7A). The etiology of this distinction is unclear and certainly warrants future in-depth investigation. It is interesting to note that gray matter volumes in subcortical regions show very different age-related trajectories from those found in cortex (Østby et al., 2009), suggesting that were they evaluated, additional BG and thalamic components would show changes with age that are distinct from the cortical trends. As the methodology to delineate these structures improves, so can investigations into the development of subcortical networks and cortical-subcortical interactions (Robinson et al., 2009; Fair et al., 2010; Ystad et al., 2010).
The specific relationship between age and measures of functional connectivity warrants special attention. As mentioned in the Section 3, inspection of the scatter plots for spectra and SMs suggest that reductions with age in cortical RSNs do not typically start until mid to late adolescence. Furthermore, the relatively linear relationships between log(age) and connectivity measures following adolescence indicate more rapid changes in young adulthood than in late adulthood. These trends are somewhat reminiscent of developmental changes in cortical gray matter (Good et al., 2001; Sowell et al., 2003; Østby et al., 2009; Tamnes et al., 2010), consistent with the notion that structural substrates underlie function (Hagmann et al., 2008). However, as indicated in previous studies and our own analysis (see Figure A2), alterations in functional connectivity cannot be explained by differences in gray matter alone (Damoiseaux et al., 2008; Glahn et al., 2010), and may be better predicted when including changes in white matter tracts and possible interactions. Future studies should examine changes in functional connectivity while considering the underlying structure and be designed specifically to probe developmental and transitional periods. Regression models might also incorporate higher-order age terms to capture curvature and non-monotonic trends which have been found previously (Szaflarski et al., 2006; Kelly et al., 2009; Stevens et al., 2009). It is also important to note that cross-sectional analyses, such as those used here, can reduce sensitivity to estimate trajectories and may increase bias; future studies should consider a longitudinal approach to alleviate these issues (Kraemer et al., 2000).
An important consideration for interpreting age-related effects in functional connectivity measures, particularly power spectra, is the influence of non-neural factors. Changes in the BOLD signal are a function of complex metabolic and vascular reactions and are only indirectly related to changes in resting-state neural activity (Schölvinck et al., 2010). The magnitude of spontaneous fluctuations and stimulus-evoked responses is affected by a multitude of physiological variables (e.g., baseline levels of blood flow, vascular compliance, cardiac and respiratory rhythms) that are known to change with age and therefore preclude a full interpretation of age-related findings (D’Esposito et al., 2003; Birn et al., 2006, 2008; Ances et al., 2009). In our analysis, the influence of non-neural factors may be mitigated by the use of an ICA framework, which appears to partially separate physiological noise sources at higher model orders (Birn et al., 2008; Beall and Lowe, 2010; Starck et al., 2010), however there is almost certainly some remaining contribution of non-neural variables to the age-related trends in functional connectivity measures. In an effort to assess the magnitude of this contribution, we performed additional statistical analyses on the power spectra and SMs of vascular, ventricular and white matter regions, as detailed in Appendix E. As expected, age was found to be a significant predictor for nearly all vascular compartments and tissue types, but based on the size of the observed effects these results suggest at least a partial neural origin for age-related findings in power spectra and a likely neural origin in SMs. Note, however, that without direct measurements or the concurrent use of additional non-invasive techniques such as EEG (Whitford et al., 2007), NIRS (Huppert et al., 2006), or calibrated-fMRI (Ances et al., 2009), it is generally not feasible to fully dissociate neural from confounding physiological factors. We further note that regardless of their etiology, our study demonstrates robust age-related effects in functional connectivity measures that must be considered in future analyses, even when the age range across subjects is relatively narrow (e.g., 20–30 years).
Compared to age, gender differences in functional connectivity were smaller (accounting for between 5 and 15 percent of response variance) and confined to fewer areas. Despite relatively small effects, we note that the inclusion of gender and appropriate interaction terms in regression models may be critical for discovering and interpreting the effects of other covariates, particularly when investigating complex phenotypes such as general intelligence (Haier et al., 2005; Schmithorst and Holland, 2006, 2007). Similar to previous studies, we found evidence for greater connectivity in females versus males within DMN regions (Bluhm et al., 2008; Biswal et al., 2010), though these effects were not nearly as pronounced as those in the left IFG or bilateral BG. Gender differences in the left IFG (Broca’s area) are consistent with earlier reports showing increased GMC in the same region for females (Good et al., 2001; Luders et al., 2005). Given the importance of the left IFG in various aspects of speech generation (for review see Bookheimer, 2002), the difference likely reflects gender distinctions in the use or organization of language networks at rest. It is possible that the observed increases in GMC and functional connectivity relate to a slight enhancement of language skills in adult females (Weiss et al., 2003), though the existence and extent of this gender difference is debated (Wallentin, 2009). Regardless, our results motivate further investigation into the relationship between verbal fluency and resting-state activity in language networks (Hampson et al., 2002, 2006). Gender differences in the BG centered at the pallidum appear to be a novel finding and it is not clear why this network might be more coherent in females. Sexual dimorphisms in the structural aspects of the BG are found throughout development (Good et al., 2001; Luders et al., 2009), and further examination of gender-specific function in these regions is warranted. Gender differences were also observed in FNC and spectral power within the motor and sensory systems, where males showed increases relative to females. A greater level of basal activity in motor networks, as well as greater coactivation between different networks, may be related to increased use and coordination between these systems, as suggested by recent studies of motor learning and functional connectivity (Albert et al., 2009; Xiong et al., 2009). Alternatively, this distinction may reflect an inherent gender difference in sensorimotor connectivity, possibly related to the enhancement of motor and visuospatial skills in males (Weiss et al., 2003; Hamilton, 2008).
4.3 Statistical Approach
Investigations of resting-state functional connectivity provide an exciting and potentially rich look into intrinsic architecture of the human brain, however this approach brings with it some methodological challenges that must be acknowledged. Unlike analysis of task-related data, which typically involves a limited number of predefined contrasts and is often constrained to regions of interest, analysis of intrinsic connectivity presents an overwhelming number of possible comparisons to be made within and between regions. To avoid mass univariate testing with inherent multiple comparison correction problems, we propose a hierarchical framework to focus analysis and effectively reduce the number of tests performed. At the initial level, we adopt a multivariate approach with backward selection on a carefully selected set of predictors which refines the model and limits the number of statistical tests performed. Using power spectra as an example, the full spectrum is PCA compressed over frequency bins and used as a single multivariate response for model selection. Only when relevant regressors are retained (age and/or gender) are univariate regressions performed, saving many tests in the case of gender (see Figures 5 and 6B1). Note that the use of ICA has also greatly refined the testing procedure by initially delineating relevant features: power spectra are evaluated for a relatively small number of select components (here, C1 = 28), rather than the comparatively large number of voxels (here, V ≈ 67000) that might be tested in a seed-based coherence approach. Simulations indicate that the MANCOVA results are robust to false positives and that sensitivity is optimized by PCA reduction of response variables to the MDL estimate (see Figure A3). There are, of course, limitations to this method, chiefly that the effects of interest must be captured in the retained principal components. Thus it is possible that age or gender-related differences in functional connectivity were not identified in the current analysis if the relevant features contributed a small fraction of variance to the response. To avoid this limitation, one could use alternative multivariate approaches such as discriminatory PCA (Caprihan et al., 2008) or coefficient-constrained ICA (Sui et al., 2009) that “optimize” dimension reduction based on the desired contrast. Though such approaches can improve feature identification and classification, we opt to use PCA on the response vectors independently of predictors to retain statistical tests and interpretations that are unbiased by an optimization procedure.
Regarding model selection, it is interesting to note that in most cases at least one of the motion-related nuisance regressors was retained as a predictor (see Figure 5). This indicates mild contamination of motion-related variance in nearly all ICA outcome measures and suggests that covariates summarizing motion should generally be included in design matrices to improve estimates for predictors of interest. Ideally, one would include additional nuisance regressors, such as average heart rate or variability in respiration depth, as these variables also contribute to variance in ICA, TCs, and SMs (Birn et al., 2008; Beall and Lowe, 2010; Starck et al., 2010). Though cardiac and respiratory measures were unfortunately not acquired for the group of subjects studied here, their inclusion would almost certainly improve estimation and inference of gender and age effects.
As a final note on the statistical approach described here, we comment on its broad applicability. The proposed method can be used to investigate the effects of numerous covariates on functional connectivity, and we anticipate that it will enhance the ability to detect differences related to neuropsychiatric disorders while controlling for demographic and other factors. Perhaps more importantly, this method is easily applied to a variety of datasets where response variables have high dimensionality but show considerable collinearity. These include outcome measures estimating functional and effective connectivity with various techniques (Sun et al., 2004; Karunanayaka et al., 2007; Deshpande et al., 2009), multidimensional parameters summarizing full brain network topology (Gong et al., 2009), as well as large-scale structural datasets such as those describing cortical thickness or white matter integrity. Though this multivariate framework provides a relatively minor departure from the mass univariate approach typically used, we feel it represents an important step toward the development of more sophisticated statistical and inferential methods that are necessary to comprehend increasingly large and complex data (Costafreda, 2010).
Conflicts of Interest Statement
The authors declare that the research was conducted in the absence of any commercial or financial relationships that could be construed as a potential conflict of interest.
Acknowledgments
This research was supported by NIH 1R01-EB006841, NIH 1R01-EB005846, NIH 2R01-EB000840, NIH 1 P20 RR021938-01, and DOE DE-FG02-08ER64581 (PI: Calhoun). Support for data collection by NIMH 1R01-MH072681-01 (PI: Kiehl); John Templeton Foundation Grant #12456 (PI: Jung); NRC Bilatgrunn (PI: Eichele); NIH 1P20 AA017068 (PI: Kodituwakku); NIH R21NS064464, NIH 1 R03 DA022435-01A1, and NIH 1 R03 DA024212-01A1 (PI: Mayer); NIH KO1-DA021632-02 (PI: Filbey).
Footnotes
References
Abbott, C., Kim, D., Sponheim, S. R., Bustillo, J., and Calhoun, V. D. (2010). Decreased default mode neural modulation with age in schizophrenia. Am. J. Geriatr. Psychiatry 18, 897–907.
Abou-Elseoud, A., Starck, T., Remes, J., Nikkinen, J., Tervonen, O., and Kiviniemi, V. (2010). The effect of model order selection in group PICA. Hum. Brain Mapp. 31, 1207–1216.
Albert, N., Robertson, E., and Miall, R. (2009). The resting human brain and motor learning. Curr. Biol. 19, 1023–1027.
Allen, E., Erhardt, E., Eichele, T., Mayer, A. R., and Calhoun, V. D. (2010). “Comparison of pre-normalization methods on the accuracy of group ICA results”, in 16th Annual Meeting of the Organization for Human Brain Mapping, 6–10 June, Barcelona, Spain.
Ances, B., Liang, C., Leontiev, O., Perthen, J., Fleisher, A., Lansing, A., and Buxton, R. (2009). Effects of aging on cerebral blood flow, oxygen metabolism, and blood oxygenation level dependent responses to visual stimulation. Hum. Brain Mapp. 30, 1120–1132.
Andrews-Hanna, J., Snyder, A., Vincent, J., Lustig, C., Head, D., Raichle, M., and Buckner, R. (2007). Disruption of large-scale brain systems in advanced aging. Neuron 56, 924–935.
Barron, S., Jacobs, L., and Kinkel, W. (1976). Changes in size of normal lateral ventricles during aging determined by computerized tomography. Neurology 26, 1011–1013.
Beall, E., and Lowe, M. (2010). The non-separability of physiologic noise in functional connectivity MRI with spatial ICA at 3T. J. Neurosci. Methods 191, 263–276.
Beckmann, C. F., DeLuca, M., Devlin, J. T., and Smith, S. M. (2005). Investigations into resting-state connectivity using independent component analysis. Philos. Trans. R. Soc. Lond. B Biol. Sci. 360, 1001–1013.
Bell, A. J., and Sejnowski, T. (1995). An information-maximization approach to blind separation and blind deconvolution. Neural. Comput. 7, 1129–1159.
Birn, R., Diamond, J., Smith, M., and Bandettini, P. (2006). Separating respiratory-variation-related fluctuations from neuronal-activity-related fluctuations in fMRI. Neuroimage 31, 1536–1548.
Birn, R., Murphy, K., and Bandettini, P. (2008). The effect of respiration variations on independent component analysis results of resting state functional connectivity. Hum. Brain Mapp. 29, 740–750.
Biswal, B. B., Mennes, M., Zuo, X. N., Gohel, S., Kelly, C., Smith, S. M., Beckmann, C. F., Adelstein, J. S., Buckner, R. L., Colcombe, S., Dogonowski, A. M., Ernst, M., Fair, D., Hampson, M., Hoptman, M. J., Hyde, J. S., Kiviniemi, V. J., Kötter, R., Li, S. J., Lin, C. P., Lowe, M. J., Mackay, C., Madden, D. J., Madsen, K. H., Margulies, D. S., Mayberg, H. S., McMahon, K., Monk, C. S., Mostofsky, S. H., Nagel, B. J., Pekar, J. J., Peltier, S. J., Petersen, S. E., Riedl, V., Rombouts, S. A., Rypma, B., Schlaggar, B. L., Schmidt, S., Seidler, R. D., Siegle, G. J., Sorg, C., Teng, G. J., Veijola, J., Villringer, A., Walter, M., Wang, L., Weng, X.C., Whitfield-Gabrieli, S., Williamson, P., Windischberger, C., Zang, Y. F., Zhang, H. Y., Castellanos, F. X., and Milham, M. P. (2010). Toward discovery science of human brain function. Proc. Natl. Acad. Sci. U.S.A. 107, 4734–4739.
Biswal, B., Yetkin, F., Haughton, V., and Hyde, J. (1995). Functional connectivity in the motor cortex of resting human brain using echo-planar MRI. Magn. Reson. Med. 34, 537–541.
Bluhm, R. L., Osuch, E. A., Lanius, R. A., Boksman, K., Neufeld, R. W. J., Théberge, J., and Williamson, P. (2008). Default mode network connectivity: effects of age, sex, and analytic approach. Neuroreport 19, 887–891.
Bockholt, H. J., Scully, M., Courtney, W., Rachakonda, S., Scott, A., Caprihan, A., Fries, J., Kalyanam, R., Segall, J., dela Garza, R., Lane, S., and Calhoun, V. D. (2009). Mining the mind research network: a novel framework for exploring large scale, heterogeneous translational neuroscience research data sources. Front. Neuroinformatics 3:36. doi: 10.3389/neuro.11.036.2009
Bookheimer, S. (2002). Functional MRI of language: new approaches to understanding the cortical organization of semantic processing. Annu. Rev. Neurosci. 25, 151–188.
Broyd, S., Demanuele, C., Debener, S., Helps, S. K., James, C. J., and Sonuga-Barke, E. J. S. (2009). Default-mode brain dysfunction in mental disorders: a systematic review. Neurosci. Biobehav. Rev. 33, 279–296.
Buckner, R., Andrews-Hanna, J., and Schacter, D. (2008). The brain’s default network. Ann. N. Y. Acad. Sci. 1124, 1–38.
Bullmore, E., and Sporns, O. (2009). Complex brain networks: graph theoretical analysis of structural and functional systems. Nat. Rev. Neurosci. 10, 186–198.
Calhoun, V. D., Adali, T., Pearlson, G. D., and Pekar, J. J. (2001). A method for making group inferences from functional MRI data using independent component analysis. Hum. Brain Mapp. 14, 140–151.
Calhoun, V. D., Adali, T., Pearlson, G. D., and Pekar, J. J. (2002a). Erratum: a method for making group inferences from functional MRI data using independent component analysis. Hum. Brain Mapp. 16, 131.
Calhoun, V., Pekar, J., McGinty, V., Adali, T., Watson, T., and Pearlson, G. (2002b). Different activation dynamics in multiple neural systems during simulated driving. Hum. Brain Mapp. 16, 158–167.
Calhoun, V. D., Eichele, T., and Pearlson, G. (2009). Functional brain networks in schizophrenia: a review. Front. Hum. Neurosci. 3:17. doi: 10.3389/neuro.09.017.2009
Calhoun, V. D., Kiehl, K. A., and Pearlson, G. D. (2008a). Modulation of temporally coherent brain networks estimated using ICA at rest and during cognitive tasks. Hum. Brain Mapp. 29, 828–838.
Calhoun, V. D., Maciejewski, P. K., Pearlson, G. D., and Kiehl, K. A. (2008b). Temporal lobe and “default” hemodynamic brain modes discriminate between schizophrenia and bipolar disorder. Hum. Brain Mapp. 29, 1265–1275.
Caprihan, A., Pearlson, G., and Calhoun, V. (2008). Application of principal component analysis to distinguish patients with schizophrenia from healthy controls based on fractional anisotropy measurements. Neuroimage 42, 675–682.
Cavanna, A., and Trimble, M. (2006). The precuneus: a review of its functional anatomy and behavioural correlates. Brain 1293, 564–583.
Christensen, R. (1996). Analysis of Variance, Design and Regression: Applied Statistical Methods. New York: Chapman and Hall/CRC.
Christensen, R. (2001). Advanced Linear Modeling: Multivariate, Time Series, and Spatial Data; Nonparametric Regression and Response Surface Maximization. New York: Springer Verlag.
Corbetta, M., and Shulman, G. (2002). Control of goal-directed and stimulus-driven attention in the brain. Nat. Rev. Neurosci. 3, 201–215.
Cordes, D., Haughton, V. M., Arfanakis, K., Wendt, G. J., Turski, P. A., Moritz, C. H., Quigley, M. A., and Meyerand, M. E. (2000). Mapping functionally related regions of brain with functional connectivity MR imaging. Am. J. Neuroradiol. 21, 1636–1644.
Costafreda, S. G. (2010). Pooling fMRI data: meta-analysis, mega-analysis and multi-center studies. Front. Neuroinformatics 3:33. doi: 10.3389/neuro.11.033.2009
Damoiseaux, J. S., Beckmann, C. F., Arigita, E. J., Barkhof, F., Scheltens, P., Stam, C. J., Smith, S. M., and Rombouts, S. (2008). Reduced resting-state brain activity in the “default network” in normal aging. Cereb. Cortex 18, 1856–1864.
Damoiseaux, J. S., Rombouts, S., Barkhof, F., Scheltens, P., Stam, C. J., Smith, S. M., and Beckmann, C. F. (2006). Consistent resting-state networks across healthy subjects. Proc. Natl. Acad. Sci. U.S.A. 103, 13848–13853.
Derksen, S., and Keselman, H. J. (1992). Backward, forward and stepwise automated subset selection algorithms: frequency of obtaining authentic and noise variables. Br. J. Math. Stat. Psychol. 45, 265–282.
Deshpande, G., LaConte, S., James, G., Peltier, S., and Hu, X. (2009). Multivariate granger causality analysis of fMRI data. Hum. Brain Mapp. 30, 1361–1373.
D’Esposito, M., Deouell, L. Y., and Gazzaley, A. (2003). Alterations in the BOLD fMRI signal with ageing and disease: a challenge for neuroimaging. Nat. Rev. Neurosci. 4, 863–872.
Eichele, T., Debener, S., Calhoun, V. D., Specht, K., Engel, A. K., Hugdahl, K., VonCramon, D. Y., and Ullsperger, M. (2008). Prediction of human errors by maladaptive changes in event-related brain networks. Proc. Natl. Acad. Sci. U.S.A. 105, 6173–6178.
Erhardt, E. B., Rachakonda, S., Bedrick, E. J., Allen, E. A., Adali, T., and Calhoun, V. D. (2010). Comparison of multi-subject ICA methods for analysis of fMRI data. Hum. Brain Mapp. doi: 10.1002/hbm.21170. [Epub ahead of print].
Esposito, F., Aragri, A., Pesaresi, I., Cirillo, S., Tedeschi, G., Marciano, E., Goebel, R., and DiSalle, F. (2008). Independent component model of the default-mode brain function: combining individual-level and population-level analyses in resting-state fMRI. Magn. Reson. Imaging 26, 905–913.
Fair, D. A., Bathula, D., Mills, K. L., Dias, T. G. C., Blythe, M. S., Zhang, D., Snyder, A. Z., Raichle, M. E., Stevens, A. A., Nigg, J. T., and Nagel, B. J. (2010). Maturing thalamocortical functional connectivity across development. Front. Syst. Neurosci. 4:10. doi: 10.3389/fnsys.2010.00010
Fair, D. A., Cohen, A. L., Dosenbach, N. U., Church, J. A., Miezin, F. M., Barch, D. M., Raichle, M. E., Petersen, S. E., and Schlaggar, B. L. (2008). The maturing architecture of the brain’s default network. Proc. Natl. Acad. Sci. U.S.A. 105, 4028–4032.
Fan, J., McCandliss, B. D., Fossella, J., Flombaum, J. I., and Posner, M. I. (2005). The activation of attentional networks. Neuroimage 26, 471–479.
Filippini, N., MacIntosh, B. J., Hough, M. G., Goodwin, G. M., Frisoni, G. B., Smith, S. M., Matthews, P. M., Beckmann, C. F., and Mackay, C. E. (2009). Distinct patterns of brain activity in young carriers of the APOE-4 allele. Proc. Natl. Acad. Sci. U.S.A. 106, 7209–7214.
Fox, M. D., and Raichle, M. E. (2007). Spontaneous fluctuations in brain activity observed with functional magnetic resonance imaging. Nat. Rev. Neurosci. 8, 700–711.
Fox, M., Snyder, A., Vincent, J., Corbetta, M., Van Essen, D., and Raichle, M., (2005). The human brain is intrinsically organized into dynamic, anticorrelated functional networks. Proc. Natl. Acad. Sci. U.S.A. 102, 9673.
Fox, M., Zhang, D., Snyder, A., and Raichle, M., (2009). The global signal and observed anticorrelated resting state brain networks. J. Neurophysiology 101, 3270.
Franco, A. R., Pritchard, A., Calhoun, V. D., and Mayer, A. R. (2009). Interrater and intermethod reliability of default mode network selection. Hum. Brain Mapp. 30, 2293–2303.
Friston, K. J., Holmes, A. P., Worsley, K. J., Poline, J. B., Frith, C. D., and Frackowiak, R. S. J. (1995). Statistical parametric maps in functional imaging: a general linear approach. Hum. Brain Mapp. 2, 189–210.
Garrity, A. G., Pearlson, G. D., McKiernan, K., Lloyd, D., Kiehl, K. A., and Calhoun, V. D. (2007). Aberrant “default mode” functional connectivity in schizophrenia. Am. J. Psychiatry 164, 450–457.
Genovese, C. R., Lazar, N. A., and Nichols, T. (2002). Thresholding of statistical maps in functional neuroimaging using the false discovery rate. Neuroimage 15, 870–878.
Glahn, D., Winkler, A., Kochunov, P., Almasy, L., Duggirala, R., Carless, M., Curran, J., Olvera, R., Laird, A., Smith, S., Beckmann, C. F., Fox, P. T., and Blangerod, J. (2010). Genetic control over the resting brain. Proc. Natl. Acad. Sci. U.S.A. 107, 1223–1228.
Gong, G., Rosa-Neto, P., Carbonell, F., Chen, Z. J., He, Y., and Evans, A. C. (2009). Age- and gender-related differences in the cortical anatomical network. J. Neurosci. 29, 15684–15693.
Good, C., Johnsrude, I., Ashburner, J., Henson, R., Friston, K., and Frackowiak, R. (2001). Cerebral asymmetry and the effects of sex and handedness on brain structure: a voxel-based morphometric analysis of 465 normal adult human brains. Neuroimage 14, 685–700.
Greicius, M. (2008). Resting-state functional connectivity in neuropsychiatric disorders. Curr. Opin. Neurol. 21, 424–430.
Grill-Spector, K., and Malach, R. (2004). The human visual cortex. Annu. Rev. Neurosci. 27, 649–677.
Hagmann, P., Cammoun, L., Gigandet, X., Meuli, R., Honey, C. J., Wedeen, V. J., and Sporns, O. (2008). Mapping the structural core of human cerebral cortex. PLoS Biol. 6, e159. doi: 10.1371/journal.pbio.0060159
Haier, R., Jung, R., Yeo, R., Head, K., and Alkire, M. (2005). The neuroanatomy of general intelligence: sex matters. Neuroimage 25, 320–327.
Hampson, M., Peterson, B., Skudlarski, P., Gatenby, J., and Gore, J. (2002). Detection of functional connectivity using temporal correlations in MR images. Hum. Brain Mapp. 15, 247–262.
Hampson, M., Tokoglu, F., Sun, Z., Schafer, R., Skudlarski, P., Gore, J., and Constable, R. (2006). Connectivity-behavior analysis reveals that functional connectivity between left BA39 and Broca’s area varies with reading ability. Neuroimage 31, 513–519.
Harrison, B. J., Pujol, J., López-Solà, M., Hernández-Ribas, R., Deus, J., Ortiz, H., Soriano-Mas, C., Yücel, M., Pantelis, C., and Cardoner, N. (2008). Consistency and functional specialization in the default mode brain network. Proc. Natl. Acad. Sci. U.S.A. 105, 9781–9786.
He, B. J., Snyder, A. Z., Vincent, J. L., Epstein, A., Shulman, G. L., and Corbetta, M. (2007). Breakdown of functional connectivity in frontoparietal networks underlies behavioral deficits in spatial neglect. Neuron 53, 905–918.
Henderson, H. V., and Velleman, P. F. (1981). Building multiple regression models interactively. Biometrics 37, 391–411.
Himberg, J., Hyvärinen, A., and Esposito, F. (2004). Validating the independent components of neuroimaging time series via clustering and visualization. Neuroimage 22, 1214–1222.
Huppert, T., Hoge, R., Diamond, S., Franceschini, M., and Boas, D. (2006). A temporal comparison of BOLD, ASL, and NIRS hemodynamic responses to motor stimuli in adult humans. Neuroimage 29, 368–382.
Hyvärinen, A., Karhunen, J., and Oja, E. (2001). Independent Component Analysis, Adaptive and Learning Systems for Signal Processing, Communications, and Control. New York: John Wiley and Sons.
Iidaka, T., Matsumoto, A., Nogawa, J., Yamamoto, Y., and Sadato, N. (2006). Frontoparietal network involved in successful retrieval from episodic memory: spatial and temporal analyses using fMRI and ERP. Cereb. Cortex 16, 1349–1360.
Jafri, M. J., Pearlson, G. D., Stevens, M., and Calhoun, V. D. (2008). A method for functional network connectivity among spatially independent resting-state components in schizophrenia. Neuroimage 39, 1666–1681.
Judd, C. M., McClelland, G. H., and Ryan, C. S. (1989). Data Analysis: A Model-Comparison Approach. San Diego: Harcourt Brace Jovanovich.
Karunanayaka, P., Holland, S., Schmithorst, V., Solodkin, A., Chen, E., Szaflarski, J., and Plante, E. (2007). Age-related connectivity changes in fMRI data from children listening to stories. Neuroimage 34, 349–360.
Kelly, A. M., Di Martino, A., Uddin, L. Q., Shehzad, Z., Gee, D. G., Reiss, P. T., Margulies, D. S., Castellanos, F. X., and Milham, M. P. (2009). Development of anterior cingulate functional connectivity from late childhood to early adulthood. Cereb. Cortex 19, 640–657.
Kennedy, D. P., and Courchesne, E. (2008). The intrinsic functional organization of the brain is altered in autism. Neuroimage 39, 1877–1885.
Kiviniemi, V., Starck, T., Remes, J., Long, X., Nikkinen, J., Haapea, M., Veijola, J., Moilanen, I., Isohanni, M., Zang, Y. F., and Tervonen, O. (2009). Functional segmentation of the brain cortex using high model order group PICA. Hum. Brain Mapp. 30, 3865–3886.
Klein, T. A., Endrass, T., Kathmann, N., Neumann, J., Von Cramon, D. Y., and Ullsperger, M. (2007). Neural correlates of error awareness. Neuroimage 34, 1774–1781.
Koch, W., Teipel, S., Mueller, S., Buerger, K., Bokde, A. L. W., Hampel, H., Coates, U., Reiser, M., and Meindl, T. (2009). Effects of aging on default mode network activity in resting state fMRI: does the method of analysis matter? Neuroimage 51, 280–287.
Kochiyama, T., Morita, T., Okada, T., Yonekura, Y., Matsumura, M., and Sadato, N. (2005). Removing the effects of task-related motion using independent-component analysis. Neuroimage 25, 802–814.
Koechlin, E., Ody, C., and Kouneiher, F. (2003). The architecture of cognitive control in the human prefrontal cortex. Science 302, 1181–1185.
Koechlin, E., and Summerfield, C. (2007). An information theoretical approach to prefrontal executive function. Trends Cogn. Sci. 11, 229–235.
Kraemer, H., Yesavage, J., Taylor, J., and Kupfer, D. (2000). How can we learn about developmental processes from cross-sectional studies, or can we? Am. J. Psychiatry 157, 163–171.
Krienen, F., and Buckner, R. (2009). Segregated fronto-cerebellar circuits revealed by intrinsic functional connectivity. Cereb. Cortex 19, 2485–2497.
Laird, A. R., Eickhoff, S. B., Li, K., Robin, D. A., Glahn, D. C., and Fox, P. T. (2009). Investigating the functional heterogeneity of the default mode network using coordinate-based meta-analytic modeling. J. Neurosci. 29, 14496–14505.
Luders, E., Gaser, C., Narr, K. L., and Toga, A. W. (2009). Why sex matters: brain size independent differences in gray matter distributions between men and women. J. Neurosci. 29, 14265–14270.
Luders, E., Narr, K., Thompson, P., Woods, R., Rex, D., Jancke, L., Steinmetz, H., and Toga, A. (2005). Mapping cortical gray matter in the young adult brain: effects of gender. Neuroimage 26, 493–501.
Margulies, D. S., Vincent, J. L., Kelly, C., Lohmann, G., Uddin, L. Q., Biswal, B. B., Villringer, A., Castellanos, F. X., Milham, M. P., and Petrides, M. (2009). Precuneus shares intrinsic functional architecture in humans and monkeys. Proc. Natl. Acad. Sci. U.S.A. 106, 20069–20074.
McKeown, M. J., Hansen, L. K., and Sejnowsk, T. J. (2003). Independent component analysis of functional MRI: what is signal and what is noise? Curr. Opin. Neurobiol. 13, 620–629.
Meda, S., Giuliani, N., Calhoun, V., Jagannathan, K., Schretlen, D., Pulver, A., Cascella, N., Keshavan, M., Kates, W., Buchanan, R., Sharma, T., and Pearlson, G. D. (2008). A large scale (n= 400) investigation of gray matter differences in schizophrenia using optimized voxel-based morphometry. Schizophrenia Research 101, 95–105.
Murphy, K., Birn, R., Handwerker, D., Jones, T., and Bandettini, P., (2009). The impact of global signal regression on resting state correlations: are anti-correlated networks introduced? NeuroImage 44, 893–905.
Murphy, K., Birn, R., Handwerker, D., Jones, T., Bandettini, P., 2009. The impact of global signal regression on resting state correlations: Are anti-correlated networks introduced? NeuroImage 1041 44 (3), 893–905.
Østby, Y., Tamnes, C., Fjell, A., Westlye, L., Due-TØnnessen, P., and Walhovd, K. (2009). Heterogeneity in subcortical brain development: a structural magnetic resonance imaging study of brain maturation from 8 to 30 years. J. Neurosci. 29, 11772–11782.
Raichle, M. E., MacLeod, A. M., Snyder, A. Z., Powers, W. J., Gusnard, D. A., and Shulman, G. L. (2001). A default mode of brain function. Proc. Natl. Acad. Sci. U.S.A. 98, 676–682.
Ridderinkhof, K. R., Ullsperger, M., Crone, E. A., and Nieuwenhuis, S. (2004). The role of the medial frontal cortex in cognitive control. Science 306, 443–447.
Robinson, S., Basso, G., Soldati, N., Sailer, U., Jovicich, J., Bruzzone, L., Kryspin-Exner, I., Bauer, H., and Moser, E. (2009). A resting state network in the motor control circuit of the basal ganglia. BMC Neurosci. 10, 137. doi: 10.1186/1471-2202-10-137
Schmithorst, V., and Holland, S. (2006). Functional MRI evidence for disparate developmental processes underlying intelligence in boys and girls. Neuroimage 31, 1366–1379.
Schmithorst, V., and Holland, S. (2007). Sex differences in the development of neuroanatomical functional connectivity underlying intelligence found using Bayesian connectivity analysis. Neuroimage 35, 406–419.
Schölvinck, M., Maier, A., Ye, F., Duyn, J., and Leopold, D. (2010). Neural basis of global resting-state fMRI activity. Proc. Natl. Acad. Sci. U.S.A. 107, 10238–10243.
Seifritz, E., Esposito, F., Hennel, F., Mustovic, H., Neuhoff, J., Bilecen, D., Tedeschi, G., Scheffler, K., and Di Salle, F. (2002). Spatiotemporal pattern of neural processing in the human auditory cortex. Science 297, 1706–1708.
Shehzad, Z., Kelly, A., Reiss, P., Gee, D., Gotimer, K., Uddin, L., Lee, S., Margulies, D., Roy, A., Biswal, B., Petkova, E., Castellanos, F. X., and Milham, M. P. (2009). The resting brain: unconstrained yet reliable. Cereb. Cortex 19, 2209–2229.
Smith, S. M., Fox, P. T., Miller, K. L., Glahn, D. C., Fox, P. M., Mackay, C. E., Filippini, N., Watkins, K. E., Toro, R., Laird, A. R., and Beckmann, C. F. (2009). Correspondence of the brain’s functional architecture during activation and rest. Proc. Natl. Acad. Sci. U.S.A. 106, 13040–13045.
Sowell, E., Peterson, B., Kan, E., Woods, R., Yoshii, J., Bansal, R., Xu, D., Zhu, H., Thompson, P., and Toga, A. (2007). Sex differences in cortical thickness mapped in 176 healthy individuals between 7 and 87 years of age. Cereb. Cortex 17, 1550–1560.
Sowell, E., Peterson, B., Thompson, P., Welcome, S., Henkenius, A., and Toga, A. (2003). Mapping cortical change across the human life span. Nat. Neurosci. 6, 309–315.
Specht, K., and Reul, J. (2003). Functional segregation of the temporal lobes into highly differentiated subsystems for auditory perception: an auditory rapid event-related fMRI-task. Neuroimage 20, 1944–1954.
Starck, T., Remes, J., Nikkinen, J., Tervonen, O., and Kiviniemi, V. (2010). Correction of low-frequency physiological noise from the resting state BOLD fMRI–effect on ICA default mode analysis at 1.5 T. J. Neurosci. Methods 186, 179–185.
Stevens, M. C., Pearlson, G. D., and Calhoun, V. D. (2009). Changes in the interaction of resting-state neural networks from adolescence to adulthood. Hum. Brain Mapp. 30, 2356–2366.
Sui, J., Adali, T., Pearlson, G. D., and Calhoun, V. D. (2009). An ICA-based method for the identification of optimal fMRI features and components using combined group-discriminative techniques. Neuroimage 46, 73–86.
Sullivan, E. V., and Pfefferbaum, A. (2006). Diffusion tensor imaging and aging. Neurosci. Biobehav. Rev. 30, 749–761.
Sun, F., Miller, L., and D’Esposito, M. (2004). Measuring interregional functional connectivity using coherence and partial coherence analyses of fMRI data. Neuroimage 21, 647–658.
Szaflarski, J., Holland, S., Schmithorst, V., and Byars, A. (2006). fMRI study of language lateralization in children and adults. Hum. Brain Mapp. 27, 202–212.
Tamnes, C. K., Ostby, Y., Fjell, A. M., Westlye, L. T., Due-TØnnessen, P., and Walhovd, K. B. (2010). Brain maturation in adolescence and young adulthood: regional age-related changes in cortical thickness and white matter volume and microstructure. Cereb. Cortex 20, 534–548.
Van Dijk, K. R. A., Hedden, T., Venkataraman, A., Evans, K. C., Lazar, S. W., and Buckner, R. L. (2010). Intrinsic functional connectivity as a tool for human connectomics: theory, properties, and optimization. J. Neurophysiol. 103, 297–321.
Vincent, J., Kahn, I., Snyder, A., Raichle, M., and Buckner, R. (2008). Evidence for a frontoparietal control system revealed by intrinsic functional connectivity. J. Neurophysiol. 100, 3328–3342.
Wallentin, M. (2009). Putative sex differences in verbal abilities and language cortex: a critical review. Brain Lang. 108, 175–183.
Weiss, E. M., Kemmler, G., Deisenhammer, E. A., Fleischhacker, W. W., and Delazer, M. (2003). Sex differences in cognitive functions. Pers. Individ. Dif. 35, 863–875.
Whitfield-Gabrieli, S., Thermenos, H., Milanovic, S., Tsuang, M., Faraone, S., McCarley, R., Shenton, M., Green, A., Nieto-Castanon, A., LaViolette, P., Wojcik, J., Gabrieli, J. D. E., and Seidman, L. J. (2009). Hyperactivity and hyperconnectivity of the default network in schizophrenia and in first-degree relatives of persons with schizophrenia. Proc. Natl. Acad. Sci. U.S.A. 106, 1279–1284.
Whitford, T., Rennie, C., Grieve, S., Clark, C., Gordon, E., and Williams, L. (2007). Brain maturation in adolescence: concurrent changes in neuroanatomy and neurophysiology. Hum. Brain Mapp. 28, 228–237.
Xiong, J., Ma, L., Wang, B., Narayana, S., Duff, E., Egan, G., and Fox, P. (2009). Long-term motor training induced changes in regional cerebral blood flow in both task and resting states. Neuroimage 45, 75–82.
Ystad, M., Eichele, T., Lundervold, A. J., and Lundervold, A. (2010). Subcortical functional connectivity and verbal episodic memory in healthy elderly-a resting state fMRI study. Neuroimage 52, 379–388.
Keywords: fMRI, functional connectivity, resting-state, independent component analysis, connectome
Citation: Allen EA, Erhardt EB, Damaraju E, Gruner W, Segall JM, Silva RF, Havlicek M, Rachakonda S, Fries J, Kalyanam R, Michael AM, Caprihan A, Turner JA, Eichele T, Adelsheim S, Bryan AD, Bustillo J, Clark VP, Feldstein Ewing SW, Filbey F, Ford CC, Hutchison K, Jung RE, Kiehl KA, Kodituwakku P, Komesu YM, Mayer AR, Pearlson GD, Phillips JP, Sadek JR, Stevens M, Teuscher U, Thoma RJ and Calhoun VD (2011) A baseline for the multivariate comparison of resting-state networks. Front. Syst. Neurosci. 5:2. doi: 10.3389/fnsys.2011.00002
Received: 16 June 2010;
Accepted: 03 January 2011;
Published online: 04 February 2011.
Edited by:
Silvina G. Horovitz, National Institutes of Health, USAReviewed by:
Scott K. Holland, Cincinnati Children’s Research Foundation, USACopyright: © 2011 Allen, Erhardt, Damaraju, Gruner, Segall, Silva, Havlicek, Rachakonda, Fries, Kalyanam, Michael, Caprihan, Turner, Eichele, Adelsheim, Bryan, Bustillo, Clark, Feldstein Ewing, Filbey, Ford, Hutchison, Jung, Kiehl, Kodituwakku, Komesu, Mayer, Pearlson, Phillips, Sadek, Stevens, Teuscher, Thoma and Calhoun. This is an open-access article subject to an exclusive license agreement between the authors and Frontiers Media SA, which permits unrestricted use, distribution, and reproduction in any medium, provided the original authors and source are credited.
*Correspondence: Elena A. Allen, The Mind Research Network, 1101 Yale Boulevard NE, Albuquerque, NM 87106, USA. e-mail: eallen@mrn.org