


Abstract
The ovarian hormone progesterone is essential for normal breast development and function. However, it is also implicated in breast cancer development. Progesterone signals through two nuclear receptors [progesterone receptor A (PRA) and progesterone receptor B (PRB)], which display striking differences in transcriptional activity when analyzed separately. The two species are coexpressed equally in normal breast, but expression becomes markedly disrupted in breast cancer, where a predominance of PRA is common. To determine the impact on PR transcriptional activity of the shift from coexpression of PRA and PRB, observed in normal cells, to predominance of PRA, common in cancers, we modeled these changes in PR expression patterns using an inducible model of PRA predominance. At short treatment times progestin regulation was directed toward transcriptional modulators, whereas longer exposure more frequently targeted genes associated with regulation of cell shape, adhesion, and metabolism, and a number of these targets acquired responsiveness only when PRA predominance was achieved. Consistent with this, overexpression of PRA altered progestin effects on cell-substrate attachment and focal adhesion signaling. Our data suggest that disrupted balance of PRA and PRB remodels progestin responsiveness and that altered regulation of morphology and adhesion are important components of altered progestin response in breast cancer.
THE STEROID HORMONE progesterone is a vital regulator of normal female reproductive development and function. In the human, progesterone has diverse physiological effects, playing a role in endometrial decidualization, ovulation, and the development of lobular alveolar structures of the mammary gland during the female cycle and pregnancy (1). It exerts its primary effects through two nuclear receptors [progesterone receptor A (PRA) and progesterone receptor B (PRB)], which are encoded by a single gene, under the regulation of two distinct promoters (2). The two receptor proteins are identical except that PRB contains an additional 164 amino acids at its N-terminal end that are absent from PRA.
There is evidence from in vitro transcriptional studies and from transgenic and knock-out animal models that PRA and PRB are functionally different. In transient transfections PRB is generally a much stronger transcriptional activator than PRA, whereas PRA can act as a dominant inhibitor of PRB, and of other nuclear receptors including the estrogen receptor and glucocorticoid, androgen, and mineralocorticoid receptors (3–7). This has led to the postulate that the unique 164 amino acids contained in PRB encode an additional activation function, which serves to enhance the transcriptional activity of PRB and to mask an adjacent inhibitory function (8, 9). Marked functional differences are also seen between the two receptors when they are stably introduced individually into cells. When progestin regulation in breast cancer cells that constitutively express only PRA or PRB is examined on gene arrays, a remarkably nonoverlapping profile of gene regulation is observed (10). Furthermore, these data support the previous findings that PRB is the more transcriptionally active receptor of the two.
Ablation of PRA or PRB in mice supports the view, derived from in vitro studies, that each isoform has distinct roles. In PRA-null mice that endogenously express only PRB, mammary gland development is apparently normal, whereas null mice lacking PRB exhibit reduced mammary gland development, demonstrating the importance of PRB rather than PRA in the mammary gland in mice (11). In contrast, loss of PRA expression in the uterus leads to marked hyperplasia in response to hormone stimulation, demonstrating the proliferative role of PRB alone and the importance of PRA in opposing the proliferative effects mediated by PRB and estrogen receptor in the uterus (12).
As indicated above, much of our current understanding of the distinct functions of PRA and PRB derives from models in which only a single PR isoform is expressed. However, the dynamics of progestin response are likely to be more complex in a tissue that coexpresses both PR isoforms in the same cell. PRA and PRB can act both as homodimers and as a heterodimer, and these are likely to be functionally different, because PRA is known to inhibit the activity of PRB. Whereas in mouse tissues, PRA and PRB can be expressed in different cells (13), consistent with the divergent and tissue-specific roles identified for these proteins in the knockout studies, in normal human physiology, cells that express only one PR isoform are uncommon. Both PRA and PRB are coexpressed at equivalent levels in the same cell in normal human epithelial cells (1, 14, 15), and the coexpression and colocation of PRA and PRB in epithelial cells in normal tissues suggest that both PR isoforms are required to mediate the effects of progesterone in the human.
The balanced expression of PRA and PRB in normal human tissues is often disrupted in breast cancer, resulting in a predominance of one form (15, 16). It is not common to see exclusive expression of either PRA or PRB in breast tumors, but rather a marked overexpression of one receptor form (most often PRA) predominating over low expression of the other (15, 16). In endometrial cancers, disrupted PR isoform expression is correlated with poor clinical grade (17). Furthermore, breast cancer patients with node-positive disease and a primary tumor containing more PRA than PRB are likely to respond to endocrine therapy more poorly than those with a higher expression of PRB (18). In contrast, a predominance of PRB may indicate poorer outcome with chemotherapy (Mote, P. A., A. Gompel, A. Lavaur, Y. Decroix, D. Hugol, and C. L. Clarke, submitted). These observations suggest that loss of equivalent expression of PR isoforms may be associated with the altered biology that is a feature of malignancy in the breast and endometrium and may contribute to poorer prognosis. Disrupted expression of PRA and PRB also occurs in normal breast of women with a high risk of breast cancer. Women at high risk of developing breast cancer due to germline mutations in BRCA1 or BRCA2 commonly lack PRB expression, resulting in PRA predominance (19), and this suggests that altered PR signaling may occur in these tissues.
There is evidence that altered balance of PRA and PRB leads to altered biology in tissues expressing both isoforms. In transgenic mice that overexpress PRA in the mammary gland, extensive mammary epithelial hyperplasia, increased ductal side branching, and disruption of the basement membrane are seen (20). In contrast, overexpression of PRB in the same model system leads to marked inhibition of ductal elongation and decreased lobular alveolar development (21). These data suggest that a normal balance of expression of both receptors in the appropriate cell type is important for normal mammary gland development. In cell lines, altered balance of PRA and PRB also leads to altered biology. When PRA is inducibly overexpressed in PR-positive T-47D breast cancer cells that previously expressed similar levels of PRA and PRB, alterations in the regulation of endogenous target genes are observed that are both gene specific and dependent on the degree of PRA overexpression (22). Overexpression of PRA in these cells also results in striking morphological changes, not seen in cells with balanced PRA and PRB levels (23).
The striking functional differences in the activities of PRA and PRB, and the altered biology that results from altering their balance, suggest that the relative levels of expression of PRA and PRB in cells that contain both receptors may be an important determinant of transcriptional response to progestins. Moreover, the disrupted expression of PRA and PRB in cancer, frequently resulting in PRA predominance, and its association with poorer prognosis, provide a compelling rationale for delineating the functional consequences of such altered PRA and PRB expression. The transcriptional consequences of PRA predominance in cells normally containing similar levels of PRA and PRB are unknown and have been explored in PR-positive T-47D breast cancer cells in which PRA can be induced to result in PRA predominance. Transcriptional outcomes have been determined after altering the PRA:PRB ratio 5-fold, mimicking the range of PRA:PRB ratios observed in normal breast epithelial cells and in breast cancers. This study represents the first analysis that models the aberrant expression patterns of PRA and PRB seen in clinical breast cancer, to determine the consequences for hormone response of PRA predominance.
Results
Progestin Effects in Cells Containing Both PRA and PRB
Progestin regulation of gene expression was examined in a stable, inducible model of PRA overexpression (22). In this model PRA is inducibly overexpressed in the PR-positive T-47D breast cancer cell line. Several inducible T-47D clones exist, and the three cell lines used were selected to represent a range of PRA and PRB levels and of PRA:PRB ratios (Fig. 1A). PRA:PRB ratios ranged from approximately equimolar (1.3:1) in the uninduced T-47DE3 line (Fig. 1A) to 5.1:1 in the induced T-47DN5 cells (Fig. 1A). The T-47DB8 cell line expressed higher basal levels of both PR forms, resulting in a 2-fold greater total PR level in uninduced cells than in T-47DE3 or T-47DN5 cells. The basal PRA:PRB ratio of 2.1 to 1 in these cells was increased to 4.8:1 with induction of PRA (Fig. 1A). This range of expression levels and ratios of PRA:PRB are comparable to the expression of PR isoforms detected by immunoblot analysis in primary breast tumors (16).
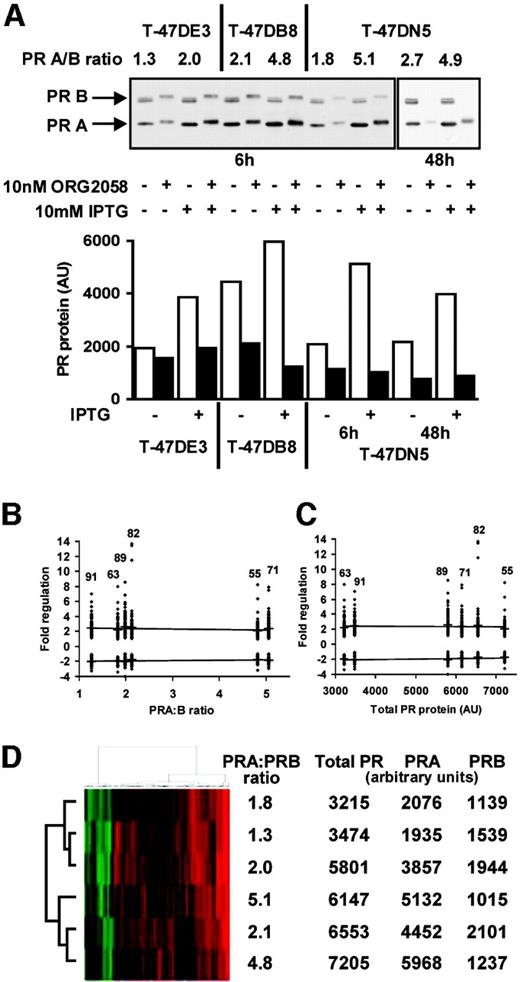
Correlation of PR Expression with Progestin Regulation in Inducible T-47D Cell Lines T-47DE3, T-47DB8, and T-47DN5 cells were grown as described in Materials and Methods. Cells were treated for 24 h with 10 mm isopropyl-β-d-thiogalactopyranoside (IPTG) or vehicle, to induce PRA overexpression and then with ORG2058 or vehicle for the indicated time. A, Whole-cell lysates (25μg/lane) were fractionated on a 7.5% acrylamide denaturing gel, and PR proteins were detected by immunoblotting. Basal and IPTG-induced expression of PRA and PRB was estimated by densitometry. PRA is represented by open bars and solid bars represent PRB. AU, Arbitrary densitometric units. B, Transcriptional regulation by 6 h progestin treatment was compared, in the three T-47D clones, with PRA:PRB ratio. C, Correlation between 6 h progestin regulation and total PR level. Numbers represent number of regulated genes. D, Cluster analysis of 6 h progestin-regulated genes. Up-regulated transcripts are represented in red, and down-regulation is in green, with brightness of intensity proportional to degree of fold change.
Transcriptional regulation by progestins was characterized in each of the T-47D clones, using cDNA microarrays. The effect of 6 h progestin exposure was first compared in the three lines, as it was reasoned that at this time a high proportion of the regulated genes should represent direct transcriptional targets. Seventy to 80% of the 5704 genes represented on the arrays were detectable in the T-47D clones after data filtering and normalization (Table 1). Exposure to the progestin ORG2058 (10 nm) for 6 h resulted in altered expression of 1–2% of expressed genes in the three T-47D clones (mean 1.8%, Table 1). This was in line with other reports of progestin response in related T-47D cell lines (10, 24). When PRA protein expression was induced in each of the stable cell lines, the mean number of progestin-regulated genes was mildly reduced overall (mean number of progestin-regulated genes 1.5%, Table 1), but this difference was not significant.
Summary of Progestin Regulation at 6 h
| Cell Line | |||
|---|---|---|---|
| T-47DE3 | T-47DN5 | T-47DB8 | |
| No. of genes expressed | 4560 | 4313 | 4030 |
| Regulated more than 2-fold in wild type | 90 | 63 | 83 |
| (2.0%) | (1.5%) | (2.1%) | |
| Regulated more than 2-fold in PRA predominant | 82 | 56 | 51 |
| (2.0%) | (1.3%) | (1.1%) | |
There was a high degree of overlap of progestin regulation between the three T-47D clones. In total, 133 genes were regulated 2-fold or more in at least one of the three T-47D cell lines. Their identity and fold regulation in uninduced cells are listed in Table 2, . A number of the genes represented known targets of progestin action and served to validate the present observations. These included the PR chaperone FKBP54 (25), SRY-related transcription factor SOX4 (26), and Kruppel-like factor (KLF)4 (10). In addition, nine genes that were found, on microarrays, to be regulated by progestins at 6 h were selected for validation by quantitative real-time RT-PCR. All nine genes were confirmed as progestin targets in the T-47DN5 cell line, and their quantified fold regulation by progestins is noted in Table 2. Of the 133 regulated genes listed in Table 2, 31 (23%) (indicated by footnote symbol b) were regulated in all three T-47D cell lines in the absence of PRA overexpression. In addition, 41 genes (31%, Table 2, indicated by footnote symbol d) were regulated in at least two of the three lines, and a further 25 genes (19%, Table 2, indicated by footnote symbol c) that were regulated 2-fold in one cell line were regulated in the same way at least 1.5-fold in the other two T-47D cell lines in the absence of PRA overexpression. In summary, the similarity of progestin regulation of 73% of the genes over three cell lines suggested that there was a high degree of concordance of early progestin regulation in PR-positive cells irrespective of their basal PRA and PRB expression, and despite PRA:PRB expression ratios ranging from 1.3–2.1 in the three uninduced cell lines (Fig. 1A).
Genes Regulated by Progestin at 6 h
| GenBank Accession No. | Symbol | Gene Name | Fold Regulation by Progestin at 6 h (mean ± sem) | T-47DN5 Real-Time RT-PCR | Individual Isoform Regulationa | ||
|---|---|---|---|---|---|---|---|
| T-47DE3 | T-47DN5 | T-47DB8 | |||||
| Transcriptional Regulation/Signal Transduction | |||||||
| H15085 | ARF4Lb | ADP-ribosylation factor 4-like | 3.17 ± 0.85, 1.15 | 2.71 ± 0.94, 1.45 | 2.46 ± 0.31, 0.35 | ||
| AA012867 | ARF6c | ADP-ribosylation factor 6 | 2.41 ± 0.32, 0.36 | 1.52 ± 0.21, 0.25 | 1.55 ± 0.21, 0.24 | ||
| H60549 | CD59c | CD59 antigen | 2.23 ± 0.11, 0.13 | 1.50 ± 0.17, 0.21 | 1.96 ± 0.05, 0.05 | PRB 1.7 | |
| AA115076 | CITED2 | Cbp/p300-interacting transactivator 2 | 1.47 ± 0.13, 0.13 | 1.47 ± 0.13, 0.13 | 2.41 ± 0.25, 0.27 | ||
| AA456639 | CSRP2BPb | CSRP2 binding protein | 3.14 ± 0.47, 0.57 | 2.76 ± 0.28, 0.31 | 3.00 ± 0.32, 0.35 | ||
| N79030 | DDX48d | DEAD (Asp-Glu-Ala-Asp) box 49 | 2.15 ± 0.06, 0.07 | 2.43 ± 0.03, 0.03 | 1.35 ± 0.01, 0.02 | ||
| AA629707 | DSCR1b | Down syndrome candidate region I | 3.20 ± 0.23, 0.25 | 3.64 ± 0.34, 0.37 | 2.16 ± 0.42, 0.53 | ||
| AA775091 | DSIPIb | Delta sleep inducing peptide | 7.01 ± 1.61, 2.09 | 5.86 ± 0.83, 0.97 | 11.50 ± 5.71, 11.37 | PRA 2.5 | |
| W65461 | DUSP5b | Dual specificity phosphatase 5 | −3.27 ± 0.04, 0.05 | −3.42 ± 0.02, 0.03 | −2.02 ± 0.13, 0.18 | ||
| AA191245 | ELL2c | RNA polymerase II elongation factor | 2.85 ± 0.54, 0.66 | 1.62 ± 0.04, 0.03 | 1.57 ± 0.32, 0.42 | ||
| A1286222 | EPAS1 | Endothelial PAS domain protein 1 | 1.35 ± 0.12, 0.13 | 1.23 ± 0.09, 0.10 | 2.02 ± 0.08, 0.09 | ||
| AA496359 | ETR101c | Immediate early response 2 | −1.58 ± 0.14, 0.18 | −1.83 ± 0.03, 0.04 | −2.46 ± 0.04, 0.04 | ||
| W86653 | FKBP5b | FK506 binding protein 5 (FKBP54) | 3.85 ± 0.26, 0.28 | 3.65 ± 0.06, 0.05 | 2.40 ± 0.40, 0.48 | 7.44 | PRA 3.3 PRB 9.4 |
| AA448277 | FOXO1Ad | Forkhead box O1A | 2.65 ± 0.24, 0.27 | 2.31 ± 0.12, 0.12 | 1.15 ± 0.02, 0.03 | ||
| H72875 | GATA3 | GATA-binding protein 3 | −1.31 ± 0.08, 0.08 | −1.39 ± 0.09, 0.11 | −2.14 ± 0.00, 0.00 | ||
| AA431832 | GRN | Granulin | 1.59 ± 0.05, 0.06 | 1.45 ± 0.05, 0.06 | 2.26 ± 0.11, 0.11 | ||
| R52798 | HGF | Hepatocyte growth factor | 1.36 ± 0.04, 0.04 | 1.15 ± 1.15, −1.15 | 2.18 ± 0.13, 0.15 | ||
| AA598526 | HIF1Ad | Hypoxia-inducible factor 1 | 2.09 ± 0.21, 0.24 | 2.08 ± 0.25, 0.28 | 1.65 ± 0.09, 0.10 | ||
| T52830 | IGFBP5 | IGF binding protein 5 | −2.15 ± 0.04, 0.04 | −1.48 ± 0.04, 0.04 | −1.27 ± 0.02, 0.02 | ||
| AA001614 | INSR | Insulin receptor | 1.39 ± 0.09, 0.10 | 1.43 ± 0.08, 0.09 | 2.88 ± 0.41, 0.48 | ||
| R70685 | JAG1d | Jagged 1 (HJ1) | 2.00 ± 0.04, 0.05 | 1.51 ± 0.01, 0.00 | 2.18 ± 0.02, 0.01 | ||
| AA443659 | JDP2 | Jun dimerization protein 2 | 2.90 ± 0.21, 0.23 | 1.77 ± 0.08, 0.08 | 1.37 ± 0.05, 0.06 | ||
| H45668 | KLF4b | Kruppel-like zinc finger protein (EZF) | 5.28 ± 1.35, 1.80 | 4.34 ± 0.54, 0.61 | 4.40 ± 0.98, 1.25 | PRA ∼7.5 PRB ∼6.0 | |
| H27986 | LMO4d | LIM domain only 4 | −2.20 ± 0.03, 0.04 | −1.56 ± 0.09, 0.11 | −2.32 ± 0.05, 0.05 | ||
| T54462 | MLLT7d | AFX1 | 2.45 ± 0.08, 0.07 | 2.14 ± 0.00, 0.01 | 1.36 ± 0.08, 0.10 | ||
| H92201 | NAPIL4d | Nucleosome assembly protein 1-like 4 | 2.35 ± 0.14, 0.15 | 1.98 ± 0.19, 0.21 | 2.16 ± 0.17, 0.18 | ||
| AA486403 | NDRG1b | N-myc downstream regulated gene 1 | 4.03 ± 0.19, 0.21 | 3.94 ± 1.77, 3.22 | 13.71 ± 4.03, 5.72 | 40.50 | PRB 6.8 |
| W56300 | NFKB1Ad | NF-κB inhibitor, α | 2.38 ± 0.21, 0.24 | 2.06 ± 0.13, 0.13 | 1.93 ± 0.27, 0.31 | PRA 2.0 PRB 4.2 | |
| R43817 | NPY1R | Neuropeptide Y receptor Y1 | −1.16 ± 0.07, 0.07 | −2.56 ± 0.04, 0.04 | n.d. | −3.14 | |
| AA458503 | NRIP1 | Nuclear receptor interacting protein 1 | −2.41 ± 0.01, 0.01 | −1.37 ± 0.01, 0.01 | −1.41 ± 0.02, 0.02 | −1.66 | |
| AA778919 | P2RY6 | Pyrimidinergic receptor P2Y6 | −1.07 ± 0.13, 0.15 | 1.00 ± 0.08, 0.09 | 2.02 ± 0.24, 0.26 | ||
| AA454791 | PHF15c | PHD finger protein 15 | 1.61 ± 0.07, 0.07 | 1.68 ± 0.09, 0.10 | 2.17 ± 0.17, 0.19 | ||
| AA045326 | PTPRJc | Protein tyrosine phosphatase, receptor type, J | 1.97 ± 0.00, 0.01 | 1.63 ± 0.26, 0.30 | 2.04 ± 0.15, 0.17 | ||
| H24301 | RBBP8 | Retinoblastoma binding protein 8 | −1.61 ± 0.02, 0.02 | −2.03 ± 0.01, 0.01 | −1.05 ± 0.95, −0.95 | ||
| T74714 | RPS6KA2c | Ribosomal protein S6 kinase 90 kDa | 2.09 ± 0.37, 0.44 | 1.54 ± 0.18, 0.20 | 1.71 ± 0.31, 0.38 | ||
| AA022561 | SATB1d | Special AT-rich sequence binding protein 1 | −2.27 ± 0.07, 0.09 | −2.16 ± 0.02, 0.02 | −1.53 ± 0.03, 0.03 | ||
| AA427595 | SHB | SHB adaptor protein | 1.41 ± 0.04, 0.04 | 1.36 ± 1.36, −1.36 | 2.67 ± 0.05, 0.05 | ||
| AA453420 | SOX4b | SRY-box 4 | 3.02 ± 0.20, 0.22 | 2.53 ± 0.31, 0.36 | 2.13 ± 0.10, 0.11 | ||
| AA400464 | SOX9b | SRY-box 9 | 3.82 ± 0.00, 0.00 | 2.11 ± 0.50, 0.64 | 2.96 ± 0.25, 0.27 | ||
| W93653 | STAF65 γb | SPTF-associated factor 65 γ | 3.34 ± 0.37, 0.42 | 3.81 ± 0.77, 0.96 | 2.99 ± 0.81, 1.13 | ||
| AA927923 | TBX2 | T-box 2 | −1.45 ± 0.03, 0.03 | −1.58 ± 0.05, 0.06 | −2.31 ± 0.01, 0.00 | ||
| AA394236 | TFAP2Cd | Transcription factor AP-2 γ | −2.67 ± 0.04, 0.04 | −1.89 ± 0.07, 0.08 | −2.55 ± 0.01, 0.01 | ||
| AA040617 | TGFB3d | TGFβ 3 | −2.71 ± 0.04, 0.05 | −2.10 ± 0.02, 0.02 | −1.46 ± 0.06, 0.07 | PRA −3.0 PRB −1.8 | |
| T66180 | THRAb | Thyroid hormone receptor α | 3.30 ± 0.35, 0.40 | 3.01 ± 0.51, 0.61 | 3.21 ± 0.32, 0.35 | ||
| R38669 | TNFRSF10B | TNF receptor superfamily, member 10b | 2.14 ± 0.06, 0.06 | n.d. | n.d. | ||
| AA102634 | TRAF5b | TNF receptor-associated factor 5 | 3.13 ± 0.87, 1.21 | 3.49 ± 0.22, 0.24 | 2.01 ± 0.20, 0.22 | ||
| AA464849 | TXNRD1d | Thioredoxin reductase | −2.26 ± 0.02, 0.02 | −2.19 ± 0.01, 0.01 | −1.98 ± 0.01, 0.01 | ||
| AA485226 | VDRd | Vitamin D receptor | 1.92 ± 0.08, 0.07 | 2.09 ± 0.13, 0.15 | 2.72 ± 0.18, 0.19 | ||
| AA130187 | WT1d | Wilms tumor 1 | −2.07 ± 0.05, 0.05 | −2.67 ± 0.03, 0.03 | −1.36 ± 0.02, 0.02 | −2.81 | |
| N77515 | ZNF11Bc | Zinc finger protein 33a (KOX 31) | 1.57 ± 0.10, 0.10 | 1.70 ± 0.11, 0.11 | 2.06 ± 0.09, 0.09 | ||
| Cell Cycle Regulation/Survival/Apoptosis | |||||||
| AA464217 | AKT1 | V-akt homolog 1 | 1.91 ± 0.26, 0.31 | 1.45 ± 0.18, 0.21 | 2.23 ± 0.04, 0.04 | ||
| AA857163 | AREGd | Amphiregulin | −2.47 ± 0.00, 0.01 | −1.94 ± 0.01, 0.01 | −2.67 ± 0.15, 0.24 | ||
| AA777187 | CYR61d | Cyr61 | 2.52 ± 0.17, 0.18 | 2.96 ± 0.23, 0.25 | 1.64 ± 0.18, 0.19 | 4.16 | |
| AA504113 | MPHOSPH 10d | M phase phosphoprotein 10 | 3.03 ± 0.15, 0.15 | 1.45 ± 0.29, 0.37 | 2.30 ± 0.25, 0.28 | ||
| R32450 | NPEPPS | Aminopeptidase | −2.12 ± 0.04, 0.05 | −1.75 ± 0.01, 0.01 | −1.34 ± 0.07, 0.07 | ||
| AA863383 | PIM2b | Pim-2 protooncogene | 2.99 ± 0.20, 0.21 | 3.20 ± 0.11, 0.10 | 2.95 ± 0.43, 0.50 | 6.28 | |
| AA464152 | QSCN6b | Quiescin Q6 | 2.49 ± 0.48, 0.60 | 3.18 ± 0.04, 0.04 | 2.95 ± 0.35, 0.41 | ||
| AA488084 | SOD2b | Superoxide dismutase 2 | 3.26 ± 0.30, 0.32 | 2.62 ± 0.34, 0.38 | 2.02 ± 0.13, 0.14 | ||
| AA599072 | USP46b | Ubiquitin-specific protease 46 | 2.38 ± 0.07, 0.07 | 2.11 ± 0.07, 0.08 | 2.48 ± 0.22, 0.24 | ||
| Cell Shape/Adhesion/Membrane-Associated Functions | |||||||
| AA461325 | ADD3b | Adducin 3 | 2.13 ± 0.26, 0.28 | 2.13 ± 0.16, 0.18 | 2.15 ± 0.27, 0.30 | ||
| AA495790 | ARHBb | RhoB | 4.31 ± 0.94, 1.20 | 3.89 ± 0.41, 0.45 | 2.92 ± 0.45, 0.54 | ||
| AA464578 | ARHGEF2c | Guanine nucleotide exchange factor 2 | −2.02 ± 0.06, 0.07 | −1.63 ± 0.06, 0.07 | −1.61 ± 0.07, 0.07 | ||
| AA873355 | ATP1A1b | ATPase Na+/K+ transporting α 1 | 3.89 ± 0.08, 0.08 | 3.52 ± 0.17, 0.17 | 3.98 ± 0.53, 0.62 | ||
| AA283090 | CD44 | CD44 antigen | 4.23 ± 0.59, 0.68 | 1.73 ± 0.27, 0.32 | 1.41 ± 0.09, 0.09 | ||
| AA132090 | CD53 | CD53 antigen | 1.81 ± 0.24, 0.28 | n.d. | 2.24 ± 0.17, 0.17 | ||
| AA412053 | CD9d | CD9 antigen | 2.06 ± 0.15, 0.16 | 1.79 ± 0.07, 0.08 | 2.32 ± 0.30, 0.34 | ||
| AA598787 | CKAP4d | Cytoskeleton-associated protein 4 | 2.43 ± 0.08, 0.09 | 1.68 ± 0.31, 0.39 | 2.01 ± 0.12, 0.11 | ||
| H20658 | CNTN1 | Contactin 1 | 1.23 ± 0.04, 0.06 | 1.44 ± 0.06, 0.05 | 2.06 ± 0.07, 0.07 | ||
| N66043 | EEA1 | Endosome-associated protein 1 | −1.27 ± 0.03, 0.03 | −2.08 ± 0.00, 0.00 | −1.04 ± 0.02, 0.03 | ||
| AA464965 | FGD1c | Faciogenital dysplasia | 1.82 ± 0.10, 0.09 | 1.79 ± 0.25, 0.30 | 2.79 ± 0.18, 0.19 | ||
| AA490466 | GJB2d | Gap junction protein β 2 26 kDa (connexin 26) | 4.28 ± 0.63, 0.73 | 3.83 ± 0.39, 0.44 | 1.11 ± 1.11, −1.11 | ||
| AA464526 | IL1R1d | IL-1 receptor, type I | −2.97 ± 0.02, 0.03 | −1.57 ± 0.10, 0.11 | −3.02 ± 0.01, 0.01 | PRB −3.4 | |
| AA464423 | MPZL1b | Myelin protein zero-like 1 | 3.14 ± 0.17, 0.18 | 3.98 ± 0.46, 0.53 | 4.15 ± 1.00, 1.34 | ||
| R42736 | MYT1d | Myelin transcription factor 1 | 2.15 ± 0.24, 0.27 | 1.71 ± 0.12, 0.14 | 2.19 ± 0.22, 0.24 | ||
| AA281731 | NKTRd | Natural killer-tumor recognition sequence | 2.11 ± 0.16, 0.18 | 1.52 ± 0.04, 0.04 | 2.66 ± 0.30, 0.34 | ||
| H22445 | NPTX1 | Neuronal pentraxin 1 | 2.19 ± 0.17, 0.17 | 1.44 ± 0.16, 0.19 | n.d. | ||
| N22904 | PDPK1d | 3-Phosphoinositide dependent protein kinase-1 | 2.13 ± 0.10, 0.12 | 2.13 ± 0.23, 0.25 | 1.63 ± 0.04, 0.05 | 2.79 | |
| R65993 | PSG9c | Pregnancy specific β1-glycoprotein 9 | 2.26 ± 0.03, 0.02 | 1.96 ± 0.37, 0.47 | 1.78 ± 0.08, 0.07 | ||
| AA425934 | S100A1c | S100 calcium-binding protein A1 | −2.30 ± 0.03, 0.03 | −1.93 ± 0.01, 0.01 | −1.78 ± 0.02, 0.02 | ||
| R32848 | S100Pb | S-100 calcium-binding protein P | 5.96 ± 1.75, 2.46 | 4.93 ± 1.55, 2.25 | 13.47 ± 2.25, 2.71 | PRA 2.4 PRB 3.6 | |
| AA042990 | SEMA3Cd | Semaphorin 3C | −2.39 ± 0.02, 0.02 | −1.75 ± 0.09, 0.11 | −2.09 ± 0.00, 0.00 | ||
| W19822 | SEMA6Cc | Semaphorin 6C | 2.04 ± 0.24, 0.26 | 1.50 ± 0.07, 0.08 | 1.86 ± 0.15, 0.16 | ||
| AA626264 | SH3MD3 | SH3 multiple domains 3 | 1.83 ± 0.27, 0.31 | 2.08 ± 0.22, 0.25 | 1.19 ± 1.19, −1.19 | ||
| AA133656 | SLC11A2d | Solute carrier family 11, member 2 | −2.37 ± 0.03, 0.03 | n.d. | −2.34 ± 0.01, 0.01 | ||
| R28280 | SLC7A1c | Solute carrier family 7, member 1 | 2.18 ± 0.03, 0.03 | 1.74 ± 0.02, 0.03 | 1.78 ± 0.06, 0.06 | ||
| AA707473 | SSX2IPc | Synovial sarcoma, X breakpoint 2 interacting protein | 2.04 ± 0.17, 0.17 | 1.78 ± 0.05, 0.05 | 1.73 ± 0.00, 0.01 | ||
| AA256386 | STARD13c | START domain containing 3, RhoGAP homolog | 1.61 ± 0.04, 0.05 | 2.13 ± 0.21, 0.23 | 1.80 ± 0.24, 0.28 | ||
| AA486728 | VCLb | Vinculin | 2.96 ± 0.17, 0.18 | 2.32 ± 0.09, 0.10 | 2.57 ± 0.11, 0.12 | 3.20 | |
| Enzyme Activity/Ion Homeostasis/Metabolism | |||||||
| H65660 | ACOX1 | Peroxisomal acyl-CoA oxidase | 2.21 ± 0.18, 0.20 | 1.82 ± 0.12, 0.14 | 1.21 ± 0.06, 0.06 | PRB 4.5 | |
| AA489331 | ADARB1d | Adenosine deaminase DRADA2b | 2.29 ± 0.10, 0.11 | 2.30 ± 0.10, 0.10 | 1.69 ± 0.00, 0.00 | PRB 4.7 | |
| W06980 | APOHb | Apolipoprotein H | 3.64 ± 0.22, 0.24 | 2.22 ± 0.11, 0.11 | 2.56 ± 0.54, 0.68 | ||
| AA862465 | AZGP1c | Zinc-alpha-2-glycoprotein 1 | 1.88 ± 0.09, 0.09 | 1.67 ± 0.02, 0.02 | 2.10 ± 0.37, 0.44 | ||
| H09959 | CHKd | Choline kinase | 2.78 ± 0.06, 0.06 | 2.11 ± 0.18, 0.21 | 1.94 ± 0.01, 0.01 | PRB 2.6 | |
| AA700556 | CSTF3c | Cleavage stimulation factor 3′ pre-RNA subunit 3 | −2.09 ± 0.05, 0.05 | −1.95 ± 0.02, 0.02 | −1.90 ± 0.04, 0.04 | ||
| AA487460 | DPYSL2d | Dihydropyrimidinase related protein-2 | 2.97 ± 0.34, 0.38 | 3.71 ± 0.33, 0.36 | 1.60 ± 0.35, 0.45 | PRB 2.0 | |
| T73556 | FACL2d | Long chain fatty acid acyl-coA ligase | 2.85 ± 0.36, 0.40 | 2.68 ± 0.18, 0.20 | 1.61 ± 0.35, 0.44 | ||
| W95082 | HSD11B2d | Hydroxysteroid-11β-dehydrogenase 2 | 3.02 ± 0.21, 0.22 | 1.88 ± 0.23, 0.26 | 2.64 ± 0.27, 0.31 | PRA 6.5 PRB 22.6 | |
| AA018658 | KIAA0193c | Secernin 1 | 2.14 ± 0.14, 0.15 | 1.63 ± 0.10, 0.10 | 1.84 ± 0.12, 0.13 | ||
| AA701081 | LRRTM2c | Leucine-rich repeat transmembrane 2 | 1.56 ± 0.12, 0.13 | 1.69 ± 0.07, 0.07 | 2.04 ± 0.11, 0.11 | ||
| T91261 | MAN1A1d | Mannosidase α class 1A, member 1 | 2.50 ± 0.28, 0.31 | 1.53 ± 0.12, 0.14 | 2.38 ± 0.24, 0.28 | ||
| T59245 | MAT2Ab | S-Adenosylmethionine synthetase γ | 2.21 ± 0.12, 0.12 | 2.03 ± 0.06, 0.05 | 2.06 ± 0.29, 0.33 | ||
| H72723 | MT1B | Metallothionein IB | 1.30 ± 0.05, 0.04 | 1.32 ± 0.09, 0.09 | 2.31 ± 0.13, 0.14 | ||
| T56281 | MT1Fc | Metallothionein IF | 1.50 ± 0.05, 0.04 | 1.70 ± 0.01, 0.01 | 2.16 ± 0.01, 0.01 | ||
| H53340 | MT1G | Metallothionein IG | 1.34 ± 0.08, 0.09 | 1.41 ± 0.02, 0.02 | 2.50 ± 0.21, 0.22 | ||
| N80129 | MT1X | Metallothionein IL | 1.46 ± 0.08, 0.09 | 1.52 ± 0.01, 0.01 | 2.16 ± 0.26, 0.29 | ||
| N78582 | PRKAB2d | AMP-activated protein kinase β2 | 2.36 ± 0.12, 0.13 | 2.23 ± 0.06, 0.06 | 1.50 ± 0.01, 0.02 | ||
| R10154 | SENP3d | SUMO1/sentrin/SMT3-specific protease 3 | 2.54 ± 0.26, 0.30 | 1.95 ± 0.18, 0.20 | 3.11 ± 0.48, 0.56 | ||
| AA453813 | SIAT4Cd | Sialyltransferase 4C | 1.59 ± 0.07, 0.07 | 3.02 ± 0.08, 0.08 | 2.82 ± 0.01, 0.00 | ||
| H58873 | SLC2A1c | Glucose transporter | 1.76 ± 0.07, 0.08 | 1.67 ± 0.16, 0.18 | 2.33 ± 0.00, 0.01 | ||
| A1653116 | SULF1d | Sulfatase 1 | −2.49 ± 0.01, 0.01 | −2.48 ± 0.01, 0.01 | −1.15 ± 0.04, 0.05 | ||
| N22272 | UGT8 | UDP glycosyltransferase 8 | n.d. | 1.34 ± 1.34, −1.34 | n.d. | ||
| AA425900 | UNG2d | Uracil-DNA glycosylase 2 | −2.37 ± 0.01, 0.01 | −2.59 ± 0.05, 0.05 | −1.61 0.03, 0.03 | ||
| AA457115 | YARSb | Tyrosyl-tRNA synthetase | 3.23 ± 0.51, 0.62 | 3.00 ± 0.52, 0.64 | 2.52 ± 0.50, 0.62 | ||
| Unknown Function | |||||||
| A1650352 | 24653 | Clone 24653 | 1.48 ± 0.19, 0.22 | 1.88 ± 1.88, −1.88 | 2.68 ± 0.43, 0.52 | ||
| AA454990 | BTBD3b | BTB/POZ domain containing 3 | 2.80 ± 0.17, 0.18 | 2.77 ± 0.49, 0.60 | 2.58 ± 0.70, 0.95 | ||
| AA887201 | C13orf1d | Chr 13 open reading frame 1 | 1.86 ± 0.31, 0.37 | 4.39 ± 0.07, 0.07 | 2.38 ± 0.27, 0.32 | ||
| H17638 | C6orf11c | Chr 6 open reading frame 11 | 1.52 ± 0.06, 0.06 | 1.72 ± 0.14, 0.16 | 2.05 ± 0.11, 0.11 | ||
| AA405625 | C6orf130d | Chr 6 open reading frame 130 | 3.06 ± 0.13, 0.13 | 1.88 ± 0.19, 0.22 | 3.57 ± 0.09, 0.10 | ||
| N57754 | CAGH3 | CAGH3 | n.d. | n.d. | 2.06 ± 0.16, 0.17 | ||
| N80458 | DKFZP434B168 | DKFZP434B168 | 2.01 ± 0.17, 0.19 | 1.62 ± 0.02, 0.02 | n.d. | ||
| AA707503 | DKFZP434I092 | DKFZP434I092 | 2.41 ± 0.23, 0.27 | 1.12 ± 0.07, 0.07 | n.d. | ||
| N36172 | DKFZp564A023 | DKFZp564A023 | 1.46 ± 0.10, 0.10 | 1.80 ± 0.05, 0.05 | 2.11 ± 0.09, 0.10 | ||
| A1635773 | FLJ13612d | Putative secretory protein hBET3 | 1.98 ± 0.09, 0.10 | 2.42 ± 0.32, 0.36 | 2.84 ± 0.54, 0.68 | ||
| R32025 | FLJ90754b | EUROIMAGE 248114 | 4.73 ± 0.56, 0.64 | 7.94 ± 0.59, 0.63 | 4.71 ± 0.70, 0.81 | ||
| AA142980 | GAF1b | γ-SNAP-associated factor 1 | 2.76 ± 0.30, 0.34 | 2.66 ± 0.30, 0.34 | 2.32 ± 0.24, 0.27 | ||
| AA700631 | Hs clone 23712b | FLJ35626 | 2.38 ± 0.04, 0.04 | 2.48 ± 0.20, 0.21 | 3.46 ± 0.35, 0.39 | ||
| AA489640 | IFIT1 | Interferon-inducible 56-kDa protein | −1.71 ± 0.10, 0.12 | −2.08 ± 0.01, 0.01 | −1.17 ± 0.04, 0.03 | ||
| AA406589 | KIAA0232b | KIAA0232 protein | 2.08 ± 0.30, 0.34 | 2.07 ± 0.25, 0.28 | 2.41 ± 0.46, 0.56 | ||
| A1215927 | KIAA0285d | KIAA0285 protein | −2.60 ± 0.04, 0.05 | −2.03 ± 0.06, 0.07 | −1.82 ± 0.10, 0.13 | ||
| AA062802 | KIAA0354d | KIAA0354 protein | 1.95 ± 0.19, 0.21 | 2.35 ± 0.13, 0.13 | 3.32 ± 0.54, 0.65 | ||
| AA706967 | KIAA0650c | KIAA0650 protein | 1.71 ± 0.04, 0.04 | 2.14 ± 0.10, 0.09 | 1.51 ± 0.20, 0.24 | ||
| AA775275 | LMTK2 | Lemur tyrosine kinase 2 | 4.29 ± 0.74, 0.89 | 1.46 ± 0.23, 0.26 | 1.95 ± 0.30, 0.35 | ||
| N59057 | MGC10871 | DKFZp586F1322 | 1.47 ± 0.17, 0.19 | 1.62 ± 0.09, 0.09 | 2.19 ± 0.22, 0.24 | ||
n.d., Not detected.
Reported by Richer et al. (10).
Transcript regulated 2-fold or more in all cells.
Transcript regulated 2-fold or more in one cell line and 1.5-fold or more in the remaining two cell lines.
Transcript regulated 2-fold or more in two cell lines.
Global Pattern of Early Progestin Regulation Is Unaffected by Altering PRA:PRB Ratio
To determine whether progressive increases in PRA:PRB ratio altered progestin-regulated gene expression at 6 h, the pattern of regulation of the set of 133 progestin-responsive genes was compared with PRA:PRB ratio, total PR level, or individual PRA or PRB levels (Fig. 1, B and C, and data not shown). There was no overall effect of increasing PRA:PRB ratio (Fig. 1B) or PRA, PRB, or total PR level (Fig. 1C and data not shown) on mean or median fold up- or down-regulation of this gene set. PR levels and PRA:PRB ratio were compared, as fixed effects in a linear mixed effects model, against log2 fold regulation. In each case the mean line of fit for both up- and down-regulated genes had a slope close to zero (data not shown) suggesting no influence by altered PR expression. This was confirmed when the identified set of 133 genes that were regulated by progestins at 6 h were compared across arrays by hierarchical cluster analysis (Fig. 1D). The data set can be dichotomized on the basis of PRA:PRB ratio or PR levels. Clustering on genes and arrays was more likely to reflect grouping of PR levels than PRA:PRB ratio (Fig. 1D), and progestin regulation was correlated across the data set as a whole (R2 = 0.773), suggesting that progestin regulation at early time points was not overall dependent on PRA:PRB ratio. We concluded that although total PR expression influenced early response to progestin, no profound effect of altering PRA:PRB ratio was seen on the overall profile of affected genes.
Effect of Altering PRA:PRB Ratio on Early Progestin Regulation of Specific Gene Expression
Given that no global influence of progressively increasing PRA:PRB ratio was seen on early progestin response, we next asked whether a marked increase in PRA:PRB ratio resulted in altered regulation of just a subset of key progestin target genes. Fold regulation of gene expression was compared between cells with the lowest PRA:PRB ratio (T-47DE3 cells: PRA:PRB ratio 1.3:1) and those with the highest (T-47DN5 cells, after PRA induction: PRA:PRB ratio 5.1:1) by linear regression analysis (Fig. 2A). Progestin regulation in the two data sets was concordant. Although a number of genes fell outside the 95% confidence intervals (Fig. 2A), these represented genes that were regulated, although to different levels, in both cell lines, and few were regulated in one cell line and not the other. A total of 113 genes were progestin regulated, and 105 (105/113, 93%) of these were contained in the 133-gene set described in Table 2. Just 10 genes were differentially regulated between cells with low and high PRA:PRB. Furthermore, when the regulation of these genes was compared with PRA:PRB ratios across all cell lines and conditions, only three showed a significant correlation (Fig. 2D). Two of the genes represented transmembrane receptors: activin receptor-like kinase 1 (R2 = 0.44) and the P2Y6 G-protein coupled receptor (R2 = 0.62). The other gene represented an uncharacterized open reading frame on chromosome 14 (R2 = 0.59). In summary, a marked 4- to 5-fold increase in PRA:PRB ratio had little impact on progestin-regulated gene expression, showing that early transcriptional targets of PR were not sensitive either to progressive (Fig. 1) or to dramatic (Fig. 2) alterations in PRA:PRB.
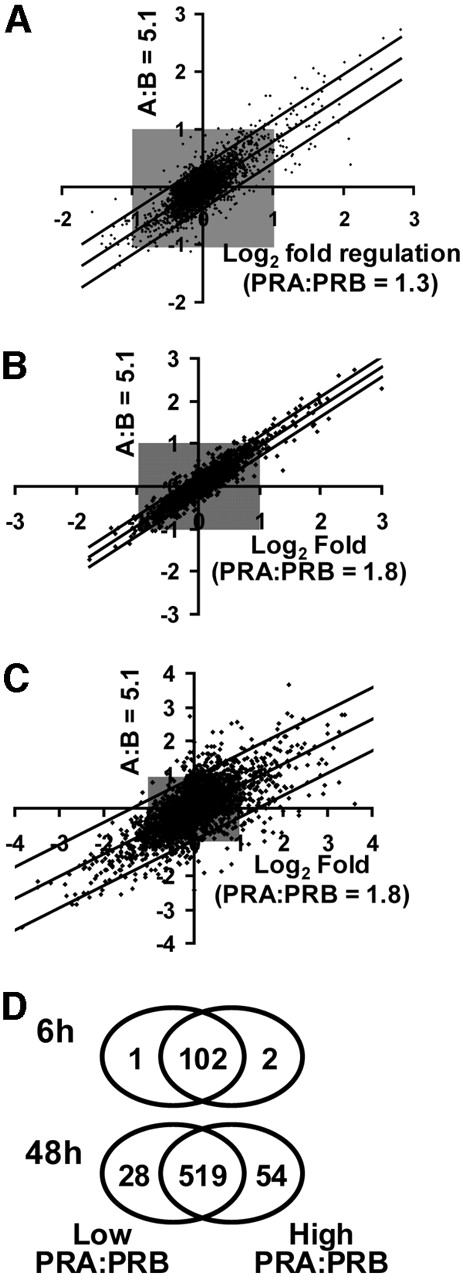
Linear Regression Analysis of Transcript Expression A, Transcript regulation by progestins at 6 h was compared between cells with the lowest PRA:PRB ratio (T-47DE3 wild-type, PRA:PRB = 1.3 at time of treatment) and the highest (T-47DN5 PRA overexpressing, PRA:PRB = 5.1 at time of treatment). Log2 fold transcriptional regulation in uninduced T-47DE3 cells (PRA:PRB = 1.3 at time of treatment) is plotted against induced T-47DN5 (PRA:PRB = 5.1 at time of treatment). The regression line and 95% confidence intervals (2 sds from the regression line of fit) are shown. B, Regression analysis of transcriptional regulation at 6 h in T-47DN5 cells with and without overexpression of PRA. C, Regression analysis of transcriptional regulation at 48 h in T-47DN5 cells with and without overexpression of PRA. D, Schematic representation of numbers of genes that were progestin regulated at 6 h and 48 h, with low PRA:PRB ratio only or high PRA:PRB only, and those progestin targets that were not differentially regulated.
Genes Regulated by Progestins at 48 h in T-47D Cells Containing Both PRA and PRB
The finding that early profiles of transcriptional regulation were essentially indistinct between cells expressing PRA and PRB at broadly different levels and ratios suggested that, in cells endogenously expressing both receptors, the transcriptional differences between PRA and PRB may be reflected as divergent patterns of regulation after longer progestin exposure. Therefore, progestin regulation at 6 h and 48 h was compared in a single cell line (T-47DN5) with or without induction of PRA (Fig. 2, B and C). This cell line was selected because it produced the greatest difference in relative PRA and PRB expression before and after PRA induction (Fig. 1A). Furthermore, the overall expression of PRA and PRB in these cells, with and without PRA induction, fell within the range of expression levels in the three cell lines. When transcriptional regulation at 6 h of progestin treatment was compared by regression analysis, 77 progestin-regulated genes were identified, and there was a high level of concordance in fold regulation between T-47DN5 with low and high PRA expression (Fig. 2B), in agreement with the comparison between the two different cell lines shown in Fig. 2A. In contrast, when transcriptional profiles were compared at 48 h of progestin treatment, more genes were progestin regulated at this time overall, and many more genes were identified by regression analysis as differentially regulated (Fig. 2C). In total, 601 genes were regulated 2-fold or more by 48 h of progestin treatment in cells with low PRA:PRB ratio, high PRA:PRB ratio, or both, compared with just 77 in T-47DN5 cells treated for 6 h. As was seen after 6 h exposure to progestin, at 48 h there was no significant difference in the number of regulated genes or the median fold up- or down-regulation with low or high PRA:PRB ratio (median 2.5-fold down and 2.85-fold up with low PRA:PRB compared with 2.5-fold down and 2.55-fold up with high PRA:PRB; data not shown), suggesting that there was not an overall effect on progestin response of increasing PRA expression. There were 519 genes that were regulated at 48 h in T-47DN5 with low or high PRA:PRB or both, which were not significantly different. However, a small subgroup of genes was identified that were differentially regulated in cells with low or high PRA:PRB (Fig. 2D).
Genes with Altered Responsiveness to Progestins with High PRA:PRB Ratio
When PRA:PRB was high, the overall ability of progestin to regulate gene expression was not markedly altered, as outlined above. However, there was a small proportion (82/601; 14%) of all progestin-regulated genes that were either switched on or off when PRA:PRB ratio was high at 48 h, or were regulated in the opposite direction in the two conditions (Table 3). Fifty-four genes (54/82, 66% of these genes) acquired responsiveness to progestins when the PRA:PRB ratio was high, as they were not progestin regulated in cells with low PRA:PRB ratio (Fig. 2D and Table 3). These genes therefore acquired responsiveness to progestins only when PRA:PRB ratio was high. There were 28 genes (28/82, 34%) that were progestin regulated in cells with a low PRA:PRB ratio but which lost regulation when the PRA:PRB ratio was high (Fig. 2D and Table 3). The genes of known function within the group of 82 differentially regulated genes are shown in Fig. 3.
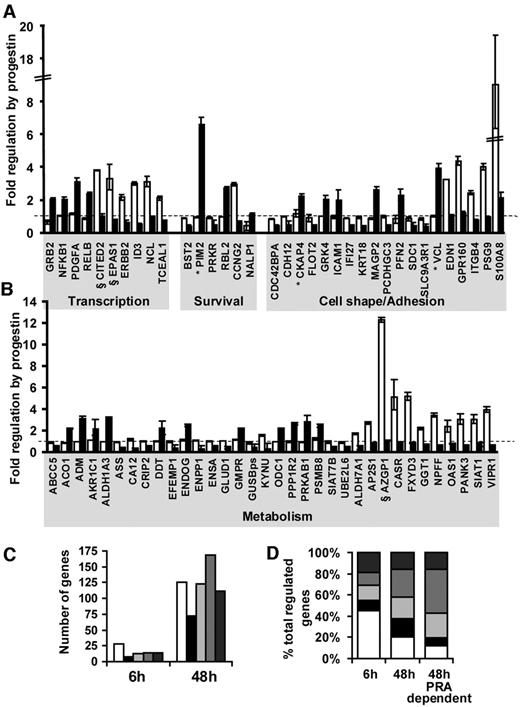
Altered Progestin Response at 48 h A and B, T-47DN5 cells were treated for 24 h with 10 mm IPTG or vehicle and then for 48 h with 10 nm ORG2058 or vehicle. Progestin-regulated transcripts that were switched on or off by overexpression of PRA are shown. Open bars represent progestin regulation with low PRA:PRB, solid bars represent regulation when PRA:PRB is high. Only regulated transcripts for known genes were shown. In addition, progestin regulation of nine uncharacterized transcripts was switched on by overexpression of PRA, and four were switched off. *, Increased by progestin at 6 h, returned to baseline at 48 h; §, increased by progestin at 6 h and 48 h, returned to baseline when PRA:PRB was high. C and D, Genes regulated at 6 and 48 h after progestin treatment are broken into broad functional categories. White bars, Transcriptional regulators; black bars, cell cycle regulation/survival; light gray bars, regulators of cell shape, adhesion, and membrane-associated functions; midgray bars, metabolic regulation and enzyme activity; dark gray bars, genes of unknown function. Gene names appearing in this figure have been expanded in Table 3.
Differential Regulation at 48 h
| GenBank Accession No. | Symbol | Gene Name | Fold Regulation by Progestin at 48 h | |
|---|---|---|---|---|
| PRA:PRB = 1.8 | PRA:PRB = 5.1 | |||
| Transcriptional Regulation/Signal Transduction | ||||
| AA988203 | GRB2 | Growth factor receptor-bound protein 2 | −1.50 ± 0.14, 0.13 | 2.04 ± 0.08, 0.09 |
| AA451716 | NFKB1 | NF-κB polypeptide 1 (p105) | 1.06 ± 0.02, 0.02 | 2.04 ± 0.12, 0.13 |
| AA701502 | PDGFA | Platelet-derived growth factor A | 1.17 ± 0.03, 0.03 | 3.11 ± 0.23, 0.25 |
| AA258001 | RELB | v-rel homolog B, NF-κB3 | −1.14 ± 0.05, 0.05 | 2.37 ± 0.07, 0.07 |
| AA115076 | CITED2 | Cbp/p300-interacting transactivator 2 | 3.81 ± 0.04, 0.04 | 1.04 ± 0.10, 0.11 |
| AI286222 | EPAS1 | Endothelial PAS domain protein 1 | 3.31 ± 0.68, 0.86 | −1.22 ± 0.02, 0.02 |
| AA446928 | ERBB2 | v-erb-b2 oncogene | 2.17 ± 0.16, 0.18 | −1.57 ± 0.15, 0.13 |
| AA482119 | ID3 | Inhibitor of DNA binding 3 | 2.99 ± 0.11, 0.11 | −1.95 ± 0.05, 0.05 |
| AA476294 | NCL | Nucleolin | 3.10 ± 0.30, 0.33 | −1.00 ± 0.02, 0.02 |
| AA478480 | TCEAL1 | Transcription elongation factor A (SII)-like 1 | 2.12 ± 0.12, 0.13 | −1.42 ± 0.05, 0.05 |
| Cell Cycle Regulation/Survival/Apoptosis | ||||
| AA485371 | BST2 | Bone marrow stromal cell antigen 2 | −1.12 ± 0.03, 0.03 | −2.70 ± 0.10, 0.10 |
| AA863383 | PIM2 | Pim-2 protooncogene | −1.05 ± 0.04, 0.04 | 6.58 ± 0.42, 0.44 |
| AA010079 | PRKR | Protein kinase interferon-inducible dsRNA dependent | −1.08 ± 0.06, 0.05 | −2.06 ± 0.33, 0.29 |
| N50554 | RBL2 | Retinoblastoma-like 2 (p130) | −1.03 ± 0.02, 0.02 | 2.69 ± 0.09, 0.09 |
| AA489647 | CCNG2 | Cyclin G2 | 2.97 ± 0.09, 0.10 | −1.59 ± 0.11, 0.10 |
| T89383 | NALP1 | NACHT, leucine-rich repeat and PYD containing 1 | −2.24 ± 0.28, 0.25 | 1.12 ± 0.08, 0.08 |
| Cell Shape/Adhesion/Membrane-Associated Functions | ||||
| N35241 | CDC42BPA | CDC42 binding protein kinase α (DMPK-like) | −1.19 ± 0.03, 0.03 | −2.41 ± 0.07, 0.07 |
| AA418564 | CDH12 | Br-cadherin | −1.00 ± 0.03, 0.03 | −2.10 ± 0.31, 0.27 |
| AA598787 | CKAP4 | Cytoskeleton-associated protein 4 | 1.16 ± 0.19, 0.23 | 2.22 ± 0.14, 0.15 |
| R73545 | FLOT2 | Flotillin 2 | −1.09 ± 0.23, 0.19 | −2.26 ± 0.06, 0.06 |
| N23898 | GRK4 | G protein-coupled receptor kinase 4 | 1.03 ± 0.01, 0.01 | 2.04 ± 0.20, 0.22 |
| R77293 | ICAM1 | Intercellular adhesion molecule 1 | −1.04 ± 0.10, 0.09 | 2.01 ± 0.47, 0.61 |
| AA157813 | IFI27 | Interferon, α-inducible protein 27 | −1.12 ± 0.03, 0.03 | −2.11 ± 0.02, 0.02 |
| AA664179 | KRT18 | Keratin 18 | −1.04 ± 0.06, 0.06 | −2.70 ± 0.07, 0.07 |
| AA056013 | MAGP2 | Microfibril-associated glycoprotein-2 | −1.15 ± 0.05, 0.04 | 2.59 ± 0.19, 0.20 |
| R89615 | PCDHGC3 | Protocadherin 43 | −1.01 ± 0.06, 0.06 | −2.17 ± 0.01, 0.01 |
| AA040703 | PFN2 | Profilin 2 | −1.16 ± 0.27, 0.22 | 2.30 ± 0.31, 0.36 |
| AA074511 | SDC1 | Syndecan 1 | −1.17 ± 0.11, 0.10 | −2.23 ± 0.19, 0.18 |
| AA425299 | SLC9A3R1 | Ezrin-radixin-moesin binding phosphoprotein-50 | −1.18 ± 0.08, 0.08 | −2.53 ± 0.15, 0.14 |
| AA486728 | VCL | Vinculin | 1.01 ± 0.03, 0.03 | 3.93 ± 0.28, 0.30 |
| H11003 | EDN1 | Endothelin 1 | 3.25 ± 0.01, 0.01 | 1.10 ± 0.02, 0.02 |
| AA291259 | GPR160 | G protein-coupled receptor 160 | 4.36 ± 0.26, 0.28 | 1.21 ± 0.09, 0.10 |
| AA485668 | ITGB4 | Integrin β-4 subunit | 2.44 ± 0.13, 0.13 | −1.32 ± 0.05, 0.05 |
| R65993 | PSG9 | Pregnancy specific β1-glycoprotein 9 | 4.02 ± 0.18, 0.19 | −1.06 ± 0.01, 0.01 |
| AA086471 | S100A8 | S100 calcium-binding protein A8 (calgranulin A) | 16.33 ± 2.60, 3.09 | 2.12 ± 0.31, 0.37 |
| Enzyme Activity/Ion Homeostasis/Metabolism | ||||
| N68159 | ABCC5 | ATP-binding cassette, subfamily C, member 5 | −1.15 ± 0.09, 0.08 | −2.22 ± 0.17, 0.16 |
| AA156988 | ACO1 | Aconitase 1 | −1.14 ± 0.05, 0.05 | 2.19 ± 0.06, 0.06 |
| AA446120 | ADM | Adrenomedullin | −1.02 ± 0.02, 0.02 | 3.13 ± 0.18, 0.19 |
| R93124 | AKR1C1 | Dihydrodiol dehydrogenase | 1.09 ± 0.00, 0.00 | 2.17 ± 0.61, 0.86 |
| AA455235 | ALDH1A3 | Aldehyde dehydrogenase 6 | −1.05 ± 0.01, 0.01 | 3.11 ± 0.14, 0.14 |
| AA676466 | ASS | Argininosuccinate synthetase | −1.10 ± 0.02, 0.02 | −3.08 ± 0.11, 0.11 |
| AA171613 | CA12 | Carbonic anhydrase precursor | 1.17 ± 0.11, 0.12 | −3.72 ± 0.13, 0.12 |
| AA873604 | CRIP2 | Cysteine-rich heart protein | 1.01 ± 0.04, 0.04 | −2.23 ± 0.17, 0.16 |
| AA397824 | DDT | Dopachrome tautomerase | 1.02 ± 0.05, 0.05 | 2.20 ± 0.54, 0.72 |
| AA875933 | EFEMP1 | Epidermal growth factor-containing fibulin-like extracellular matrix protein 1 | −1.05 ± 0.09, 0.08 | −2.83 ± 0.35, 0.31 |
| AA629804 | ENDOG | Endonuclease G | 1.08 ± 0.07, 0.08 | 2.45 ± 0.11, 0.11 |
| T69450 | ENPP1 | Ectonucleotide pyrophosphatase/phosphodiesterase 1 | 1.09 ± 0.04, 0.04 | −3.01 ± 0.27, 0.25 |
| AA497038 | ENSA | Endosulfine α | −1.04 ± 0.04, 0.04 | −2.03 ± 0.12, 0.11 |
| AA017175 | GLUD1 | Glutamate dehydrogenase | 1.04 ± 0.03, 0.03 | −2.46 ± 0.13, 0.13 |
| AA410375 | GMPR | Guanosine monophosphate reductase | 1.14 ± 0.05, 0.06 | 2.17 ± 0.05, 0.05 |
| H87471 | KYNU | l-Kynurenine hydrolase | 1.55 ± 0.10, 0.11 | 0.27 ± 0.60, 0.51 |
| AA028921 | na | β-Glucuronidase pseudogene | −1.19 ± 0.11, 0.10 | −2.29 ± 0.37, 0.32 |
| AA461467 | ODC1 | Ornithine decarboxylase 1 | −1.05 ± 0.00, 0.00 | 2.12 ± 0.13, 0.13 |
| AA428335 | PPP1R2 | Protein phosphatase 1, regulatory (inhibitor) subunit 2 | −1.02 ± 0.06, 0.05 | 2.62 ± 0.09, 0.09 |
| AA432271 | PRKAB1 | Protein kinase, AMP-activated, β1 noncatalytic subunit | −1.10 ± 0.04, 0.04 | 2.85 ± 0.45, 0.54 |
| AA181300 | PSMB8 | Proteasome (prosome, macropain) subunit, β type, 8 | 1.19 ± 0.11, 0.13 | 2.44 ± 0.15, 0.16 |
| AA497051 | SIAT7B | Sialyltransferase 7B | −1.07 ± 0.10, 0.09 | −2.43 ± 0.08, 0.08 |
| AA292074 | UBE2L6 | Ubiquitin-conjugating enzyme | −1.11 ± 0.06, 0.06 | −2.68 ± 0.14, 0.14 |
| AA421518 | AP2S1 | Adaptor-related protein complex 2, σ1 subunit | 2.73 ± 0.10, 0.11 | −1.20 ± 0.08, 0.08 |
| AA102646 | ALDH7A1 | Aldehyde dehydrogenase 7 family, member A1, Antiquitin | 1.70 ± 0.10, 0.10 | 0.44 ± 0.20, 0.18 |
| AA862465 | AZGP1 | Zinc α-2-glycoprotein 1 | 12.30 ± 0.20, 0.20 | 1.09 ± 0.03, 0.03 |
| AA862999 | CASR | Calcium-sensing receptor | 5.14 ± 1.20, 1.57 | −1.07 ± 0.02, 0.02 |
| AA126009 | FXYD3 | FXYD domain containing ion transport regulator 3 | 5.16 ± 0.37, 0.39 | −1.17 ± 0.02, 0.02 |
| H72018 | GGT1 | γ-Glutamyltransferase 1 | 2.18 ± 0.08, 0.09 | −1.40 ± 0.05, 0.04 |
| AA460688 | NPFF | Neuropeptide FF-amide | 3.44 ± 0.21, 0.23 | −1.63 ± 0.02, 0.02 |
| AA146773 | OAS1 | (2′–5′) Oligoadenylate synthetase 1 | 2.35 ± 0.47, 0.59 | −1.26 ± 0.02, 0.02 |
| H03954 | PANK3 | Pantothenate kinase 3 | 3.03 ± 0.45, 0.53 | −1.60 ± 0.02, 0.02 |
| AA598652 | SIAT1 | Sialyltransferase 1 | 3.03 ± 0.39, 0.44 | −1.36 ± 0.21, 0.18 |
| H73241 | VIPR1 | Vasoactive intestinal peptide receptor 1 | 3.95 ± 0.28, 0.30 | −1.67 ± 0.09, 0.09 |
| Unknown Function | ||||
| H38848 | ARID4B | DEAD/H (Asp-Glu-Ala-Asp/His) box polypeptide 21 | 0.77 ± 0.04, 0.04 | 2.63 ± 0.17, 0.18 |
| AA679569 | C14orf109 | Chr 14 ORF 109 | −1.19 ± 0.06, 0.06 | 2.36 ± 0.02, 0.02 |
| W92594 | DKFZP564B0769 | DKFZP564B0769 cDNA | 1.05 ± 0.06, 0.07 | 2.21 ± 0.08, 0.09 |
| AA134696 | DKFZp586E1120 | DKFZp586E1120 cDNA | 1.06 ± 0.11, 0.12 | −2.26 ± 0.07, 0.07 |
| N63623 | HHL | KIAA0471 protein | −1.02 ± 0.00, 0.00 | 2.08 ± 0.11, 0.12 |
| AA157787 | KIAA0166 | KIAA0166 protein | 1.20 ± 0.03, 0.03 | 2.55 ± 0.41, 0.49 |
| H16974 | LOC51059 | hypothetical protein LOC51059 | 1.03 ± 0.09, 0.10 | −2.10 ± 0.04, 0.04 |
| AA190941 | TRIO | Triple functional domain (PTPRF interacting) | 1.03 ± 0.00, 0.00 | 2.36 ± 0.73, 1.06 |
| AA400188 | YPEL1 | Yippee-like 1 | 1.07 ± 0.06, 0.06 | 2.90 ± 0.21, 0.23 |
| N90281 | B7 | B7 gene | 3.51 ± 0.94, 1.28 | 1.17 ± 0.13, 0.15 |
| H53658 | PAI-RBP1 | PAI-1 mRNA-binding protein | 2.63 ± 0.03, 0.03 | −1.05 ± 0.03, 0.03 |
| AA961361 | SCOC | Short coiled-coil protein | 2.22 ± 0.14, 0.15 | −1.35 ± 0.04, 0.04 |
| AA482224 | TMEM4 | Transmembrane protein 4 | 2.37 ± 0.17, 0.18 | −2.09 ± 0.94, 0.65 |
na, Not assigned.
The 82 differentially regulated genes identified after 48 h of progestin treatment were not regulated at 6 h in most cases, and it was noteworthy that only 6/82 (7%) genes were identified as progestin-regulated at the early time point. Vinculin, CKAP4, and PIM2 were increased by progestin treatment at 6 h, but that effect was transient, and the augmented transcript levels were not maintained to 48 h in cells with low PRA:PRB ratio (Fig. 3). In cells with high PRA:PRB ratio, transcript levels were maintained, indicating that these genes had a prolonged responsiveness to progestin treatment only when PRA:PRB was high. Conversely, CITED2, EPAS1, and AZGP1 were progestin regulated both at 6 h and 48 h in cells with low PRA:PRB ratio, but in cells with high PRA:PRB ratio transcript levels were low (Fig. 3), indicating that progestin responsiveness had been lost when PRA:PRB was high. The remaining 76/82 (93%) were not progestin regulated at 6 h with low PRA:PRB ratio.
The 82 genes that acquired completely different responsiveness to progestins in cells with a high PRA:PRB ratio were primarily involved in cellular metabolism and regulation of cell shape and adhesion (Table 3), and this is strikingly illustrated in Fig. 3. Furthermore, in these functional groups, it was more common for progestin responsiveness to be acquired, than lost, as genes in these functional groups that were not progestin-regulated in cells with low PRA:PRB ratios commonly acquired the ability to be progestin regulated in cells with high PRA:PRB ratios. Of the 54 genes that acquired responsiveness to progestins with high PRA:PRB ratio, 37 of these (37/54; 69%) were genes involved in cellular metabolism and regulation of cell shape and adhesion.
These data suggested that high PRA:PRB ratios were associated with the acquisition of progestin responsiveness in specific functional groups of genes, notably metabolism and cell shape/adhesion. The acquisition of responsiveness may result from changed predominance of the PRA:PRB heterodimer, in cells expressing similar levels of PRA:PRB, to predominance of the PRA homodimer in cells with high PRA:PRB ratios. The shift in functional groups regulated by progestins between 6 h and 48 h, toward genes involved in cell shape maintenance and metabolism, is in line with previous demonstrations that progestins can regulate many aspects of differentiated cell function (1). Moreover, the enhancement of this shift in cells with high PRA:PRB ratios is also consistent with our previous data that cells with high PRA:PRB ratios have altered progestin regulation of the actin cytoskeleton (23).
The differential regulation observed on microarrays was validated by semiquantitative and real-time RT-PCR analysis. Gene expression was estimated in arbitrary units, either by quantitation from agarose gels or using SYBR green real-time detection, and normalized to transcript levels for the nonregulated β2-microglobulin gene. The relative difference between transcript levels when measured by RT-PCR methods overall confirmed what had been seen by array analysis. When the log2fold data were compared in the same regression analysis as the array results, 13 of 17 genes selected for validation were classified as differentially regulated. The normalized fold regulation, determined by semiquantitative and real-time RT-PCR, of all 17 targets is noted in supplemental Table 1, published as supplemental data on The Endocrine Society’s Journals Online web site at http://mend.endojournals.org. Furthermore, when the PCR products were visualized electrophoretically, the differences in transcriptional regulation were striking (see Fig. 4). The oncogene Pim-2, ribosomal protein S6 kinase, LMO2, and Rho E were increased only in cells with high PRA:PRB ratio, and this was confirmed by semiquantitative RT-PCR (Fig. 4). Expression of calcium binding protein S100A8, and of the n-myc downstream-regulated gene NDRG1, was affected by progestin treatment in cells with both low and high PRA:PRB ratios but was much more strongly regulated in one condition than the other, and this was also confirmed by RT-PCR (Fig. 4).
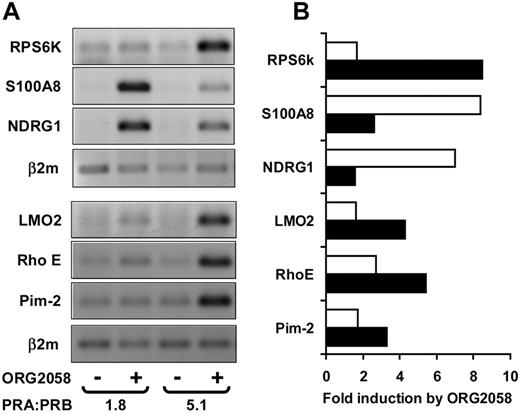
Validation of Differential Transcript Regulation at 48-h Progestin Exposure Differential regulation by 10 nm ORG2058 at 48 h is shown for six targets, detected by limiting cycle number semiquantitative RT-PCR. The nonregulated β2-microglobulin gene was used as a control template. A, Visualization of differentially regulated targets by semiquantitative RT-PCR and agarose gel electrophoresis. PRA:PRB ratio at start of treatment is indicated. B, Normalized fold regulation by progestins in cells with equivalent PRA:PRB (open bars) and PRA predominance (solid bars). RPS6k, 90-kDa ribosomal protein S6 kinase. S100A8, S100 calcium-binding protein A8. NDRG1, n-myc downstream regulated gene; LMO2, Lim only 2.
Profiles of Early and Late Progestin Regulation Are Functionally Distinct
In addition to the distinct functional grouping of genes that were differentially regulated with high and low PRA:PRB ratio, there was an overall shift between early and late functional profiles. When the functions of the 601 genes that were regulated at 48 h were compared with the 77 genes regulated in T-47DN5 at 6 h progestin exposure, two features were noted. First, at 6 h the predominant regulated group was that involved with transcriptional regulation, by contrast with the significantly increased numbers of genes in each functional category regulated at 48 h (Fig. 3C). Second, there was a marked shift in the major functional groups regulated by progestins (Fig. 3D). At 6 h of progestin treatment, 45% of regulated genes represented genes involved in regulation of transcription. The number of genes in this functional group far exceeded any other group of targets. At 48 h progestin exposure, whereas more genes were regulated in each group overall, the number of transcriptional regulators that were altered by progestins was proportionally decreased, with 20% involved in transcriptional regulation. In contrast, genes involved in maintenance of cell shape and metabolic functions increased at 48 h. At 6 h these groups represented, respectively, 14% and 12% of total regulated genes. At 48 h this was increased such that 21% of regulated genes were involved in maintenance of cell shape, adhesion, and membrane function and 26% were involved in metabolic processes (Fig. 3D). Taken together, the proportion of genes involved in transcriptional regulation and cell cycle regulation decreased (55% down to 37%), with a corresponding increase in genes involved in maintenance of cell shape and metabolic functions (26% increased to 47%) when progestin regulation at 6 h and 48 h were compared. This suggested that prolonged progestin exposure for 48 h resulted in a relative shift toward cellular processes involved in basic functioning and homeostasis. The shift toward genes involved in cell shape maintenance and metabolic processes was particularly marked in the subgroup of genes that were differentially regulated as a result of PRA predominance at 48 h. In this group 64% of the genes were involved in regulation of cell shape and metabolism, compared with 19% involved in transcriptional and cell cycle-regulatory processes (Fig. 3D).
PRA Is Not a Dominant Inhibitor of Endogenous Progestin Targets
The observation that marked alterations in the relative expression of PRA and PRB had almost no effect on early progestin signaling and only modest effects on downstream targets was surprising. The transcriptional differences between the two isoforms in vitro are well documented. Furthermore, when progestin regulation is compared between T-47D cells that stably express only PRA or PRB, a remarkably small overlap in gene regulation is seen (10). In particular, PRA has been shown to be less transcriptionally active than PRB and to dominantly inhibit transcriptional regulation by PRB (3, 27). This would predict that overexpression of PRA in cells containing both isoforms would result in diminished numbers of significantly regulated genes when compared with uninduced cells. To determine whether this was true, the frequency distribution of gene regulation was compared, at 48 h (Fig. 5) and at 6 h (data not shown) of progestin treatment, in T-47DN5 cells with and without PRA induction. As can be seen in Fig. 5, the histograms are virtually overlapping. If PRA were to act as an inhibitor of PRB transcriptional activity, a decrease in the number of significantly regulated genes would be expected with increased PRA:PRB ratio. In fact, the proportion of regulated genes in cells with high compared with low PRA:PRB ratio was almost identical, leading to a mean difference in relative frequency of −0.005% in gene regulation categories higher than 2-fold (see Fig. 5, insets).
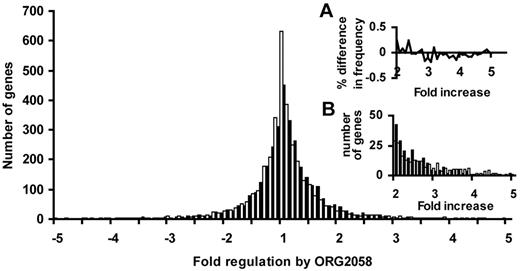
Frequency Distribution of Transcriptional Regulation in T-47DN5 Cells Numbers of genes regulated by progestins at 48 h in T-47DN5 cells expressing equivalent levels of PRA and PRB (open bars) and overexpressing PRA (solid bars) were divided into intervals of 0.1-fold and plotted as individual frequencies in the range of 5-fold decreased and increased expression by progestin. Inset A, The relative difference in frequency was determined by calculating the percent of genes in each interval for the two conditions and subtracting relative frequency in wild-type cells from cells over-expressing PRA. Inset B, Frequency distribution of genes increased 2-fold or greater by progestins.
Progestins Decrease Adhesion in a PRA-Dependent Manner
In view of the high proportion of cell shape- and adhesion-related transcripts that were differentially regulated at 48 h progestin exposure, we examined the effect this may have on cell adhesion in monolayer culture. Progestins had a profound effect on the ability of the cells to readhere, and this effect was more marked in cells with high PRA:PRB ratio (Fig. 6A). After 120 min, progestin-treated cells had statistically significantly impaired adhesion, both with low (35% adherent with progestin vs. 73% of controls; P = 0.00009 by Student’s t test) and high (25% adherent with progestin vs. 85% of controls; P = 0.0001 by Student’s t test) PRA:PRB ratio (Fig. 6A). However, in cells where PRA was present in excess over PRB, the inhibition of adhesion was significantly greater than it was in cells with low PRA:PRB ratio (P = 0.01; Student’s t test). This effect on cell adhesion was only seen after sustained exposure to progestins. Cells that had been treated for only 1 h with progestins before detachment and replating readhered to the substratum at the same rate as vehicle-treated controls (data not shown). The demonstrated differences in adhesion support the view that high PRA:PRB ratios are particularly associated with impaired adhesion.
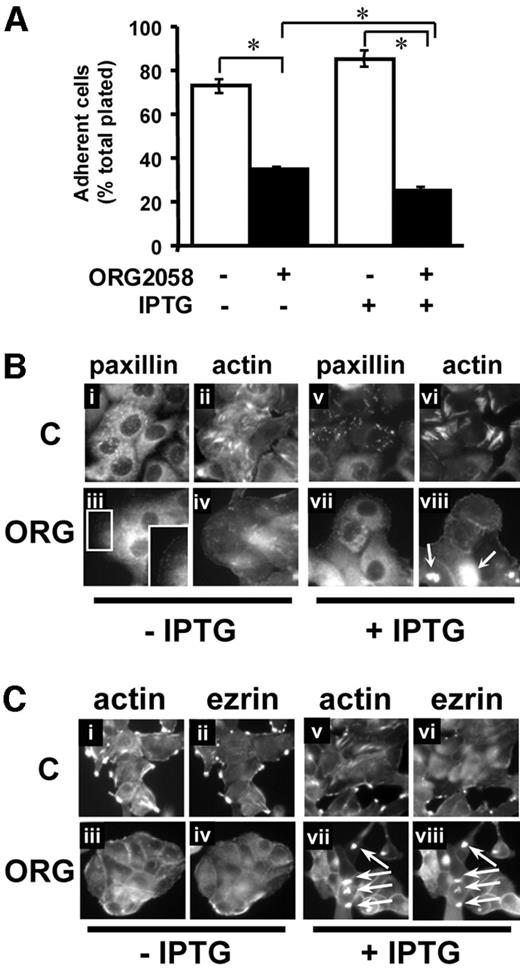
Progestin Regulation of Cell Shape and Adhesion T-47DN5 cells were treated for 24 h with 10 mm isopropyl-β-d-thiogalactopyranoside (IPTG) or vehicle and then for 48 h with 10 nm ORG2058 or vehicle. A, Cells were harvested, counted, and allowed to readhere for 2 h, before reharvesting and counting. Cells that readhered are expressed as a percentage of total replated in each sample. Open bars, Control; solid bars, 48 h ORG2058. Each data point is the mean of three replicates. Error bars represent mean se for the three replicates. B, Control (i, ii, v, vi) and ORG (iii, iv, vii, viii)-treated cells were fixed and stained as described in Materials and Methods, to visualize paxillin (i, iii, v, vii) and polymerized actin (ii, iv, vi, viii). C, Control (i, ii, v, vi) and ORG (iii, iv, vii, viii)-treated cells were fixed and stained as described in Materials and Methods, to visualize polymerized actin (i, iii, v, vii) and ezrin (ii, iv, vi, viii). C, Control; ORG, ORG2058.
Progestins Decrease Focal Adhesions
To investigate whether decreased adhesion was associated with regulation of focal adhesions, we visualized the focal adhesion protein paxillin and filamentous actin in T-47DN5 cells. Dual fluorescent staining of paxillin and filamentous actin in T-47DN5 cells with either low or high PRA:PRB ratio revealed abundant mature focal adhesions underlying many cells (Fig. 6B, i and v), which were linked to networks of filamentous actin bundles (Fig. 6B, compare i with ii and v with vi). Smaller focal contacts were also seen at the outer periphery of some cells. Treatment for 48 h with ORG2058 abolished actin fibers in cells with low PRA:PRB ratio (Fig. 6B, iv) and this was correlated with a loss of paxillin-positive focal adhesions from the ventral surface of the cells (Fig. 6B, iii). In contrast, paxillin staining of small focal contacts was maintained at the cortical edge of cells (Fig. 6B, iii, inset). Interestingly, the same loss of paxillin-positive focal staining and maintenance of small cortical adhesions was also seen in cells with high PRA:PRB ratio (Fig. 6B, vii). However, the progestin effect on actin filaments was more dramatic when PRA was predominant, with filamentous actin bundles being abolished by progestin treatment and replaced with cytoplasmic polymerized actin pools (Fig. 6B, viii, arrows), suggesting that actin fibers were not depolymerized to their actin monomer parts in cells with high PRA:PRB ratio.
Progestins Cause Cytoplasmic Pooling of Polymerized Actin in a PRA-Dependent Manner
The cytoskeleton signaling protein ezrin forms foci at the cytoplasmic side of the cell membrane at points of contact to actin fibers and is involved in fiber attachment to the membrane. We previously demonstrated that progestin treatment caused a redistribution of ezrin protein away from membrane foci and, in cells in which PRA was predominant, resulted in the aberrant accumulation of bright staining pools of ezrin in the cell cytoplasm (23). To determine whether the cytoplasmic polymerized actin pools were associated with pools of ezrin, we costained for ezrin and polymerized actin in progestin-treated cells with low or high PRA:PRB ratio (Fig. 6C). Actin microfilament staining colocalized with ezrin staining at the cell periphery (Fig. 6C, i and ii), and this was abolished by progestin treatment (Fig. 6C, iii and iv). Polymerized actin accumulated into cytoplasmic pools, after progestin treatment, in cells with high PRA:PRB ratio (Fig. 6C, vii), and pooled actin was colocalized with ezrin pools in the dual stained cells (Fig. 6C, viii, arrows). The colocalization of ezrin and polymerized actin in the cytoplasm was confirmed by confocal microscopy (data not shown). The decreased adhesion, focal contacts, and actin filaments support the view that the cell cytoskeleton becomes sensitive to progestin regulation upon prolonged exposure. These findings suggest also that regulation by progestins is altered in cells that have an imbalance of PRA and PRB, leading to aberrant actin depolymerization and disrupted dissociation from membrane adhesion and signaling proteins.
Progestins Increase Focal Adhesion-Mediated Signaling
The actin microfilament remodeling and loss of paxillin-positive focal adhesions from the ventral surface of the cells, coupled with the inhibition of cell adhesion, suggested that progestins were altering focal adhesion signaling. Focal adhesion kinase (FAK) is a key signaling intermediate regulating focal adhesion turnover (28). Autophosphorylation of FAK on tyrosine 397 causes activation, and subsequent binding of activated Src and tyrosine phosphorylation at amino acids 576 and 577 results in maximal FAK activation (29, 30). This activation is required for the disassembly of mature focal adhesions (31) and, furthermore, disruption of FAK expression or activation is correlated with increased size and number of focal adhesions (28). Therefore, the phenotype of progestin-treated cells suggested that FAK activity may be increased, and expression and activation of FAK were examined in wild-type and PRA overexpressing T-47DN5 cells after 48 and 72 h progestin treatment (Fig. 7). Progestins caused an increase in the active, autophosphorylated form of FAK (FAK-pY397) at 72 h in cells with low PRA:PRB ratio (Fig. 7A). The increase in autophosphorylated FAK was less marked in cells with high PRA:PRB ratio (Fig. 7A; ORG+IPTG). No change in the expression of total FAK protein was seen. FAK activation through phosphorylation of the Src kinase-dependent pY576/577 sites of FAK was seen in cells with low PRA:PRB ratio and again, this was attenuated in cells with high PRA:PRB ratio (Fig. 7B). This shows that progestins augment focal adhesion signaling, consistent with the remodeling of focal contacts, but that cells with high PRA:PRB ratio are likely to have reduced signaling by comparison with cells with low PRA:PRB ratio.
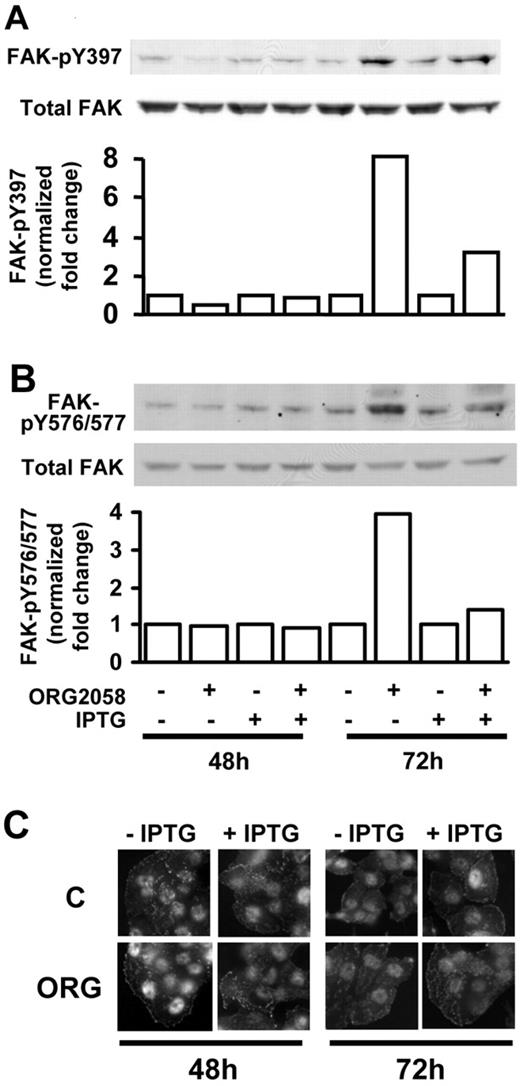
Progestin Regulation of FAK Activity T-47DN5 cells were treated for 24 h with 10 mm isopropyl-β-d-thiogalactopyranoside (IPTG) or vehicle, to induce PRA, and then for 48 or 72 h with ORG2058 or vehicle, as indicated. Whole-cell lysates were fractionated on a 7.5% acrylamide denaturing gel, and total and activated (pY397 and pY576/577) FAK were detected by immunoblotting. Relative expression of total and phosphorylated FAK bands was estimated by densitometry, and activated FAK levels are graphed relative to controls, normalized to total FAK. A, Activation of FAK on autophosphorylation site pY397. B, Levels of Src-dependent activation on pY576/577. C, Cells grown on coverslips, and treated as described above, were fixed and stained for FAK-pY397. C, Control; ORG, ORG2058
Interestingly, no FAK activation was detectable, by immunoblot, after 48 h progestin exposure, suggesting that remodeling of focal adhesions is detectable before measurable levels of activated FAK are seen. Staining cells for FAK-pY397 confirmed this. Brightly staining foci containing activated FAK were seen in both 48-h and 72-h progestin-treated cells and in untreated cells (Fig. 7C). This was unaffected by the level of PRA. At 72 h progestin treatment, activated FAK foci appeared more abundant than in time-matched controls (Fig. 7C). Costaining for paxillin revealed that, where present, paxillin-positive foci were colocalized with activated FAK (not shown). Activated FAK immunoreactivity was also detected in the nuclei of all cells as previously described (32, 33), and this was unaffected by progestin treatment or PRA level. The decrease in paxillin staining and detection of activated FAK at focal adhesion sites confirmed that focal adhesion turnover was increased by progestins both in wild-type and in PRA-overexpressing cells. However, the diminished level of FAK activation, detected on immunoblots when PRA was overexpressed, suggests that FAK signaling is dampened in these cells, potentially leading to the further reduction in cell adhesion observed in cells with high PRA:PRB ratio.
Discussion
This study has examined PR-mediated gene expression in cells with physiologically relevant expression of PRA and PRB. Progestin-regulated gene expression was characterized in cells with similar levels of PRA and PRB and in the same cells after PRA was induced to become the predominant species, thereby modeling the relative levels of PRA and PRB observed in normal human breast and in breast cancers (15, 16). This report is the first to determine global progestin-mediated transcriptional changes due to the disruption of relative PRA and PRB expression in individual inducible clonal breast cancer cell lines, containing both receptor isoforms. Previous studies on PR-mediated gene expression have used distinct cell lines, expressing just one PR isoform, PRA or PRB, alone (10, 34). The relevance of this model to understanding PR action in breast cancer is highlighted by the fact that, although relative PRA and PRB expression is commonly disrupted to result in PRA predominance (15), both receptor isoforms are generally detected in most breast cancers and transcriptional (3, 4) and clinical studies (Ref.18 and Mote, P. A., A. Gompel, A. Lavaur, Y. Decroix, D. Hugol, and C. L. Clarke, submitted) suggest that PRA:PRB ratio is likely to be as important a determinant of progestin response as total PR level.
After short exposure to progestin, transcriptional profiles were largely unaffected by marked alterations in relative expression of PRA and PRB. However, after longer exposure to the hormone, a different repertoire of genes was regulated, and PRA predominance conferred progestin responsiveness to a distinct subset of transcriptional targets. It should be noted that, although alterations in PRA:PRB ratio did not markedly change progestin response at early times, this did not reflect an overall lack of regulation of early targets. Progesterone is a critical regulator of a diverse range of cellular functions, and this was reflected in a significant transcriptional response on a large spectrum of gene targets at 6 h. Genes involved in transcriptional regulation and cytoplasmic signaling pathways dominated the progestin targets at 6 h, consistent with published evidence that the PR proteins mediate early effects on downstream pathways. KLF4, SOX4, vitamin D receptor, and Wilms’ tumor suppressor 1 (WT1), are all known targets of progesterone and were regulated at 6 h in this study. WT1, which is up-regulated by progesterone in endometrial cells (35, 36), was down-regulated in T-47D cells. This is consistent with the finding that WT1 controls progestin-mediated lobular development in the normal mammary gland and is often down-regulated in breast cancers (37, 38). Cross-talk between PR-mediated progestin regulation and growth factor- and cytokine-signaling pathways has been demonstrated in breast cancer cells both by up-regulation of growth factor receptor levels (39–42) and by direct interactions with cytoplasmic signaling molecules (43, 44). Furthermore, progestins markedly potentiate epidermal growth factor signaling in this context (42). The effect of progestin on signaling pathways in cells equivalently expressing both PRA and PRB is largely unexplored. Most of these pathways have been elucidated by transfection only of PRB and, where examined, PRB but not PRA interacted with cytoplasmic signaling pathways, suggesting that this form of progestin regulation may be affected by changes in PRA:PRB ratio. However, altering relative PRA and PRB expression had little impact on progestin-regulated gene expression at 6 h, suggesting that although these signaling intermediates may ultimately control PR isoform-specific processes, their own transcriptional regulation, and regulation of early progestin targets in general, is unaffected by shifts in PRA:PRB ratio. Although 50 of 133 genes that were regulated by progestins at 6 h were involved in transcriptional regulation, the progestin regulation of just one of these (P2RY6) was affected by overexpression of PRA. Up-regulation of P2RY6 was enhanced by increasing PRA:PRB.
The stark differences between PRA and PRB activity on target reporters and the dominant inhibitory activity of PRA, demonstrated in transfection studies (3, 4, 27, 45), suggested that striking differences may be seen by altering relative expression of the two receptors in the same cell. Therefore it was surprising to find that the profiles of progestin regulation at 6 h in the three inducible cell line clones were remarkably indistinct. The frequency distribution of progestin effect on gene expression was almost identical in cells with PRA predominance compared with cells expressing close to equivalent PRA and PRB, demonstrating that PRA did not act as a dominant inhibitor of PR activity. Furthermore, the profile of progestin regulation in the clonally independent T-47DE3 cells expressing close to equivalent PRA and PRB compared with that of T-47DN5 cells induced to express PRA at a 5-fold excess over PRB was also highly concordant. These observations contrast with observations made using transient transfections. When the two isoforms are transfected separately, PRB is a stronger transcriptional activator than PRA on most transfected progestin response element-containing reporters. Furthermore, on complex progestin response element-containing reporters PRA is a particularly weak transactivator compared with PRB (27, 46) and is a dominant inhibitor of PRB when the two isoforms are cotransfected (3, 4). This study demonstrates that in cells with endogenous levels of PRA and PRB that are consistent with those seen physiologically, the transcriptional response to PRA predominance is different to that in cells where PRA is transiently expressed, probably because of the higher levels of expressed proteins obtained after transient, as opposed to stable, transfection of an inducible transgene. The fact that T-47D cells endogenously express PR and therefore contain intact progestin response pathways is also important, as cells which are normally PR negative, as are commonly used for transient transfections, are unlikely to be as competent as normally responsive target cells to mount full responses to progestins.
When response to progestin at 6 h was compared between the three cell lines (uninduced and induced), using cluster analysis, transcriptional regulation was less related to PRA:PRB ratio than with the level of PR. The relationship between PR level and response to progestin in vivo is not known; however, when the findings of this study are compared with the in vivo situation, it needs to be noted that T-47D cells have relatively high PR expression. It is possible that the relationship between PR levels and progestin-mediated gene expression may be different in cells with lower endogenous levels of PR. However, the result of cluster analysis suggested that the experimental paradigm was sensitive enough to detect changes in transcriptional response that were related to PR level. Moreover, this study design was clearly suitable to examine whether PRA predominance resulted in inhibition of progestin-mediated gene expression, which it did not.
Prolonged exposure to progestin resulted in a 6-fold increase in the number of progestin-regulated genes when compared with short exposure. This study has also revealed a shift in the functional groups responsive to progestin between 6 h and 48 h. Whereas genes regulating transcription and cell cycle progression dominated the list of regulated genes at 6 h, at 48 h there were relatively more genes involved in cell metabolism and maintenance of cell shape and adhesion. The shift in functional groups responsive to progestin suggests that cellular response to progestin is remodeled over time. This is also supported by the lack of overlap between genes regulated at 6 h and 48 h, showing that the early response to progestin was transient and followed by the response of different populations of genes at later times. Progestin-responsive genes could be directly or indirectly regulated at the transcriptional level, although published evidence to date suggests that a large proportion of progestin-regulated genes are indirect targets (1). The relatively low number of regulated genes at 6 h, and the acquisition of progestin responsiveness at 48 h of large numbers of genes, supports the view that many of these genes, although transcriptionally regulated by progestins, are likely to be indirect targets.
Predominance of PRA did not dramatically alter the pattern of progestin-regulated gene expression at 48 h, in line with the findings at 6 h. At 48 h, 73% of all progestin-regulated genes at 48 h were not differently regulated between low and high PRA:PRB ratio. The demonstration that both at 6 h and 48 h progestin-regulated genes are largely unaffected by changes in PRA:PRB ratio is in line with the fact that most tissues normally express both PR isoforms in the same cell, and there is evidence that the PRA:PRB heterodimer is essential for normal physiology (14, 15, 19). Our data suggest that the majority of progestin targets are optimally regulated by the PRA:PRB heterodimer. Richer et al. (10) reported largely nonoverlapping gene regulation profiles when exclusively PRA or PRB is expressed in PR-negative T-47D cells. Interestingly, of 66 genes reported to be progestin regulated by one PR isoform in that study and also detected on our arrays, we found that only 23 (23/66; 35%) were progestin regulated when both PRA and PRB were expressed. In a related study, Jacobsen et al. (34) reported specific isoform differences when PRA and PRB were separately inducibly expressed in PR-negative parent cells. Although mostly examining ligand-independent effects, that study did find that ligand regulation largely confirmed the findings of Richer et al. Furthermore, of the 79 reported progestin-regulated genes in that study, only 18 of 45 genes (40%) that were detected on our arrays were also regulated in cells containing both PRA and PRB. This supports the possibility that PRA:PRB heterodimers, present in the cells in this study, have different transcriptional activities than the homodimers, which are likely to be the predominant species in cells expressing only one PR protein. Although the proportion of PRA and PRB in heterodimers or homodimers was not quantitated in this study, there is in vitro evidence (47, 48) to infer that in cells with a PRA:PRB close to 1:1, half the total PR dimer pool is predicted to form heterodimers. Moreover, most PRB in cells with a 5-fold excess of PRA would be engaged in heterodimers, and a substantial number of PRA homodimers would also exist. Clearly, it must be acknowledged that this study and previous studies on cells expressing only one PR isoform have been carried out in distinct clonal populations of T-47D cells, with many potentially different biological characteristics. Therefore, further studies, preferably in a single-model system, will be required to fully dissect PRA and PRB hetero- and homodimer differences.
Induction of PRA, however, did affect the gene expression of a small proportion of genes, which had dramatically altered regulation when PRA was predominant. Most of these genes acquired responsiveness to progestins when the PRA:PRB ratio was high, as they were not progestin regulated in cells with low PRA:PRB ratio, and most were involved in cellular metabolism and regulation of cell shape and adhesion. This suggests that one consequence of PRA predominance, particularly on prolonged exposure to progestin, was the acquisition of progestin responsiveness by genes involved in regulation of cellular metabolism, cell shape, and adhesion, which are normally not progestin targets.
It is intriguing to speculate that early progestin signaling may itself ultimately invoke the functional differences seen at 48 h between cells expressing equivalent levels of PRA and PRB and those with PRA predominance. One gene target that was markedly up-regulated by progestins at 6 and 48 h in all cells and under all conditions was the transcription factor KLF4. This factor was also regulated by both PRA and PRB when the isoforms were expressed separately (10). The KLFs are a large family of transcriptional regulators, including transcription factor Sp1, which regulate the activities of multiple target promoters and can be both growth stimulatory and inhibitory (49). KLF4 is expressed predominantly in epithelial cells and intestinal villus and is an essential regulator of p53-mediated cell cycle arrest after DNA damage (50). It is elevated in a proportion of breast cancers (51), and nuclear localization is associated with a more aggressive phenotype (52). Its role in progestin action has not been described; however, other Kruppel-like factors, including KLF9 and KLF13/KLF2, have been shown to selectively potentiate PRB transcriptional activity while at the same time increasing the inhibitory activity of PRA (53). Therefore, progestins could up-regulate KLF family members to affect tissue- and promoter-specific transcriptional differences between PRA and PRB. KLF9 was shown to exert its effects through interactions with both PRA and PRB. This is consistent with other data suggesting that PRA and PRB have different affinities for specific transcriptional coregulators and, therefore, that the relative abundance of these factors can modulate their different activities (54–56).
In line with the shift at 48 h to progestin responsiveness of genes involved in aspects of cell shape and adhesion, progestin treatment resulted in reduced cell adhesion, which was significantly decreased even further when PRA was predominant. Our previous observations, that PRA predominance promotes marked cell rounding, are in line with this (22). This effect was not seen until 48–72 h after progestin treatment, in agreement with this study. A number of the genes that acquired responsiveness to progestin at 48 h in cells with PRA predominance were specifically involved with cell adhesion. The transmembrane proteoglycan syndecan-1 is involved in cell spreading and positively regulates the formation of cell-cell adhesions. It forms cell-matrix interactions with a range of extracellular substrates and transmits signals to the actin cytoskeleton (57). Syndecan-1 was decreased 2.23-fold by progestins at 48 h when PRA was overexpressed but was not regulated in cells expressing equivalent PRA and PRB (Fig. 7). The secreted calcium-binding protein S100A8 is abundantly produced by neutrophils (58) and acts as a chemotactic agent and positive regulator of adhesion (59). It is also overexpressed by skin cancers and down-regulated by glucocorticoids (60). S100A8 was strongly up-regulated in wild-type cells by 48-h progestins, and this was markedly dampened by overexpression of PRA.
There was no difference in adhesion properties of untreated cells in which PRA:PRB ratio was increased, compared with untreated wild-type cells. This finding contrasts with the study of Jacobsen et al. (34), which focuses on the differential effects of unliganded PRA and PRB. In that study, PRA and PRB regulated distinct sets of targets when the receptors were individually expressed, and a number of transcripts were identified that responded to the induction of PRA or PRB expression in a PR-negative T-47D cell clone, without the requirement for ligand. Moreover, induction of PRA expression caused cells to become more adhesive and to migrate more readily, in the absence of ligand, whereas induction of PRB expression had no effect on either parameter (34). It is difficult to compare the data to the effects seen here, because the effect of hormone on adhesion and migration was not examined in that study (34). However, given the lack of effect we observed on untreated cells in which PRA was predominant but PRB was also present, it is possible that PRB expression was still sufficient to oppose any unliganded effect on cell adhesion. Again, given the clonal differences between these cell lines and the other differences between this and the previous study, the data must be compared with caution.
The complete disruption of actin microfilaments and the cytoplasmic pooling of actin and ezrin in cells with high PRA:PRB ratio are likely to have been due to specific gene regulation. The solute carrier SLC9A3R1 has been characterized as ezrin-radixin-moesin-binding phosphoprotein 50, which is responsible for anchoring ezrin to the cell membrane (61, 62). This transcript was unregulated by progestins when PRA and PRB were equivalently expressed. However, in cells with high PRA:PRB ratios, ezrin-radixin-moesin-binding phosphoprotein 50 expression was decreased by progestins. Through interactions with the actin filament system and association with the membrane-signaling molecule CD44, ezrin regulates cell morphology, adhesion, and migration (63).
The pooling of ezrin and polymerized actin in cells with high PRA:PRB ratio highlighted the increased dynamic nature of actin microfilaments, particularly the cortical actin component. Two of the genes that acquired progestin responsiveness at 48 h in cells with high PRA:PRB ratio were vinculin and profilin2. Vinculin localizes to the cytoplasmic face of cell-cell and cell-matrix adhesions and is involved in anchoring actin microfilaments to the cell membrane. It acts in concert with the actin monomer-binding protein profilin 2 to regulate actin filament dynamics. Increased expression of profilin and vinculin is consistent with a loss of cell-cell and cell-matrix adhesions (64). Both profilin and vinculin were up-regulated by progestins at 48 h only in cells that expressed a predominance of PRA. Interestingly, overexpression of PRA and PRB in receptor-negative cells, and treatment with progestin, results in a marked increase in actin stress fibers and associated paxillin-positive focal adhesions (Ref.65 and our unpublished observations). This suggests that ectopic expression of PR in a nontarget cell line is not sufficient to reconstitute the cytoskeletal response observed in an authentic progestin target cell.
Consistent with the loss of ventral focal adhesions, the level of activated FAK was increased by progestin treatment both with low and high PRA:PRB ratio, but this was more marked when PRA:PRB was low. Furthermore, phosphorylation of Src-dependent sites on FAK was barely detectable in PRA-overexpressing cells, suggesting that FAK activation is substantially lower when PRA is predominant and the greatest cell rounding (22) is observed. Interestingly, however, FAK activation was not detectable until at least 24 h later than the loss of paxillin-positive focal adhesions was noted. FAK is required for the disassembly of mature focal adhesions (31) and is essential for normal focal adhesion turnover during cell spreading and migration (28). FAK is particularly sensitive to changes in the extracellular environment that bring about altered integrin and growth factor signaling (29). Therefore, it may be the case that focal adhesion disassembly occurs rapidly upon activation of FAK, and before sufficient accumulation of phospho-FAK to be detected by immunoblotting. Indeed this appears to be the case, because activated FAK was found to be present in focal complexes before detection on immunoblots (Fig. 7C). Focal adhesions may also be dissolved by disrupting the actin microfilament scaffolding that they are anchoring on the inner face of the cell membrane. Therefore, it may be the case, in our cells, that progestin-mediated disruption of actin microfilaments, and associated ezrin and ezrin-binding proteins at the cell membrane, causes dissolution of focal adhesion. This disruption brings about altered focal adhesion dynamics and increased FAK activity in an attempt to restore cell adhesion. PRA-overexpressing cells are no longer able to effectively activate pathways to restore adhesion signaling and, as a result, become much more rounded and more poorly adherent than wild-type cells.
In conclusion, this study has shown that progestin-regulated transcriptional targets are largely insensitive to changes in PRA:PRB ratio that mimic the ratios found in cancer, but importantly that PRA predominance resulted in the acquisition of progestin responsiveness of a small but important subgroup of specific gene targets, in signaling pathways that influence cell shape and adhesion. These findings have important implications for breast cancer biology because they suggest that progestin effects on cell shape and adhesion are dependent on the PRA:PRB balance. Given that PR expression is disrupted early in malignant progression, this disruption may contribute to tumor characteristics, particularly in premenopausal women exposed to cyclical progesterone. Our data suggest that PRA and PRB are remarkably complementary in their functional activities on most targets within the same cell, but that an imbalance of PRA and PRB levels results in remodeled progestin responsiveness, which may have important implications for breast cancer biology.
Materials and Methods
Cell Culture
The T-47DhPRA cell lines containing the p3′SS vector, encoding the lac repressor and inducible pOP13-hPRA plasmid, have been described previously (22). Three independent clones, in which different basal and induced levels of PRB and PRA were observed, were used in the work described here. They were designated T-47DhPRA B8, T-47DhPRA E3, and T-47DhPRA N5, and will be referred to here by their abbreviated names: T-47DB8, T-47DE3, and T-47DN5, respectively. Cells were grown in phenol red-free RPMI 1640 medium, supplemented with 10% fetal calf serum (FCS) (JRH Biosciences, Melbourne, Australia), insulin (0.25 U/ml), Hygromycin B (200 μg/ml) and G418 (200 μg/ml) (Invitrogen, Melbourne, Australia). Cells were maintained in exponential growth through regular passaging. For microarray experiments cells were seeded into 150 cm2 flasks at 1 to 3 × 10⁶ (E3 and N5) or 5 × 10⁶ (B8) cells per flask in RPMI 1640 supplemented as described above, except that 5% FCS was used. The cells were treated 3 d later with either 10 mm isopropyl-β-d-thiogalactopyranoside (to induce overexpression of PRA) or vehicle (PBS) and allowed to grow for 24 h before treatment with the synthetic progestin ORG2058 (10 nm, Amersham Biosciences, Castle Hill, Australia) or vehicle (ethanol). After the indicated times, the cells were harvested by trypsinization, and the suspension was aliquoted for extraction of total RNA and protein. For adhesion experiments, an aliquot of each cell suspension was taken to estimate cell number and cells were replated in triplicate at known cell densities, in their conditioned medium, and allowed to replate for 30 or 120 min. The monolayer was then washed with PBS, adherent cells were harvested by trypsinization, and total cell number was estimated by counting. In the above experiments, cells were deliberately not changed into medium containing FCS that had been charcoal treated because the endogenous levels of progestogenic compounds in FCS are known to be too low to have a detectable effect on cell growth or gene expression (66), whereas we have observed global changes arising from such a culture medium change that would mask or alter more sensitive measurements of progestin effects (data not shown).
Isolation of Total RNA
Total RNA was isolated by lysis of cell pellets in a guanidinium isothiocyanate solution and centrifugation through a cesium chloride cushion. The method used has been described elsewhere (67). RNA yields were estimated by UV spectrophotometry, and integrity was confirmed by resolution on denaturing agarose gel electrophoresis.
cDNA Microarrays
Probes were prepared by indirect incorporation of cyanine dyes (Cy3 and Cy5) into 70 μg total RNA. The protocol is described in http://brownlab.stanford.edu/protocols.html. Briefly, total RNA was reverse transcribed for 90 min at 42 C using Superscript II reverse transcriptase (Invitrogen) in the presence of 2-aminoallyl-dUTP, and subsequently coupled to Cy3 or Cy5 monoester dyes. After quenching and purification, matched control and ORG2058-treated, Cy3- and Cy5-labeled samples were mixed and competitively hybridized overnight to glass cDNA arrays. Hybridization was carried out at 42 C in buffer containing yeast tRNA (1 mg/ml), Cot1 DNA (0.08 mg/ml), polyadenylic acid (0.5 mg/ml), 2.8× Denhardt’s reagent, 3.125× standard sodium citrate (SSC), 50% formamide, salmon testes DNA (1 mg/ml), 0.125% sodium dodecyl sulfate. The cDNA arrays were obtained from the Ramaciotti Centre for Gene Function Analysis and contained 6000 cDNAs, representing 5704 target sequences (ResGen-Invitrogen, Melbourne, Australia) plus positive and negative controls. Arrays were washed once with 1× SSC, 0.2% sodium dodecyl sulfate (SDS), 5 min at room temperature, followed by washing 5 min in 0.1× SSC, 0.2% SDS, warmed to 30 C, and two final washes in 0.1× SSC, 2 min at room temperature. The arrays were dried and scanned using a GenePix 4000B scanner and GenePixPro 3.0.5.56 software (Molecular Devices Corp., Sunnyvale, CA).
Statistical Analysis
Red-green fluorescent intensities for each spot were estimated using GenPixPro. Array data were analyzed using the Bioconductor workspace environment (www.bioconductor.org). Spot intensities, ranging from 0–65,000 median pixel intensity units, were stringently filtered such that values less than 300 units above background were set to 300 to effectively remove false-positive and negative fold changes from the data set. A full list of the filtered raw data is given in supplemental Table 2, published as supplemental data on The Endocrine Society’s Journals Online web site at http://mend.endojournals.org. The data were subsequently normalized using the maNorm package of Bioconductor, using the intensity-dependent, within print-tip lowess regression function. Filtered, normalized data for individual arrays were then scale normalized across arrays. Hierarchical cluster analysis of normalized log fold regulation was performed using Gene Cluster 3.0, and results were visualized in Tree View 1.60 (M. Eisen; http://rana.lbl.gov/EisenSoftware.htm). Complete linkage clustering was performed on genes and arrays, using a Euclidean distance similarity metric.
Normalized and scaled data were imported into the SPSS statistical software package (SPSS, Inc., Chicago, IL) for subsequent analysis. Determinations for each biological condition represent replicate determinations from two independent microarray experiments. Actual and relative frequency distributions were generated by calculating the number and percentage, respectively, of genes the fold regulation of which fell within a regular set of defined intervals. Relative difference plots represent the difference in relative frequency between two conditions at each defined interval. A Kolmogorov-Smirnov test for normal distribution was used to determine whether a statistically significant difference in relative distributions was observed. Genes detected with a fold expression level of 2 or higher, in progestin-treated samples compared with controls, were considered to be regulated. A gene was considered to be unambiguously nonregulated only if it had a fold regulation value that fell within the average sem from one, i.e. 1 ± 0.22. Log2 fold change values for genes significantly regulated at 6 h progestin treatment were compared with PR protein concentration and PRA:PRB ratio, in the three T-47D cell lines, using a linear mixed-effects model.
To identify genes that were differentially regulated between two different conditions, the data were compared by linear regression analysis of the two normalized data sets. Data points that fell outside the 95% confidence intervals, and therefore were greater than 2 sd outside the mean, and that represented genes that were greater than 2-fold regulated by progestin treatment in one of the two conditions compared, were considered to be differentially regulated by progestins if they also had nonoverlapping se values in replicate determinations. A gene that was regulated 2-fold or more in one condition, and at least 1.5-fold in the other, was considered not differentially regulated.
Quantitation of Transcript Levels by RT-PCR
Gene regulation identified on microarrays was confirmed by a combination of semiquantitative conventional RT-PCR analysis and real-time quantitative RT-PCR. Targets were amplified from cDNA master stocks, prepared from equal amounts of total RNA, using Superscript III reverse transcriptase, following the manufacturer’s protocol (Invitrogen). Real-time PCR quantitations were performed using an ABI Prism 7700 Sequence Detection System and ABI SYBR green master mix (Applied Biosystems, Scoresby, Australia). Semiquantitative estimates were made by amplifying targets over a range of cycle times and quantitating the products generated during exponential amplification by densitometry of bands on agarose gel. All quantitations were normalized to the β2-microglobulin gene, which is not regulated by progestins. Amplicon sizes for all validation targets were between 150 and 200 bp. Primer sequences used were as follows. ARP3forward (fwd): CTG GAA TCA ATG CTA TCT CAA AGA; ARP3reverse (rev): CGT CTG ACA TCA ATA GGA CAA TTC; B2mfwd: ATG AGT ATG CCT GCC GTG TG; B2mrev: GCA AGC AAG CAG AAT TTG GA; CITED2fwd: CCA ACT TCT TCG GCG TGA AT; CITED2rev: GGG TGA ATG TCA AGG CTA CAA A; Connexin26fwd: TGA ATA CTT TGC AGC ACA GCT G; Connexin26rev: TTT GAC ATG AGG CCA TTT GC; Keratin18fwd: TCT GCA GAT TGA CAA TGC CC; Keratin18rev: GTC TCC AGC TGC AGT CGT GT; LMO2fwd: CCG TCT CCA TGG CAT CTT CG; LMO2rev: GCT GGT CCT TCT GTC ACC TTG A; NDRG1fwd: AGG AAG CAA GCA TCT CCG CA; NDRG1rev: TGA ACC AGG ATG CTC AGG GC; NPYY1Rfwd: ATA GCC TAT GGT CCC GGA TG; NPYY1Rrev: CCC ACA CCT TTT GTT CCA AA; Pim2fwd: TCC CGA CCC TCA CTG GAA GA; Pim2rev: GGC TCT TCT GAC CAT TGG GG; Protocadherinfwd: TGT CTA CAT CCC AGG CAG CA; Protocadherinrev: AAG GAG AAG CTG GGC TGG TT; PSB1G9fwd: ATA CGG AAC CCA GTG AGT GC; PSB1G9rev: CGT TTA GCC ACC AAA TGT AGG; RhoEfwd: TGC AAG ATT TGT AGA CCA GCA C; RhoErev: CAC AAC TTC TAA ACA GCG CAC A; RhoGAPfwd: CTC CAC TGT CCT GTA AGC TGT GC; RhoGAPrev: CCC AGA TCT CCA CTC TCA GTT TT; RPS6kfwd: CCA ACG GTC CCA GTG ACA CA; RPS6krev: TTA GCT GTG AGG CGC TGG TG; S100A8fwd: GAC CGA GCT GGA GAA AGC CT; S100A8rev: CCA ACT CTT TGA ACC AGA CGT C; S100Pfwd: GGT GCT GAT GGA GAA GGA GC; S100Prev: ACA GGC AGA CGT GAT TGC AG; Vinculinfwd: CAG AGT TGC TGG GAG CTG AA; Vinculinrev: AGA GGG TGC ACA AGT GTA ACT GT; WT1fwd: TGT GCC TGG AAG AGT TGG TC; and WT1rev: GAC ATG ATC AGC TAT GGC TCT TC.
Immunofluorescent Staining
Cells were grown on glass coverslips in six-well plates and treated as described. The medium was removed from the wells and the cells were washed with PBS and fixed using 3.7% formaldehyde in PBS for 30 min at 4 C, followed by permeabilization in 0.2% Triton X-100 in washing buffer (0.5% BSA in PBS), and all subsequent steps and washes were carried out at room temperature, using washing buffer. In the case of paxillin staining, the cells were also preextracted in 0.02% Triton X-100, 100 mm piperazine-1,4-bis[2-ethanesulfonic acid], 25 mm HEPES, pH 6.9, 1 mm EGTA, 2 mm Mg2SO4 before fixation. The cells were rinsed three times, and then incubated with primary antibody [mouse antipaxillin (BD Biosciences, San Jose, CA), rabbit antiezrin IgG (Upstate Biotechnology, Inc., Lake Placid, NY), rabbit antiphosphotyrosine 397 FAK (FAK-pY397; Biosource International, Camarillo, CA)] for 1 h, followed by three 10-min washes. The cells were incubated 1 h with secondary antibody (biotinylated goat antimouse for paxillin, alexa-488 antirabbit for ezrin, fluorescein isothiocyanate-conjugated antirabbit for FAK-pY397). When staining for paxillin the cells were subsequently washed three times and incubated for 1 h with Texas red-conjugated avidin. After washing three times, for 10 min each, filamentous actin was visualized in the cells by 15-min incubation with fluorescently labeled phalloidin (fluorescein isothiocyanate-phalloidin with paxillin-stained cells and tetramethylrhodamine isothiocyanate-phalloidin with ezrin-stained cells) and then washed an additional three times and mounted on slides using Vectashield fluorescent mountant. Fluorescent images of the dual stained cells were taken separately and simultaneously, using the appropriate filters, fitted to an Olympus BX60 fluorescent microscope and SPOT CCD camera (SciTech, Victoria, Australia). Digital images were taken of several fields for each treatment condition, and representative images are shown.
Protein Extract Preparation and Immunoblotting
Total protein extracts were prepared by washing cells with PBS, followed by lysis at 107 cells/ml in RIPA buffer [10 mm NaPO4 (pH 7.0), 150 mm NaCl, 2 mm EDTA (pH 8), 1% Na-deoxycholate, 1% Nonidet P-40, 0.1% SDS] containing 0.1% β-mercaptoethanol, 10 mm NaMoO4,and protease inhibitors (0.5 mm phenylmethylsulfonylfluoride, 1% aprotinin) by rotation at 4 C, 15 min. When measuring phosphorylated proteins, phosphatase inhibitors were also included (50 mm NaF and 200 μm Na3VO4). Cell lysates were centrifuged at 15,000 × g for 30 min at 4 C to remove insoluble debris. Protein concentration in the extracts was estimated using Bradford dye reagent (Bio-Rad, Regents Park, Australia). Equal protein amounts were loaded onto 7.5% polyacrylamide-SDS gel, and PR proteins were fractionated, transferred to nitrocellulose, and visualized by immunoblotting as described previously (16). PR protein expression levels were quantitated from immunoblots by densitometry. PRA and PRB were detected as singlet and triplet proteins of molecular mass 85 kDa and 116 kDa, respectively, as previously described (68). The previously demonstrated (69, 70) phosphorylation-mediated increase in molecular mass of both proteins and the reduction in overall PR protein level, upon exposure to progestin, were noted. Commercially available antibodies to total FAK (Santa Cruz Biotechnology, Inc., Santa Cruz, CA), FAK-pY397 (Biosource, Camarillo, CA), and phosphotyrosine 576/577-FAK (FAK-pY576/577, Cell Signaling Technology, Beverly, MA), were used to detect the relevant proteins, as recommended by the suppliers.
Acknowledgments
We thank Chris Bye for help with microarray data acquisition and analysis.
This work was supported by grants from the National Health and Medical Research Council of Australia (960877, 211002, and 9777326), the University of Sydney Cancer Research Fund, and the Cure Cancer Australia Foundation. G.O. was supported by a Career Development Award from the Cancer Council New South Wales.
Abbreviations:
- FAK,
Focal adhesion kinase;
- FCS,
fetal calf serum;
- KLF,
Kruppel-like factor;
- PRA,
progesterone receptor A;
- PRB,
progesterone receptor B;
- SDS,
sodium dodecyl sulfate;
- SSC,
sodium chloride, sodium citrate, citric acid;
- WT1,
Wilms’ tumor suppressor 1.
