


Abstract
The Gene Expression Omnibus (GEO, http://www.ncbi.nlm.nih.gov/geo/) is an international public repository for high-throughput microarray and next-generation sequence functional genomic data sets submitted by the research community. The resource supports archiving of raw data, processed data and metadata which are indexed, cross-linked and searchable. All data are freely available for download in a variety of formats. GEO also provides several web-based tools and strategies to assist users to query, analyse and visualize data. This article reports current status and recent database developments, including the release of GEO2R, an R-based web application that helps users analyse GEO data.
INTRODUCTION
The Gene Expression Omnibus (GEO) repository (1) archives and freely distributes microarray, next-generation sequencing (NGS) and other forms of high-throughput functional genomic data. The database is built and maintained by the National Center for Biotechnology Information (NCBI), a division of the National Library of Medicine, located on the campus of the National Institutes of Health in Bethesda, MD, USA. Data in GEO represent original research deposited by the scientific community, often in compliance with grant or journal directives (2) that require data to be made publicly available in a MIAME-supportive (3) database. As a result, GEO now has supporting data and links to almost 20 000 published manuscripts. Together with ArrayExpress (4), data for >1 million samples are currently available in the public domain.
In addition to serving as a public archive, GEO provides tools to help users identify, analyse and visualize data relevant to their specific interests. These tools include a powerful search engine that supports complex fielded queries, sample comparison applications and gene expression profile charts. The GEO database continues to grow and is being actively developed towards facilitating data mining and discovery; this article provides an update of the current status and recent improvements.
GEO CONTENT
At the time of writing, the GEO database hosts >32 000 public series (study records) submitted directly by 13 000 laboratories, comprising 800 000 samples derived from >1600 organisms. As depicted in Figure 1, the overall submission rate continues to grow; in 2011 alone, >6800 new series were processed, a 22% increase over the previous year. The data types archived in GEO mirror evolving trends in technology and methodologies used by the functional genomics community. ‘Expression profiling by array’ continues to be the most common study type submitted to GEO by an order of magnitude, although its growth rate is slowing. Next-generation sequence submission rates have been rapidly increasing since 2008; interestingly, methods like chromatin immunoprecipitation by sequencing (ChIP-seq; included under ‘genome binding/occupancy profiling by NGS’ in Figure 1) are increasing at such a rate that they are now submitted at a higher frequency than their array-based counterpart ChIP–chip. Meanwhile, traditional SAGE (Serial Analysis of Gene Expression) submissions are now infrequent.
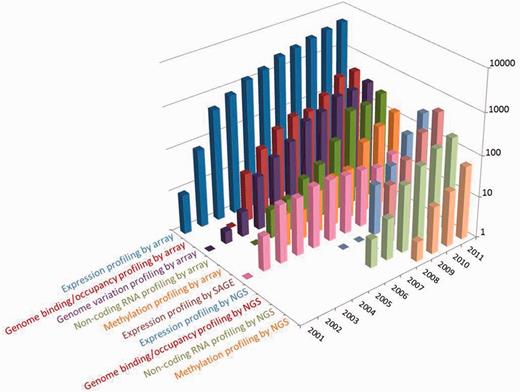
Distribution of the number and types of selected studies released by GEO each year since inception. Users can explore and download historical submission numbers using the ‘history’ page at http://www.ncbi.nlm.nih.gov/geo/summary/?type=history, as well as constructing GEO DataSet database queries for specific data types and date ranges using the ‘DataSet type’ and ‘publication date’ fields as described at http://www.ncbi.nlm.nih.gov/geo/info/qqtutorial.html.
Almost all submissions are deposited by individual laboratories or by microarray facilities on behalf of their clients. Some data are imported from ArrayExpress; efforts to expand this import are in progress. Data for large collaborative projects, including Encyclopedia of DNA Elements (ENCODE) (5) and Roadmap Epigenomics (6), are deposited by Data Coordinating Centres and have dedicated data listings pages at http://www.ncbi.nlm.nih.gov/geo/info/ENCODE.html and http://www.ncbi.nlm.nih.gov/geo/roadmap/epigenomics/.
Support for next-generation sequence data
GEO has made it a priority to continue to support the microarray community as they switch to next-generation sequence technologies. Established microarray submission formats, metadata standards and administrative procedures have been modified to accommodate the new technologies. The full sequence submission guideline is provided at http://www.ncbi.nlm.nih.gov/geo/info/seq.html and supports ‘minimum information about a high-throughput sequencing experiment’ (MINSEQE) standards (http://www.fged.org/projects/minseqe/). GEO accepts sequence data for studies that examine gene expression (RNA-Seq), gene regulation and epigenomics (e.g. ChIP-Seq, methyl-Seq, DNase hypersensitivity) or other studies where measuring some form of sequence abundance or characterization is part of the study goals. GEO hosts the processed data files together with sample and study metadata; raw data files containing the original sequence reads are brokered and linked with NCBI’s Sequence Read Archive (SRA) database (7). To date, GEO has loaded >44 terabases of read data to SRA. Furthermore, several thousand processed data files have been incorporated into NCBI’s Epigenomics (8) database, where they are further curated and available to view as tracks on genome browsers; work to incorporate several thousand more tracks with reciprocal links to GEO is ongoing.
RECENT UPDATES TO SEARCH, NAVIGATE, DOWNLOAD AND ANALYSE
Much of the infrastructure, organization and search capabilities of GEO remain as previously described (9), but several recent enhancements offer the user alternative methods for locating, downloading and interpreting data, including:
Sample records are indexed as a distinct entry type in the GEO DataSets database (http://www.ncbi.nlm.nih.gov/gds/), permitting users to more easily identify individual samples within a study.
Sample characteristics are indexed separately under a new ‘Attribute’ field in the GEO DataSets database allowing more refined queries.
A ‘similar studies’ link has been added to the GEO DataSets database. These links help users retrieve additional studies relevant to their area of interest. The links are computed on series PubMed citations using the same algorithm as PubMed’s ‘related articles’ links (10).
The ‘find pathways’ feature on GEO profiles (http://www.ncbi.nlm.nih.gov/geoprofiles/) retrievals allows users to map genes to a frequency weighted list of pathways in NCBI’s BioSystems database (11) helping to characterize lists of genes.
The ‘GEO repository browser’ (http://www.ncbi.nlm.nih.gov/geo/browse/) has undergone significant re-design. The browser has tabs containing tables that list series, sample, platform and DataSet records. The tables now include more auxiliary information that can be searched and filtered, as well as links to related records and supplementary file downloads. Tables can be exported and include further information not displayed on the browser, including corresponding PubMed identifiers and related SRA accessions.
The ‘my submissions’ page has been re-designed so that submitters can more easily track, browse and filter their deposits. It also serves as a gateway for performing updates and status edits.
All GEO series are now brokered to NCBI’s BioProject database (12). The BioProject database enables users to concurrently search for projects hosted by various databases at NCBI, including GenBank whole genome sequencing projects and dbGaP controlled access studies.
More proactive approaches for acquiring citation information have been implemented. Reciprocal links between GEO series records and corresponding articles in PubMed provide extra context to the data and enhances navigation to related data domains, including to free full-text versions of the article in PubMed Central where available. GEO uses several strategies to procure citation information including, most recently, a statement on series records that highlights when a citation is missing with an invitation to provide that information. When clicked, the invitation initiates either a dialogue box that enables direct provision of the PubMed identifier (for logged in submitters) or an email pre-populated with instructions on how to send citation information to GEO (for any user).
FTP site re-design. Although transparent to users, the organization of data on the FTP site has been upgraded to a virtual file system, implemented by Filesystem in Userspace (FUSE), offering greater flexibility in how data are packaged.
GEO2R web application for identifying differentially expressed genes
A major update recently implemented by GEO was release of the GEO2R web application, available at http://www.ncbi.nlm.nih.gov/geo/geo2r/. GEO2R presents a simple interface that allows users to perform sophisticated R-based analysis of GEO data to help identify and visualize differential gene expression. The GEO2R back end uses established Bioconductor (13) R packages to transform and analyse GEO data and presents results as a table of genes ordered by significance and that can be visualized with GEO Profile graphics. Unlike GEOs, other DataSet analysis tools [described in (9)], GEO2R does not rely on curated DataSet records and interrogates original submitter-supplied data directly. Over 90% of GEO studies may be analysed this way. This expands the utility of the database to a much wider audience, allowing a greater proportion of GEO data to be analysed in a timely manner and with more flexibility in terms of what groups of samples to compare and what type of analysis to perform.
Implementation and data flow
On the web interface, after the user specifies the series they want to analyse, a table populated with sample characteristics appears (Figure 2). The user designates up to 10 sample groups to compare and the type of analysis to perform. Users can accept default analysis settings, or they can choose to apply alternative P-value adjustments, force or override log transformation of input data or select alternative gene annotation categories. These parameters are passed to the back end where a ‘GEOquery’ (14) call loads the corresponding SeriesMatrix file and platform annotation files via FTP and returns the ExpressionSet object and contrasts, which are input for two R scripts, ‘boxplot’, which draws a boxplot of the distribution of expression values of selected samples helping users to determine whether the data are suitable for analysis, and ‘limma’ (15), which performs the topTable computation to extract a table of the top-ranked genes. The ‘limma’ results are processed according to the type of output requested, formatted in JSON and then used to create and populate html tables of the top 250 genes ranked by P-value. The results table contains various categories of statistics, including P-values, t-statistics and fold change, as well as gene annotations, including gene symbols, gene names, Gene Ontology (GO) terms and chromosome locations. The expression pattern of each gene in the table can be visualized by clicking the row to reveal expression profile graphs or the complete set of ordered results can be downloaded as a table. Alternatively, if users are not interested in performing differential expression analysis but rather only want to see the expression profile of a specific gene, they can bypass all the above and simply enter the Platform gene ID to visualize that profile. To assist users replicate their analyses, the native R script generated in each session is provided. This information can be saved as a reference for how results were calculated or used to reproduce GEO2R top genes results. A YouTube video tutorial demonstrating GEO2R functionality is available at http://www.youtube.com/watch?v=EUPmGWS8ik0.
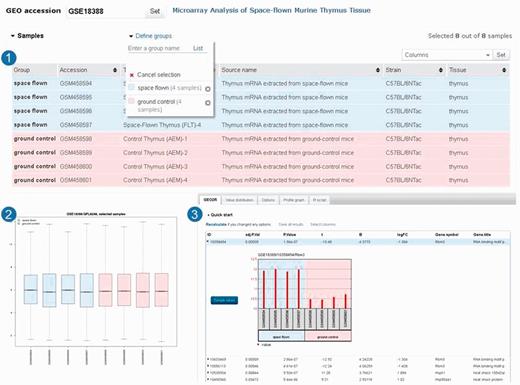
GEO2R screenshots. After selecting ‘analyse with GEO2R’ on series record GSE18388 (19), the user is presented with a table of the samples in that study and their descriptions (Panel 1). In this case, two sample groups are defined, and four samples are assigned to each group. The user can view the distribution of the sample values using the boxplot feature (Panel 2) and click the ‘Top250’ button to retrieve a table of the top 250 differentially expressed genes with statistics and gene annotation (Panel 3). The top hit is clicked to reveal the expression profile chart for that gene.
GEO DATA RE-USE
In the last GEO update article (16), we summarized the diverse ways in which the community re-uses GEO data, including providing evidence of specific gene expression to support hypotheses, testing material for algorithm development, identifying disease predictors, developing value-added target-audience databases and generally aggregating and analyzing data in ways not anticipated by the original data generators. Although data re-use is difficult to track accurately, based on usage citations monitored internally (http://www.ncbi.nlm.nih.gov/geo/info/citations.html) and by others (17), it seems that the re-use rate is increasing. There is evidence that more scientists are using a data-driven approach to research (18), whereby the first step in a project is to combine and re-analyse public data sets to reveal previously unknown relations or uncover ever more subtle trends in the data. The novel insights gained from such analyses are formed into hypotheses that can be tested in the laboratory. Such opportunities will only increase as more and better quality data become available.
SUMMARY
The GEO database, now 12 years old, continues to grow in terms of volume, diversity of data types and usage. The database and tools continue to undergo intensive development aimed at helping users to better explore and extract meaningful information and new discoveries from GEO data. Ongoing challenges include expanding integration and cross-linking with related resources, procuring more consistent sample annotation from submitters and providing additional methods for analysing next-generation sequence data.
FUNDING
Funding for open access charge: Intramural Research Program of the National Institutes of Health, National Library of Medicine.
Conflict of interest statement. None declared.

Comments