


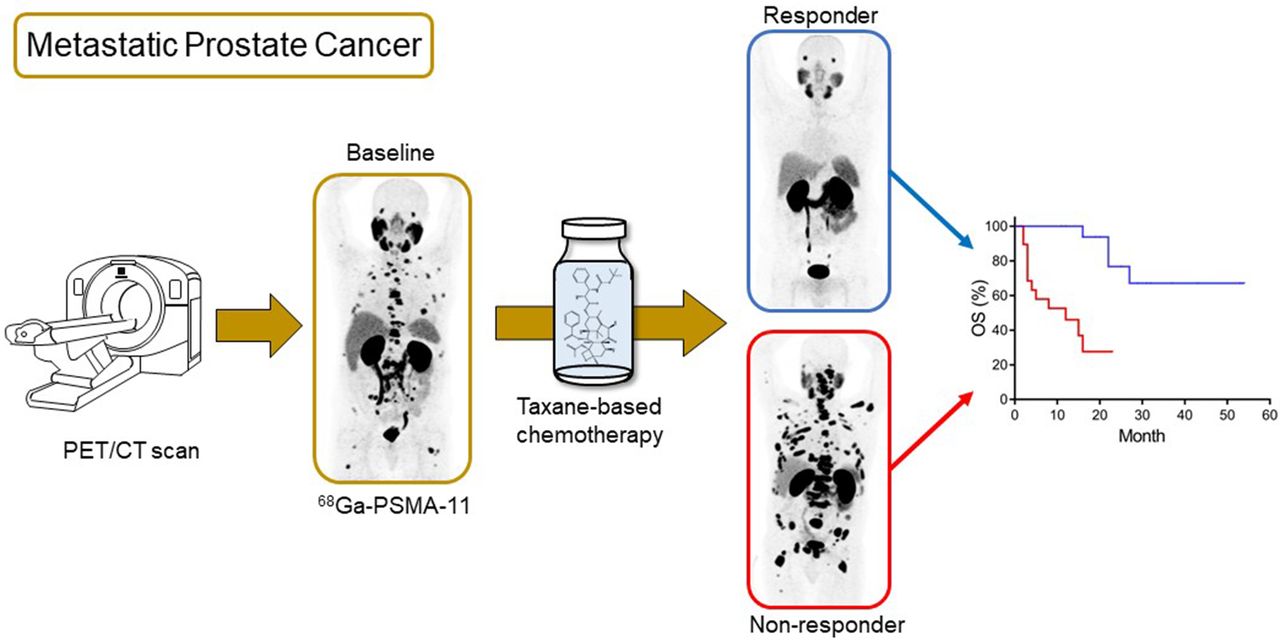
Visual Abstract

Abstract
We aimed to evaluate the role of PET targeting the prostate-specific membrane antigen (PSMA) for response assessment in metastatic prostate cancer (PCa) patients treated with taxane-based chemotherapy (docetaxel or cabazitaxel) and its predictive value on patient outcome. Methods: We retrospectively evaluated 37 patients with metastatic hormone-sensitive PCa or metastatic castration-resistant PCa (mCRPC) who underwent 68Ga-PSMA-11 PET/CT at baseline and after the last cycle of taxane-based chemotherapy (docetaxel or cabazitaxel) without treatment modification between scans. Biochemical response (BR) was defined as an undetectable or at least 50% decreased level of prostate-specific antigen, compared with baseline. Associations between BR and different PET parameters were tested. A cutoff of at least a 30% decrease in PSMA total tumor volume (PSMA-TV) was used to define a PSMA response (PSMA-R) versus a PSMA nonresponse (PSMA-NR). Correlations between PSMA PET/CT response and BR were evaluated using the ϕ-coefficient. Associations between PET response and overall survival (OS) was tested using Cox regression and the Kaplan–Meier method. Results: Our cohort comprised 8 (22%) metastatic hormone-sensitive PCa and 29 (78%) mCRPC patients. Twenty-one patients received docetaxel treatment, and 16 received cabazitaxel (median, 6 cycles; interquartile range, 5–8 cycles). BR was found in 18 of 37 patients. Using PSMA total tumor volume, PSMA PET/CT response was concordant with BR in 35 of 37 patients (ϕ = 0.89, P < 0.0001). Eighteen of 37 patients had PSMA-R (6, complete response; 12, partial response), and 19 had PSMA-NR (17, progressive disease; 2, stable disease). After a median follow-up of 23 mo, there was a statistically significant longer OS for PSMA-R than for PSMA-NR (median OS not reached vs. 12 mo, respectively; hazard ratio, 0.10; 95% CI, 0.03–0.39; P = 0.001) for the entire population. Among the mCRPC subgroup, differences in OS were also observed (median, 22 vs. 12 mo, respectively; hazard ratio, 0.22; 95% CI, 0.06–0.82; P = 0.023), with a 12-mo OS rate of 100% for PSMA-R and 52% for PSMA-NR (P = 0.011). Conclusion: This retrospective analysis suggests that 68Ga-PSMA-11 PET/CT is a promising imaging modality for assessing response to taxane-based chemotherapy in metastatic PCa. Changes in PSMA expression might be used as a predictive biomarker for OS to help tailor individual therapy and select eligible patients for clinical trials.
Prostate cancer (PCa) is the most frequently diagnosed cancer in men in Europe and the United States and the second most common cancer globally (1). Multiple systemic therapies are available for the treatment of metastatic PCa (mPCa). Of them, taxane-based chemotherapies are among the most effective treatments that prolong overall survival (OS). Docetaxel is recommended in metastatic castration-resistant PCa (mCRPC) and metastatic hormone-sensitive PCa (mHSPC) (2,3) because it has shown survival benefit (4,5). However, most patients who receive docetaxel therapy will ultimately develop resistance. In this context, cabazitaxel has been recommended in most guidelines after showing survival benefits in mCRPC patients resistant to docetaxel (2,3,6).
In mPCa, the assessment of response to systemic therapies, including taxane-based chemotherapy, remains challenging and complex. In routine practice, the response assessment is based on clinical evaluation, serum prostate-specific antigen (PSA), and conventional imaging techniques such as bone scintigraphy and computed tomography (CT). All of them are retained in the Prostate Cancer Working Group (PCWG) criteria for response assessment in clinical trials (7). However, they present intrinsic limitations in evaluating response accurately: clinical evaluation remains under clinicians’ and patients’ subjectivity, serum PSA level does not provide data about the heterogeneity of response and is a nonuseful biomarker in non-PSA–secreting disease, and CT and bone scintigraphy cannot assess the response in bone lesions because of frequent sclerotic or osteoblastic reactions in responding patients (8). Bone scintigraphy can assess only disease progression using the so-called 2 + 2 criteria to avoid the flare phenomenon (7). The last criterion hampers identifying progression in early stages (7). Notably, continuation of a potentially toxic treatment in progressive disease (PD) may further deteriorate the clinical condition of the patient or prevent switching into a new, effective treatment such as prostate-specific membrane antigen (PSMA)–targeted radioligand therapy (9,10). Therefore, there is an unmet need to find a tool to evaluate, in a more timely and accurate manner, the response to chemotherapy in advanced mPCa.
The recent development of PCa imaging using a specific radiotracer targeting PSMA has improved the diagnostic accuracy in initial staging and in detection of recurrence. PSMA PET coupled to CT provides high-quality images thanks to its high tumor-to-background ratio, improving disease detection rates and significantly impacting patients’ clinical management while being more cost-effective and causing less radiation exposure than conventional imaging techniques (11–13). Even if factors influencing PSMA expression levels are not well defined yet, it has been shown that a decrease in PSMA expression after exposure of PCa cells to taxane cytotoxic agents is due to a decrease in the number of viable cells and not to downregulation of PSMA receptor expression (14). Therefore, PSMA PET/CT might be used as an imaging tool to assess taxane chemotherapy cytotoxic effects. A role for PSMA PET/CT in response assessment has been found in previous studies showing promising results (15–21). However, these preliminary findings are still inconclusive because of the heterogeneous treatment modalities considered and the lack of outcome data. Also, there are limited literature data on the role of PSMA PET/CT in assessing response to taxane-based chemotherapy in mPCa, demanding further investigation. In this context, we aimed to investigate the role of 68Ga-PSMA-11 PET/CT for response assessment in mPCa patients treated with taxane-based chemotherapy and its predictive value on patient outcome.
MATERIALS AND METHODS
Patient Population
We retrospectively analyzed a database of all PSMA PET/CT scans obtained at our institution between January 2015 and May 2020 and selected all patients fulfilling the following criteria: histopathology-proven prostate adenocarcinoma, PSMA PET/CT performed within 2 mo before the start of taxane-based chemotherapy (docetaxel or cabazitaxel), and a second PSMA PET/CT scan up to 3 mo after the last cycle, without modification of treatment between scans (Fig. 1). In total, 37 patients were included in the final analysis. Baseline clinical characteristics, including hemoglobin level, alkaline phosphatase level, International Society of Urological Pathology grade group, and primary treatment, were recorded. All PSMA PET/CT scans were requested at the oncologist’s discretion. Patients were classified as mHSPC or mCRPC on the basis of the testosterone level at the time of treatment (2). The study was designed in concordance with the Declaration of Helsinki and good clinical practice. The institutional review board and ethical committee approved the study (approval CE3212), and the requirement to obtain informed consent was waived because of its retrospective and descriptive design.

Flowchart of patient selection process.
Imaging Protocol
All PSMA PET scanning was performed following our institution’s standard operating procedure. Images were acquired 60 ± 3 min after injection of a 1.9 ± 0.3 MBq/kg dose of 68Ga-PSMA-11 using a dedicated scanner (Discovery 690 time-of-flight; GE Healthcare). Images were acquired in 3-dimensional mode (2 min per bed position) from the middle of the thigh to the vertex. Ordered-subset expectation maximization (2 iterations and 24 subsets, gaussian filter of 6.8 mm in full width at half maximum) was used for image reconstruction. A low-dose CT scan (120 kVp) with no contrast iodine injection was used for attenuation correction and anatomic localization of lesions.
Image Analysis and Quantification
Pre- and posttreatment PSMA PET images were anonymized and stored on our institutional research server. Maximum-intensity projections and axial, sagittal, and coronal PET/CT images were evaluated on a dedicated workstation (AW Server, version 3.2; GE Healthcare). Two independent nuclear medicine physicians performed visual assessments without knowing any patient clinical data or outcomes. Any suggestive lesion with PSMA uptake higher than the background and not related to physiologic uptake was considered pathologic. Volumes of interest were drawn around the total tumor burden on baseline PSMA PET/CT and propagated automatically into the follow-up scan. Automatic segmentation was generated using a fixed SUV threshold of 3 as previously described (22), with manual modification to exclude sites of physiologic uptake (e.g., salivary glands and urinary tract). SUV was normalized for the patient’s lean body mass, and the volumetric parameters were calculated. Semiquantitative parameters were measured, including SUVmax, SUVmean, whole-body PSMA total tumor volume (PSMA-TV, the summation of all body lesions), and total lesion PSMA uptake (TL-PSMA, defined as PSMA-TV × SUVmean).
PSMA PET/CT Response Assessment
The PSMA PET–based response was assessed on a per-patient basis. Given that no specific response criteria have been previously validated for PSMA PET/CT, the cutoff we used was a 30% change in PSMA expression as recommended by the consensus statements on PSMA PET/CT response assessment criteria (23). This cutoff was applied to all analyzed PSMA PET quantification parameters. Four different categories were used: complete response (CR), defined as disappearance of uptake in all pathologic PET-positive lesions; partial response (PR), defined as a decrease of at least 30% of PSMA uptake; stable disease, defined as a change in PSMA expression of between +29% and −29%; and PD, defined as the appearance of at least 2 new lesions or an increase in PSMA uptake by at least 30% from baseline (Fig. 2). A patient with PSMA response (PSMA-R) was a patient presenting CR and PR, and a patient with PSMA nonresponse (PSMA-NR) was a patient presenting PD and stable disease.

Maximum-intensity-projection images of different response scenarios on PSMA PET/CT. PSMA-R: including patients A and B with, respectively, disappearance of all PSMA-positive lesions (CR) or decrease of PSMA-TV > 30% (PR). PSMA-NR: including patients C and D with, respectively, appearance of new lesions and increased PSMA-TV > 30% (PD) or neither new PSMA-positive lesions nor PSMA-TV 30% changes. SD = stable disease.
Biochemical Response (BR) Assessment
The PSA level measured at the time of PSMA PET/CT, before and after therapy, was recorded (time window, ±1 wk). On the basis of PSA percentage changes, patients were classified as having BR if they had either an undetectable PSA level or a decrease by at least 50%, and patients were classified as having a biochemical nonresponse (BNR) if they had an increase in PSA or a decrease by less than 50%.
Statistical Analysis
Descriptive statistics were computed for the baseline patient characteristics, and distributions were reported with median and interquartile range (IQR) for continuous variables and relative frequencies for categoric variables. The Fisher exact test (for categoric variables) and the Mann–Whitney U test (for continuous variables) were used to explore associations between baseline patient characteristics and PSMA PET response status. The distribution of continuous variables was dichotomized on the basis of the median. The ϕ-coefficient test was performed to analyze the correlation between PSMA PET and PSA-based responses. The Cox regression hazard model was used to evaluate associations between the clinical variables, including hemoglobin, alkaline phosphatase, baseline PSA levels, PSMA PET response, and OS. Univariate significant factors for OS (P < 0.05) were included in multivariable analyses. Kaplan–Meier curves were used to plot patient survival and to estimate survival probabilities, and the log-rank test was used to compare the survival curves. A subgroup survival analysis of mCRPC patients was performed. OS was estimated from the second PSMA PET scan to the date of death or last follow-up. A 2-sided P value of less than 0.05 was considered statistically significant. Statistical analyses were performed using SPSS Statistics, version 23.0 (IBM).
RESULTS
Patient Population
Thirty-seven patients were included in the analysis. At the time of baseline PSMA PET, the median age was 70 y (IQR, 61‒74 y). At PCa diagnosis, the median International Society of Urological Pathology grade group was 4 (range, 1–5). The median baseline PSA level was 27 ng/dL (IQR, 13‒85 ng/dL). The study cohort comprised 8 (22%) mHSPC and 29 (78%) mCRPC patients. Twenty-one (57%) patients received docetaxel, and 16 (43%) received cabazitaxel (median, 6 cycles; IQR, 5‒8 cycles). Baseline PSMA PET was performed within a median of 16 d (IQR, 9‒30 d) before the first cycle of taxane-based chemotherapy, and the posttreatment scan was done within a median of 27 d (IQR, 18‒44 d) after the last cycle. Patient characteristics are summarized in Table 1.
Patient Characteristics (n = 37)
Quantitative PET Parameters
The medians of the quantitative baseline PET parameters PSMA-TV, TL-PSMA, SUVmax, and SUVmean were 136 cm3 (IQR, 24.5‒471 cm3), 1,182 cm3 (IQR, 146.5‒4,086 cm3), 22.9 (IQR, 10.2‒39.6), and 5.7 (IQR, 4.2‒9.3), respectively. Posttherapy median percentage changes were −36% (IQR, −86% to +55%) for PSMA-MTV, −43% (IQR, −87% to +93%) for TL-PSMA, −22.4% (IQR, −52% to +8%) for SUVmax, and −11% (IQR, −30% to +2%) for SUVmean. The PSMA-response criteria were applied to each PET parameter, and the concordance with PSA response is presented in Table 2. PSMA-TV and TL-PSMA performed equally well and showed the highest concordance, with a ϕ-coefficient of 0.89 (P < 0.0001, for both). PSMA-TV was then used as the PET parameter to define PSMA-R versus PSMA-NR and to evaluate associations with clinical variables and OS.
Distribution of PSMA PET/CT Responses According to Different PET Parameters and Their Concordance with PSA Response
Response Assessment Based on PSMA PET/CT
Among all patients, 18 patients were classified as PSMA-R (6 CR and 12 PR), and 19 patients were classified as PSMA-NR (17 PD and 2 stable disease). In patients with PR, the median PSMA-TV decrease was −72% (range, −98% to −40%). Among PD patients, 5 patients had an increased PSMA-TV (median, +57%; range, +30% to +84%) and 12 patients had at least 2 new lesions. Finally, 2 patients had stable disease, with a PSMA-TV percentage change of −19% and +18% without new lesions. The percentage changes for each patient are presented in Figure 3A.

Waterfall plot representing individual percentage changes in PSMA-TV (A) and PSA (B) after taxane-based chemotherapy.
Association Between Baseline Clinical Variables and PSMA PET/CT Response
There was a statistically significant difference between PSMA-R and PSMA-NR in terms of disease status (mHSPC vs. mCRPC, P = 0.001), baseline hemoglobin level (P = 0.023), alkaline phosphatase level (P = 0.048), and number of cycles (P = 0.002). Regarding the number of cycles, patients with PSMA-R received a median of 6 cycles (IQR, 6–10 cycles), compared with a median of 5 cycles (IQR, 5–6 cycles) for PSMA-NR. On the other hand, there was no significant correlation between the PSMA PET/CT response status and patient age, type of therapy (docetaxel vs. cabazitaxel), International Society of Urological Pathology grade group, primary treatment (local vs. systemic), or baseline PSA (Table 3).
Differences Between PSMA-R and PSMA-NR Regarding Different Clinical Factors
Association Between BR and PSMA PET/CT Response
The median PSA change after therapy was −43% (IQR, −94% to +93%) (Fig. 3B). Eighteen patients had BR with a median PSA decrease of −93% (IQR, −98% to −74%). Of patients with BR, PSMA PET/CT showed CR in 6 patients and PR in 11. Interestingly, of all patients with PR on PSMA PET/CT, 3 patients (27%) had less than 3 residual PSMA lesions after taxane-based chemotherapy and thus could be considered oligoresistant. Nineteen patients had BNR with a median PSA change of +90% (IQR, +11% to +219%); of them, 16 patients had PD on PSMA PET/CT (12 patients with new lesions and 4 with increased PSMA-TV), and 2 patients had no significant PSMA uptake changes (stable disease) on posttherapy PSMA PET (Table 4).
Distribution of Response as Defined According to PSA and PSMA PET/CT
The PSMA PET/CT response was concordant with PSA response in 95% of patients (100% in mHSPC and 85% in mCRPC), with 17 patients having PSMA-R/BR and 18 having PSMA-NR/BNR (ϕ = 0.89, P = 0.0001). However, 2 mCRPC patients had discordant responses: one had PSMA-R/BNR with a PSMA-TV of −42% but a PSA of +96%; the other had PSMA-NR/BR with PSMA PET/CT showing more than 2 new lesions but a PSA decrease of 52%.
Patient Survival Outcomes According to PSMA PET/CT Response Criteria
At a median follow-up of 23 mo (IQR, 15‒30 mo), 16 deaths had occurred. Among the whole population, PSMA-R had longer OS than PSMA-NR (median OS not reached vs. 12 mo, respectively; hazard ratio, 0.10; 95% CI, 0.03–0.39; P = 0.001). In the subgroup analysis of mCRPC, a statistically significant difference in OS was also present, with PSMA-R showing longer OS than PSMA-NR (median OS, 22 vs. 12 mo, respectively; hazard ratio, 0.22; 95% CI, 0.06–0.82; P = 0.023). In addition, PSMA-R had an increased 12-mo OS of 100%, compared with 52% for PSMA-NR (P = 0.011) (Fig. 4). Among the mHSPC subgroup, only 1 death was registered at 27 mo of follow-up. Regarding the 2 patients with a discordant PSMA/PSA response, the patient with PSMA-R/BNR was still alive at 20 mo, whereas the patient with PSMA-NR/BR died 15 mo after the second scan.

(A and B) Kaplan–Meier plots for OS in whole population (A) and in mCRPC subgroup (B). (C and D) Kaplan–Meier plots for OS for PSMA-R vs. PSMA-NR in whole population (C) and in mCRPC subgroup (D). P values were obtained from log-rank test.
PSA-based response criteria were significantly associated with OS in the overall population: OS was longer for BR than for BNR (median OS not reached vs. 12 mo; hazard ratio, 0.16; 95% CI, 0.05–0.56; P = 0.004). However, the association of PSA-based response criteria with OS in the mCRPC subgroup was not statistically significant (hazard ratio, 0.35; P = 0.083). Other factors associated with OS are presented in Table 5. Because of the small number of events, multivariable analysis was performed on 2 models; PSMA PET/CT response was significant for predicting OS in both model 1 (P = 0.003) and model 2 (P = 0.025) (Table 5).
Univariate and Multivariate Cox Regression Analyses Presenting Association of Clinical Factors and PSMA PET/CT Response with OS
DISCUSSION
In this study, the role of PSMA PET/CT for response assessment in mPCa patients undergoing taxane-based chemotherapy was retrospectively evaluated. We selected patients who received only taxane-based chemotherapy, without treatment modification between the baseline and posttherapeutic scans. The results showed a strong correlation between PSMA PET/CT–based response and PSA-based response. Moreover, the PSMA PET response was independently predictive of survival, with a statistically significant difference in OS between PSMA-R and PSMA-NR.
The strong correlation between PSMA PET/CT–based response and PSA-based response was superior to what was previously reported by Seitz et al. (21). They analyzed 23 patients undergoing docetaxel chemotherapy and showed a correlation between PSMA PET/CT response and PSA-based response of 86% for mHSPC and 56% for mCRPC. Our study found a perfect correlation (100%) in the mHSPC subgroup and substantial concordance (85%) in the mCRPC group. Many factors might explain these differences, including the low number of patients or the methodology used to assess response. In fact, the PSMA PET/CT response criteria are not standardized yet. Some investigators have proposed extrapolating PERCIST applied for 18F-FDG PET/CT to the PSMA PET/CT scan (15,19,21). Nevertheless, these criteria analyze response in only selected target lesions and not in the whole tumor volume. In patients with diffuse skeletal metastases, selecting individual lesions is practically unfeasible because of the added difficulty in assessing response (19). To assess response to treatment on PSMA PET/CT, the treatment-induced percentage changes in different PET quantitative parameters were tested (SUVmax, SUVmean, PSMA-TV, and TL-PSMA), all of them showing a significant correlation with PSA response. Of them, PSMA-TV and PSMA-TL performed equally well and showed the highest concordance, with a ϕ-coefficient of 0.89 (P < 0.0001, for both). We selected PSMA-TV for the subsequent analysis of the study. PSMA-TV represents the whole-body PSMA-expressing tumor burden; therefore, PSMA-TV changes may reflect taxane-induced cytotoxic effects. Preclinical data have previously shown that decreased PSMA expression after taxane-based chemotherapy resulted from a decline in the number of viable cells and not from a decrease in PSMA expression on the cell membrane (14). Other studies have reported potential value for PSMA-TV in assessing response to different systemic therapies in PCa but none in assessing a homogeneous population under taxane-based chemotherapy (15,24,25). We defined the response on PSMA PET/CT using PSMA-TV and a cutoff of a 30% decrease to differentiate PSMA-R from PSMA-NR, as well as the appearance of new lesions, based on the “Consensus Statements on PSMA PET/CT Response Assessment Criteria in Prostate Cancer” (23). In our cohort, the 30% cutoff is also close to the median PSMA-TV percentage change (−36%). Interestingly, the posttherapy PSMA PET/CT scan could identify 3 patients presenting PSA and PSMA PR but showing oligoresistant disease, meaning that all metastatic lesions showed a CR except for 1–3 lesions. This is a unique ability of molecular imaging with PSMA PET/CT that cannot be reproduced if one is following up the patient only by using tumor markers such as PSA. PSA changes will give patient-based information but never lesion-based information. This finding will probably open a new area of research to determine whether oligoresistant patients might benefit from additional targeted treatments such as stereotactic body radiation therapy, in a strategy similar to the one proposed for oligometastatic disease at biochemical recurrence—today treated with metastasis-directed therapy (26).
Since PSA can be considered a contested biomarker of response in mCRPC, we evaluated the association of PSMA PET/CT response with OS. In our cohort, the PSMA PET/CT response was significantly associated with OS, showing a statistically significant difference between PSMA-R and PSMA-NR (median OS not reached vs. 12 mo) and a 75% lower hazard rate of death in responding patients. OS in the 2 patients with discordant PSMA/PSA responses was more in line with the PSMA response than with the PSA response. The patient with decreased PSMA expression but increased PSA was alive at 20 mo, whereas the patient presenting new lesions on PSMA PET/CT but decreased PSA (>50%) died at 15 mo of follow-up. Moreover, our results suggest a potential superiority of PSMA PET/CT response over PSA response, as PSMA PET/CT responses could significantly predict OS in mCRPC patients whereas PSA-based responses could not. To the best of our knowledge, this was the first study analyzing the role of PSMA PET/CT response as a predictive biomarker for OS in patients undergoing taxane-based chemotherapy. Future prospective studies must follow to validate this imaging technique as a response assessment tool before its introduction into clinical practice and clinical trials. Other known clinical risk factors, such as disease state, hemoglobin level, and alkaline phosphatase level, were also tested and showed a statistically significant association with OS and with the PSMA PET/CT response. When we tested for possible confounding factors in a multivariable analysis, PSMA PET/CT response remained an independent predictive factor for OS. However, this observation needs to be validated on a larger population.
Assessing response to systemic treatment in mPCa patients using conventional imaging techniques is a difficult task. According to the PCWG criteria, radiographic response with CT or MRI can be measured with RECIST, version 1.1, only in the presence of measurable lesions (excluding sclerotic bone lesions and subcentimetric lymph nodes). With PCa metastatic disease being located predominantly in bone and lymph nodes, RECIST 1.1 is applicable in only a minority of cases. The ability of PSMA PET/CT to accurately detect metastatic disease, and the potential role of PSMA PET/CT in response assessment, may have an important impact on clinical management. Following the PCWG criteria, systemic treatments should not be stopped on the basis of PSA values during the first 12 wk after treatment initiation (7); patients should receive at least 5 cycles of chemotherapy, even if they are finally not responding. That recommendation increases the risk of treatment-related toxicity in patients not benefiting from it, deteriorating the patient’s clinical condition, which may, in turn, have a negative impact on the choice of subsequent treatment. In this context, early response assessment with PSMA PET/CT could allow for rapid switching to another effective systemic therapy, such as 177Lu-PSMA-617, which has recently demonstrated a benefit in OS in mCRPC after taxane-based chemotherapy (9,10). Prospective trials are needed to test the negative predictive value of PSMA PET/CT response assessed early during chemotherapy (e.g., after 4–8 wk) instead of at the end of treatment.
Our study had some limitations that emerge from its retrospective design and the limited number of patients. The outcome might have been influenced by the inclusion of a heterogeneous population with mCRPC and mHSPC patients. However, the predictive value of PSMA PET/CT response was confirmed in the subgroup analysis performed on mCRPC patients. Because the study was retrospective, PSMA PET/CT time points were not standardized between patients, but a maximum time window was applied. The study did not compare PSMA PET/CT response to RECIST 1.1 because only a minority of patients had RECIST-measurable disease and because the CT part of the PET/CT was low-dose without contrast injection, making it suboptimal for RECIST 1.1 measurements (27). It is well known that RECIST 1.1 has an inherent limitation in monitoring the response of sclerotic bone metastases, which constitute most of the metastatic presentation in mCRPC patients. Moreover, small lymph nodes are easily depicted with PSMA PET/CT but are not measurable by RECIST 1.1. On the other hand, the recent improvements in semiautomatic segmentation methods and quantification analysis on PSMA PET/CT scans will facilitate its implementation as a response assessment tool in routine clinical practice.
CONCLUSION
This retrospective analysis suggests that 68Ga-PSMA-11 PET/CT is a promising imaging tool to assess response to taxane-based chemotherapy (docetaxel and cabazitaxel) in mPCa patients. Posttherapeutic changes in PSMA expression correlate strongly with PSA and may be used as an independent predictive biomarker for OS, with PSMA-R presenting significantly longer OS than PSMA-NR. This tool might help in tailoring individual treatment and selecting eligible patients for clinical trials. Further prospective studies are needed to confirm these findings.
DISCLOSURE
No potential conflict of interest relevant to this article was reported.
KEY POINTS
QUESTION: Can PSMA PET/CT be used to assess response to taxane-based chemotherapy in mPCa patients?
PERTINENT FINDINGS: Changes in PSMA expression on PET/CT were associated with response to therapy and could independently predict OS. PSMA-R presented a significantly longer OS than PSMA-NR.
IMPLICATIONS FOR PATIENT CARE: PSMA PET/CT is a promising imaging technique that can be used to assess the response to taxane-based chemotherapy and to predict a patient’s prognosis.
Footnotes
Published online Nov. 12, 2021.
- © 2022 by the Society of Nuclear Medicine and Molecular Imaging.
REFERENCES
- Received for publication August 6, 2021.
- Accepted for publication November 8, 2021.
In this issue


Jump to section
Related Articles
Cited By...
- Prognostic Performance of RECIP 1.0 Based on [18F]PSMA-1007 PET in Prostate Cancer Patients Treated with [177Lu]Lu-PSMA I&T
- PSMA PET/CT for Response Assessment and Overall Survival Prediction in Patients with Metastatic Castration-Resistant Prostate Cancer Treated with Androgen Receptor Pathway Inhibitors
- Prognostic Role of 68Ga-PSMA11 PET-Based Response in Patients with Prostate Cancer Undergoing Taxane-Based Chemotherapy
- PSMA PET/CT and Therapy Response Evaluation in Metastatic Prostate Cancer: Is It Time to Surpass the Old Way?
- PSMA PET/CT and Therapy Response Evaluation in Metastatic Prostate Cancer: Is It Time to Surpass the Old Way?