


Abstract
From the Newsline Editor: The Highlights Lecture, presented at the closing session of each SNMMI Annual Meeting, was originated and presented for more than 30 years by Henry N. Wagner, Jr., MD. Beginning in 2010, the duties of summarizing selected significant presentations at the meeting were divided annually among 4 distinguished nuclear and molecular medicine subject matter experts. Each year Newsline publishes these lectures and selected images. The 2021 Highlights Lectures were delivered on June 15 as part of the SNMMI Virtual Annual Meeting. In this issue we feature the lecture by Sharmila Dorbala, MD, MPH, a professor of radiology at the Harvard Medical School and Director of Nuclear Cardiology at Brigham and Women’s Hospital (Boston, MA), who spoke on highlights from the cardiovascular track at the meeting. Note that in the following presentation summary, numerals in brackets represent abstract numbers as published in The Journal of Nuclear Medicine (2021;62[suppl 1]).
It is a pleasure to present the 2021 Cardiovascular Highlights at the SNMMI Virtual Annual Meeting. The Cardiovascular Highlights session represents the key science selected for presentation based on novelty of the research, advances in the field, and thematic tracks. This year, the meeting featured 935 scientific abstracts, of which 75 (7%) were in the Cardiovascular Science track. Of these, 20% were in the basic sciences, with the remaining 80% covering clinical topics. These abstracts showcased research from Canada, China, Denmark, Germany, Japan, Republic of Korea, South Africa, Switzerland, Taiwan, and the United States. Major emerging themes from this year’s cardiovascular presentations included: perfusion imaging advances (SPECT flow quantification, peripheral vascular disease); novel molecular tracers (fibrosis imaging, both human and preclinical; mitochondrial function imaging); volumetric SPECT/CT amyloidosis imaging; microcalcification imaging (perioperative myocardial infarction [MI] prediction, total atherosclerotic burden); and machine learning (automatic quantitation of microcalcification and of SPECT and PET myocardial perfusion imaging [MPI]). I have selected 10 key research presentations to highlight these themes, and I urge you to follow the SNMMI Virtual Meeting to get an overview of the entire spectrum of the novel cardiovascular research presented this year.

Sharmila Dorbala, MD, MPH
One highlight of the Annual Meeting is the naming of the Cardiovascular Council Young Investigator Award Winners. The awardees were the presenting authors on investigations from outstanding teams of researchers. In the Basic Science/Preclinical category, the first-place awardee was Felicitas J. Detmer, PhD, (Massachusetts General Hospital/Harvard Medical School; Boston, MA) for “Imaging of mitochondrial function in doxorubicin-induced cardiotoxicity.” Recognized in second place was Benjamin Wilk (Western University; London, Canada) for “Myocardial glucose suppression interferes with the detection of inflammatory cells with FDG PET in a canine model of myocardial infarction.” The third-place award in this category went to Zhao Liu, PhD, (Yale University; New Haven, CT) for “Assessment of lower extremities flow using dynamic 82Rb PET: Acquisition protocols and quantification methods.” The first-place Cardiovascular Council Young Investigator Award in the Clinical category went to Ananya Singh, MS, (Cedars-Sinai Medical Center; Los Angeles, CA) for “Improved risk assessment of myocardial SPECT using deep learning: Report from the REFINE SPECT registry.” The second-place award was presented to Sarah Boughdad, MD, PhD, (CHUV; Lausanne, Switzerland) for “68Ga-DOTATOC PET/CT to detect immune checkpoint inhibitor-related myocarditis.” The third-place award in this category went to Xuezhu Wang (Peking Union Medical College Hospital/Chinese Academy of Medical Science; Beijing, China) for “Dynamic analysis of 11C-PIB PET/CT in amyloid light-chain cardiac amyloidosis.” I will be highlighting several of these presentations in this lecture.
Brenande de Oliveira Brito et al. from the University of Ottawa Heart Institute (Canada) reported that “SPECT blood flow improves per-vessel sensitivity of myocardial perfusion imaging to detect ischemia” [26]. They studied 172 patients who underwent SPECT MPI and blood flow quantitation. Their results showed that myocardial blood flow assessment had higher sensitivity than MPI on a per-vessel basis to detect hemodynamically obstructive disease compared to the per-patient basis, where there was no significant difference. Figure 1 shows imaging data from an example patient, in whom the stress and rest perfusion SPECT images demonstrate a perfusion defect. Coronary angiography, however, confirmed previous obstructive coronary artery disease (CAD). The polar maps show reduced peak stress myocardial blood flow and myocardial flow reserve in all 3 vascular territories. This research is important, because quantitational SPECT myocardial blood flow is now feasible with some of the modern solid-state SPECT cameras and, as SPECT is widely available, routine use of quantitative SPECT in clinical practice may enable better identification of the extent of hemodynamically significant obstructive CAD.

SPECT blood flow and per-vessel sensitivity of myocardial perfusion imaging (MPI) to detect ischemia. Imaging data from example patient who underwent SPECT MPI and blood flow quantitation. Stress and rest perfusion SPECT images (top left) demonstrate a perfusion defect. Polar maps show resting blood flow (top), stress blood flow (middle), and myocardial flow reserve (bottom), indicating reduced myocardial flow reserve and peak stress flow in all 3 vascular territories. Coronary angiography confirmed previous obstructive coronary artery disease. These results indicated that SPECT myocardial blood flow assessment can improve the sensitivity of ischemia detection by MPI.
Liu et al. from Yale University/Yale University School of Medicine and Bridgeport Hospital (all in New Haven, CT) reported on “Assessment of lower extremities flow using dynamic 82Rb PET: Acquisition protocols and quantification methods” [53]. The aim of this study was to investigate and optimize data acquisition protocols and quantitative data processing methods for dynamic 82Rb PET imaging in an established porcine model of peripheral arterial disease through tracer candidate modeling. Their report also included initial human studies. The researchers acquired a 7-minute single-bed dedicated cardiac imaging scan to define the gold standard input function from the left ventricle (LV) blood pool scan, followed by a 2-minute single-bed scan of the abdominal aorta and then 5.5-minute multiple fast continuous-bed motion scanning for the lower extremities. The estimated arterial input function on the images was validated with blood sampling in animal models. The authors noted that the peak input function derived from the abdominal aorta was consistently about 60% underestimated compared to the LV function. They used a single-compartment model to measure K1 values. In an acute ischemic hindlimb imaged at rest and stress in the pigs (Fig. 2), K1 values were lower in ischemic than nonischemic limbs. After developing and refining their investigational technique in the animal model, the authors studied 4 healthy humans and 1 diabetic patient (Fig. 2). The K1 values in the diabetic patient were much lower than those in healthy subjects. The authors concluded that “It is feasible to quantify skeletal muscle blood flow in the lower extremities using dynamic 82Rb PET.” These results are important because peripheral arterial disease is a major public health problem. Imaging of peripheral arterial disease and blood flow to the lower extremities is emerging as a novel application in nuclear cardiology. This project opens the door to perfusion imaging in peripheral arterial disease—an entirely new cardiovascular application.

Assessment of lower extremities flow using dynamic 82Rb PET. A 1-tissue compartmental model with a blood volume term was used to quantify K1. Top: Representative K1 parametric images at rest (left) and adenosine stress (right) in a pig with acute hindlimb ischemia (left in each image). Adenosine stress increased the K1 heterogeneity and enhanced the relative flow deficit in the ischemia zone. K1 values were significantly lower in the ischemic limb than in nonischemic areas. Bottom: Representative summed dynamic skeletal muscle images (left) and K1 parametric maps (right) with 82Rb PET (top) compared to 15O-water PET (bottom) for validation in a control human subject. In humans, K1 values were much lower in diabetic patients than in healthy controls.
Diekmann et al. from the Hannover Medical School (Germany) reported that “The area of fibroblast activation exceeds the hypoperfused infarct region in patients with acute myocardial infarction” [135]. The study included 12 patients who underwent cardiac MRI, perfusion SPECT, and 68Ga-FAPI-46 PET/CT at 6–11 days after reperfused acute MI. MRI defined cardiac function and the extent of late gadolinium enhancement (LGE). All patients showed regional FAP signal enrichment at the infarct site relative to blood pool. The extent of FAPI signal was also found to be much greater than that of the perfusion defect. Figure 3 (left) shows an example patient with a matching pattern of a perfusion defect and FAPI upregulation. Figure 3 (right) shows a mismatch pattern in a patient with an anterior wall perfusion defect where the area of FAPI-upregulation significantly exceeded that of the perfusion defect and region of late enhancement on MRI. No relevant signal was observed in remote myocardium or other peripheral organs, including liver, spleen, bone marrow, or lungs. No correlation was detected between the FAP signal and available clinical variables, including measures of myocardial damage. FAP signal was present on MRI in segments with transmural infarct (>75% transmural LGE) and nontransmural infarct (25%–75% LGE). Notably, even among patients with <25% LGE the authors found that about half of segments demonstrated significant FAP signal, suggesting fibroblast activation in the noninfarcted myocardium as well. The authors concluded that the fact that fibroblast activation markedly exceeds the hypoperfused infarct region in patients after acute MI and early reperfusion therapy and that the extent of this regional upregulation varies so significantly among individuals should be further explored to illuminate the underlying mechanisms. This is a study with current relevance, because imaging of activated fibroblasts is of critical importance for development of novel therapies to prevent ventricular remodeling, not only in MI but in a number of other cardiovascular diseases and in heart failure.

Fibroblast activation in patients imaged with cardiac MRI, perfusion SPECT, and 68Ga-FAPI-46 PET/CT at 6–11 days after reperfused acute myocardial infarction (MI). Patient examples show (top to bottom) 99mTc-tetrofosmin perfusion imaging, 68Ga-FAPI-46 fibroblast imaging, initial cardiac MRI/late gadolinium enhancement, and perfusion defect maps with FAPI signal areas in red. Left block shows a patient example with a matching pattern of perfusion defect and FAPI upregulation. Right block shows a patient in whom FAPI upregulation significantly exceeds perfusion defect and enhanced area on MRI. Fibroblast activation markedly exceeded the hypoperfused infarct region in patients after acute MI and early reperfusion therapy, and the extent of this regional upregulation varied significantly among individuals.
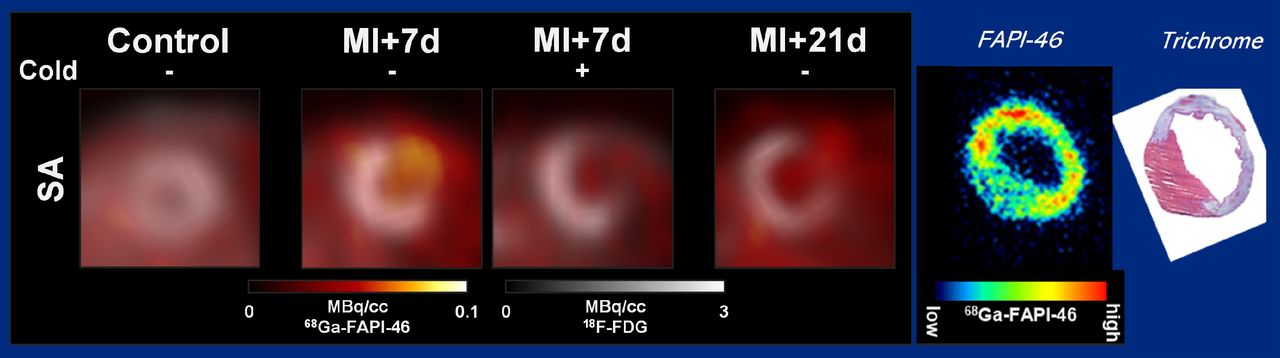
Hess et al. from the same group at the Hannover Medical School (Germany) reported on “Preliminary characterization of 68Ga-FAPI-46 for molecular imaging of cardiac fibroblast activation” [134]. They used FAPI here for in vitro and in vivo studies of cardiac fibroblast activation. In vitro studies showed selective 68Ga-FAPI-46 uptake by transfected HT1080 cells overexpressing mouse or human FAP. Human cardiac fibroblasts also exhibited a moderate specific tracer uptake. Imaging in healthy control mice showed low background tracer accumulation in myocardial regions and liver, with rapid renal clearance. FAP expression on PET tended to be higher in mice 7 days after MI than in control mice (Fig. 4), with upregulation in infarct areas declining by 21 days. Co-injection of unlabeled precursor lowered the infarct FAP signal on day 7. Localization of the signal was confirmed by ex vivo autoradiography, where the FAP signal exceeded the Masson trichrome–derived infarct area, suggesting sensitivity to replacement and reactive fibrosis. The authors concluded that their findings support the feasibility of FAP imaging for cardiac fibroblast activation in mice but noted that the low absolute uptake in this animal model may complicate quantitative measurements in vivo. The clinical data presented in the previous study and the preclinical data presented in this study set the stage for innovative future investigations in imaging activated fibroblasts in various cardiovascular diseases.

Preclinical 68Ga-FAPI-46 for molecular imaging of cardiac fibroblast activation. In vivo PET studies in mice showed (left to right): low background tracer uptake in controls, selective 68Ga-FAPI-46 in a myocardial infarct model at 7 days after infarct, 18F-FDG co-injection uptake at 7 days after infarct, and decline of 68Ga-FAPI-46 uptake by 21 days. Localization of the FAPI signal was confirmed by ex vivo autoradiography (right), where the signal exceeded the Masson trichrome–derived infarct area, suggesting sensitivity to replacement and reactive fibrosis.
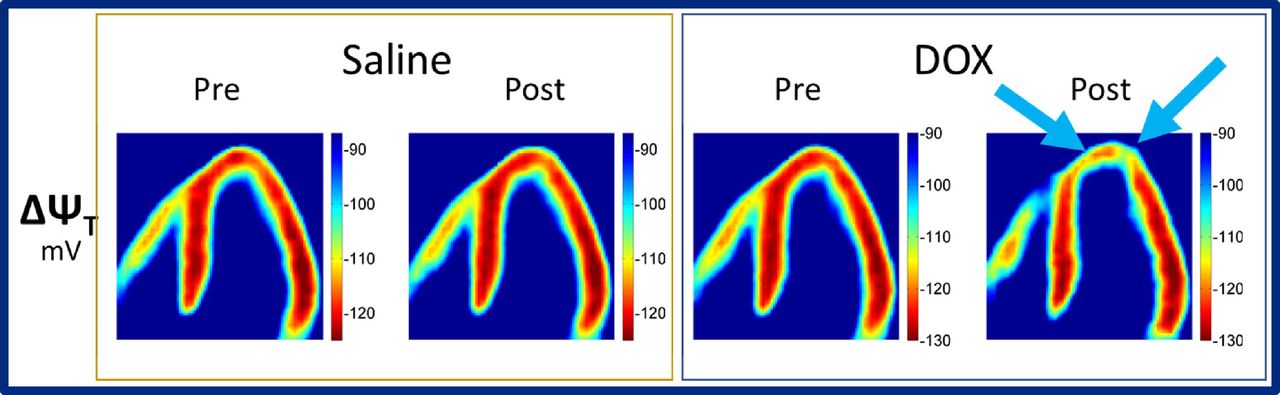
Detmer et al. from the Massachusetts General Hospital/Harvard Medical School (Boston, MA) reported on “Imaging of mitochondrial function in doxorubicin-induced cardiotoxicity” [51]. These investigators used a novel tracer, 18F-triphenylphosphonium (18F-TPP+), for PET imaging of mitochondrial function in an acute doxorubicin-induced cardiomyopathy model and to explore the utility of the tracer for total membrane potential mapping in monitoring cardiotoxicity during and after chemotherapy. Seven pigs were studied with 18F-TPP+ PET after acute doxorubicin or control saline infusions into the mid-left anterior descending (LAD) coronary artery. The results showed local depolarization of total membrane potential during or following doxorubicin infusion in LAD segments but no changes in control segments or after saline infusion (Fig. 5). The results of this study are significant, because mitochondrial dysfunction forms the basis for a number of cardiomyopathies. If these results are validated in a larger study and in human studies, novel tracers such as 18F-TPP+ can enhance molecular imaging of cardiomyopathies and our understanding of mitochondrial dysfunction.

Imaging of mitochondrial function in doxorubicin-induced cardiotoxicity. 18F-triphenylphosphonium (18F-TPP+) PET was used to image mitochondrial function in an acute doxorubicin-induced cardiomyopathy porcine model and to explore the utility of the tracer for total membrane potential mapping in monitoring cardiotoxicity during and after chemotherapy. Seven pigs were studied with 18F-TPP+ PET before (left in each parametric image set) and after (right in each image set) acute doxorubicin (right set) or control saline (left set) infusions into the mid-left anterior descending (LAD) coronary artery. Results showed local depolarization of total membrane potential during or following doxorubicin infusion in LAD segments but no changes in control segments or after saline infusion.
Watanabe et al. from Kanazawa University Hospital (Japan) reported on “Volumetric evaluation of 99mTc-pyrophosphate (99mTc-PYP) SPECT/CT in patients with transthyretin cardiac amyloidosis (ATTR-CA): Optimization and correlation with cardiac functional parameters” [137]. In a retrospective study of 43 patients assessed with 99mTc-PYP SPECT/CT for ATTR-CA, the researchers evaluated aortic blood pool 99mTc-PYP activity using SUVmax in the ascending aorta at the level of the pulmonary artery bifurcation; total volume of the myocardial region where 99mTc-PYP uptake was >1.0×, >1.2×, and 1.4× of the aortic blood pool SUVmax within the left and right ventricular myocardium (defined as cardiac metabolic volumes); and conventional planar heart-to-contralateral lung uptake ratio. Thirty-seven of the patients had undergone endomyocardial biopsy. The key findings in this study were that the cardiometabolic volume of 1.2× aortic blood pool activity achieved the highest sensitivity and specificity (91% and 100%, respectively) for identifying patients with ATTR-CA, with overall accuracy better than that of the other metrics. The authors also showed that volumetric evaluation of amyloid activity using the cardiac metabolic volume 1.2× correlated linearly with brain natriuretic peptide, a measure of heart failure, and correlated inversely with left ventricular ejection fraction. This study is important because it adds to the growing body of literature supporting the use of volumetric SPECT-based methods for evaluating the disease burden of cardiac amyloidosis.
Wen et al. from the Beijing Anzhen Hospital/Capital Medical University (China) and the Vienna General Hospital (Austria) reported on “Comparative analysis of multimodality cardiac imaging for prediction of postoperative myocardial infarction” [1665]. These researchers aimed to validate and compare the value of coronary microcalcification, macrocalcification, stenosis, and serum inflammatory biomarkers in postoperative MI prediction. The prospective study included 75 patients with CAD scheduled for coronary artery bypass graft procedures. Patients underwent cardiac 18F-NaF PET imaging, coronary artery calcium scoring, coronary angiography, and plaque analysis. Figure 6 shows multimodality cardiac imaging in CAD patients with (top block) and without (bottom block) postoperative MI. On the left are patient images showing intense 18F-NaF activity in the coronary arteries and calcified plaque, with corresponding angiography showing obstructive coronary disease. Pathology data indicated microcalcification and macrocalcification regions corresponding to areas of high and low inflammation on immunostaining. In contrast example patient images without postoperative MI showed no significant 18F-NaF uptake at the proximal LAD on PET/CT, stenosis of the proximal LAD with coronary stent on coronary angiography, and intense calcium density at the corresponding lesion site on CT. Pathology, however, showed no significant macrophage infiltration in excised coronary atherosclerotic plaques. This study showed that coronary microcalcification activity was substantially higher in patients who developed postoperative MI, whereas calcium score and baseline coronary stenosis level (SYNTAX score) did not differ between the groups. They also found increased inflammatory infiltration and CD68 expression in plaques showing 18F-NaF uptake. High-risk plaques quantified by 18F-NaF PET had significantly higher target-to-background ratios (TBRs) compared to low- and medium-risk plaques, and a lesional TBR ≥1.30 had a high diagnostic accuracy for detecting such high-risk plaques and thereby detecting patients likely to develop postoperative MI.

Multimodality cardiac imaging for prediction of postoperative myocardial infarction (MI) in example cardiac artery disease patients with (top block) and without (bottom block) postoperative MI. Top block shows: (A) Elevated 18F-NaF uptake on PET at left main (LM) (white dotted arrow) and left anterior descending (LAD) (white solid arrow) arteries on fused PET/CT images. (B) Intense calcium density of LM (white dotted arrow) and LAD proximal stenosis (white solid arrow) on CT. (C) Stenosis at the corresponding lesion site on coronary angiography. (D) Histology and immunohistochemistry of the excised coronary atherosclerotic plaque (inflamed lesion). (E) H&E pathology staining. (F) CD68 immunostaining, with strong expression indicating significant macrophage infiltration in corresponding excised coronary atherosclerotic plaque. Microcalcification (black dotted arrow) and macrocalcification (black solid arrow) regions on H&E corresponded to high (black dotted arrow) and low (black solid arrow) inflammation on immunostaining, respectively. Bottom block shows: (A) Elevated 18F-NaF uptake at proximal LAD (white-solid arrow) on fused PET/CT images. (C) Stenosis of proximal LAD with coronary stent (white solid arrow) on coronary angiography and (B) intense calcium density at the corresponding lesion site on CT. (D) Histology and immunohistochemistry of excised coronary atherosclerotic plaque (noninflamed lesion). (E) H&E pathology staining. (F) CD68 immunostaining indicated no significant macrophage infiltration in corresponding excised coronary atherosclerotic plaque.
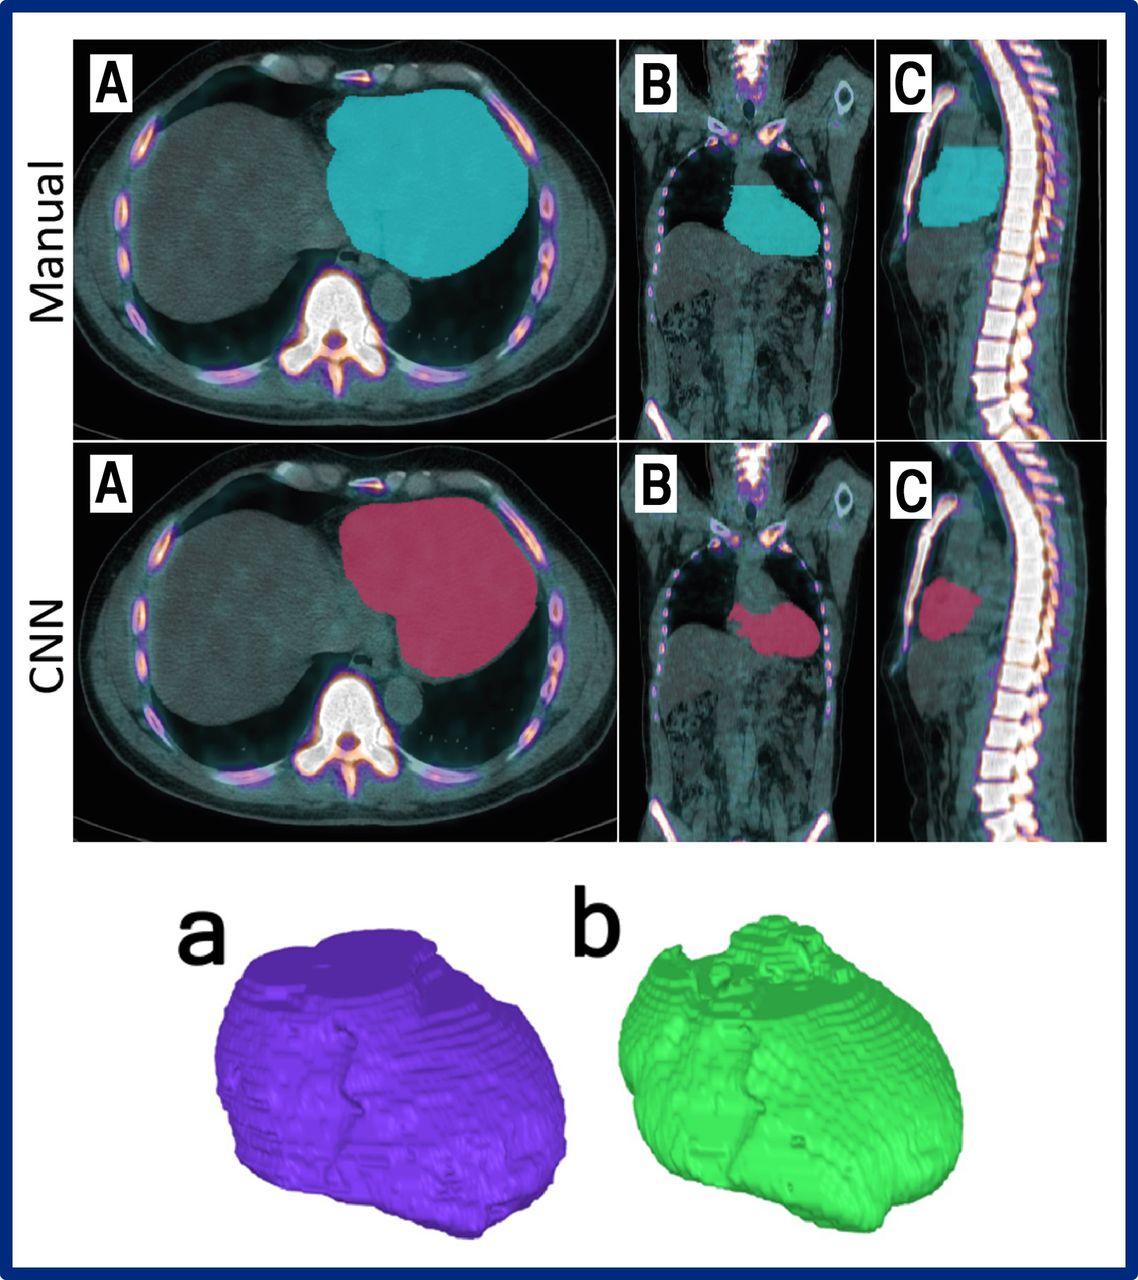
On a related topic, Skovrup et al. from Odense University Hospital (Denmark), University of Southern Denmark (Odense), Sahlgrenska Academy/University of Gothenburg (Sweden), Eigenvision AB (Malmo, Sweden), and Chalmers University of Technology (Gothenburg, Sweden) reported on “Global cardiac atherosclerotic burden assessed by fast automated artificial intelligence (AI)–based heart segmentation in 18F-sodium fluoride PET/CT scans: Head-to-head comparison with manual segmentation” [29]. Heart segmentation in the study was based on a convolutional neural network (CNN) used in 18F-NaF PET/CT scans of 29 healthy control subjects and 20 patients with angina pectoris, compared with data obtained by manual segmentation in the same scans. The researchers found that the automated method was much faster than the manual method (averages of 1 and 30 minutes, respectively). The CNN method provided values for segmented volume and SUVtotal that were about 20% lower than manually obtained values, whereas SUVmean and SUVmax values were comparable. The important point here is that we can use technology now to estimate in an unbiased fashion the total amount of atherosclerotic burden in these patients. Figure 7 includes examples of 3D reconstruction with both the manual and automatic methods. Automatic methods for estimating the burden of atherosclerosis add to the growing body of literature on machine learning for diagnosis, quantitation, and risk assessment in evaluation of heart disease.

Global cardiac atherosclerotic burden assessed by fast automated artificial intelligence (AI)–based heart segmentation in 18F-NaF PET/CT scans. Top block: Axial (a), coronal (b), and sagittal (c) reconstruction of manual (top row) and convolutional neural network (CNN)–based (bottom row) heart segmentation in the same patient. Bottom block: 3D reconstruction of manual (left) and CNN-based (right) segmentation of the heart. The automated method was much faster than the manual method (averages of 1 and 30 minutes, respectively). The CNN method provided values for segmented volume and SUVtotal that were about 20% lower than manually obtained values, whereas SUVmean and SUVmax values were comparable.
The next 2 presentations are on a similar theme. Singh et al. from Cedars-Sinai Medical Center (Los Angeles, CA), University of Calgary (Canada), Assuta Medical Centers (Tel Aviv, Israel), Ben Gurion University of the Negev (Beer Sheba, Israel), Columbia University Irving Medical Center/New York Presbyterian Hospital (New York, NY), Oregon Heart and Vascular Institute/Sacred Heart Medical Center (Springfield, OR), University of Ottawa Heart Institute (Canada), University Hospital Zurich (Switzerland), Yale University School of Medicine (New Haven, CT), Cardiovascular Imaging Technologies LLC (Kansas City, MO), and Brigham and Women’s Hospital (Boston, MA) reported on “Improved risk assessment of myocardial SPECT using explainable deep learning: Report from the REFINE SPECT registry” [50]. In this large study of 20,401 patients undergoing SPECT MPI, the authors reported on development and evaluation of a novel deep-learning network for prediction of major adverse cardiac events (MACE). The deep-learning network was developed with polar map image inputs of raw perfusion and gated derived maps of motion, thickening, phase angle, and amplitude combined with age, sex, and end-systolic and -diastolic volumes. A novel part of this approach is the use of deep-learning attention maps, highlighting regions associated with MACE risk as an overlay on polar map images (Fig. 8). These maps can be generated in less than 1 second to explain results to summarize results for physicians. The authors showed that their deep learning approach was a significantly better predictor of MACE than stress and ischemic total perfusion defect assessment. The authors concluded that the use of a deep-learning network allows for prediction of MACE directly from polar map images with improved accuracy compared to automatic quantitation of perfusion.
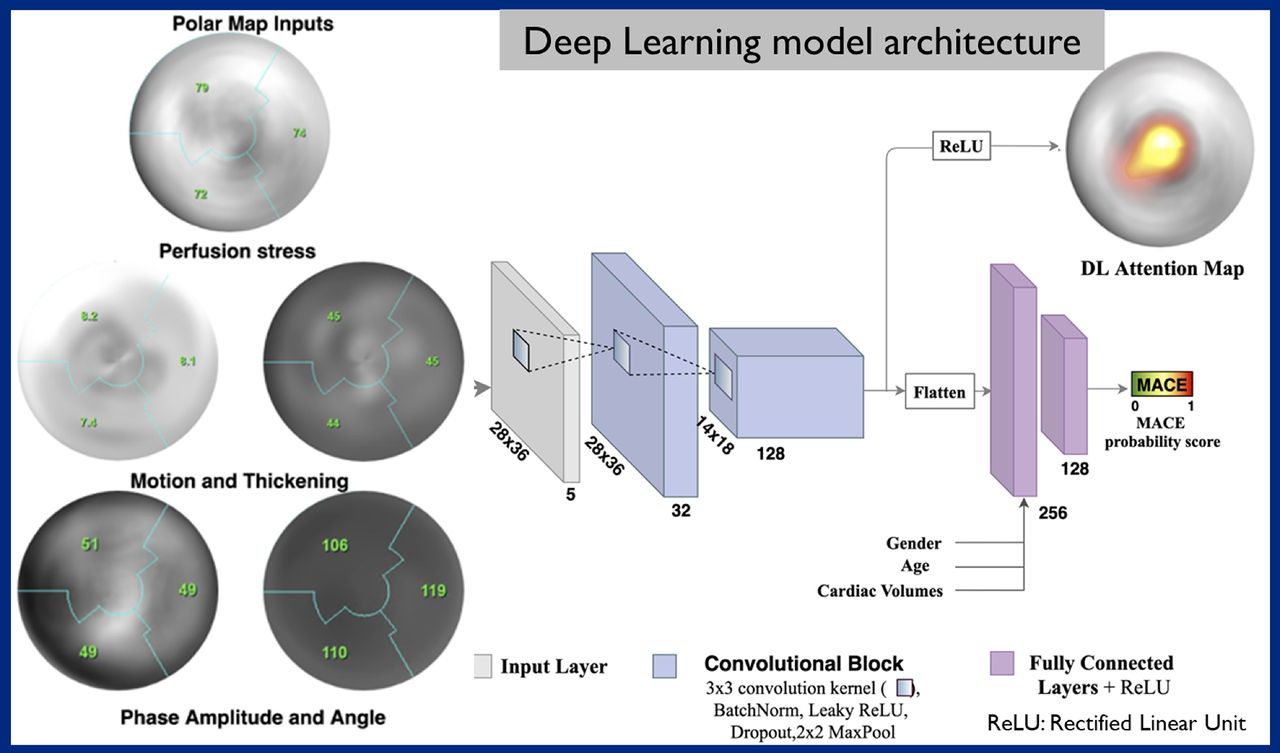
Improved risk assessment of myocardial SPECT using a novel deep-learning network for prediction of major adverse cardiac events (MACE). From multiple data sources, deep-learning attention maps were generated, highlighting regions associated with MACE risk as an overlay on polar map images. The deep learning approach was a significantly better predictor of MACE than stress and ischemic total perfusion defect assessment. This image summarizes the model architecture, with the resulting deep-learning attention map at upper right.
Authors from the same group extended this approach to 82Rb PET perfusion imaging with similar results. Singh et al. from Cedars-Sinai Medical Center (Los Angeles, CA) and the University of Calgary (Canada) reported on “Explainable prediction of all-cause mortality from myocardial PET flow and perfusion images using deep learning” [28]. Here their goal was to develop and evaluate a novel explainable deep-learning network for prediction of all-cause mortality directly from PET MPI flow and perfusion polar map image data. The study included 3,206 patients referred for regadenoson (91%) and adenosine (9%) stress and rest 82Rb PET. The deep learning approach was trained using stress and rest polar map image data of raw perfusion, myocardial blood flow, spill-over fraction, and myocardial flow rate combined with end-systolic and -diastolic volumes, age, and sex. Over a mean follow-up of 4.7 years, 654 patients died. Again, the deep learning model had a much better accuracy for predicting all-cause mortality. Survival curves presented by the authors emphasized the potential value of deep learning in prediction of adverse outcomes. Deep-learning attention maps generated from these results showed again the value of rapid aggregation of individual patient data for physician assessment. These presentations are very important, because the field of machine learning and AI is rapidly growing not only in cardiac imaging but in all of medicine. Quantitation is one of the biggest assets of nuclear cardiology, and we hope that studies such as this will advance further risk estimation using PET and SPECT MPI.
Thank you all for your attention. Although I was able to highlight only a few of the many cardiovascular research papers presented at this meeting, I urge you to look at the entire meeting available online to see the full spectrum of outstanding research. I want to end by congratulating Omar Mahmood, MD, PhD, and the entire SNMMI Scientific Program Committee for a fantastic meeting and for inviting me to present these highlights.
- © 2022 by the Society of Nuclear Medicine and Molecular Imaging.
In this issue


Jump to section
Related Articles
Cited By...
- No citing articles found.