


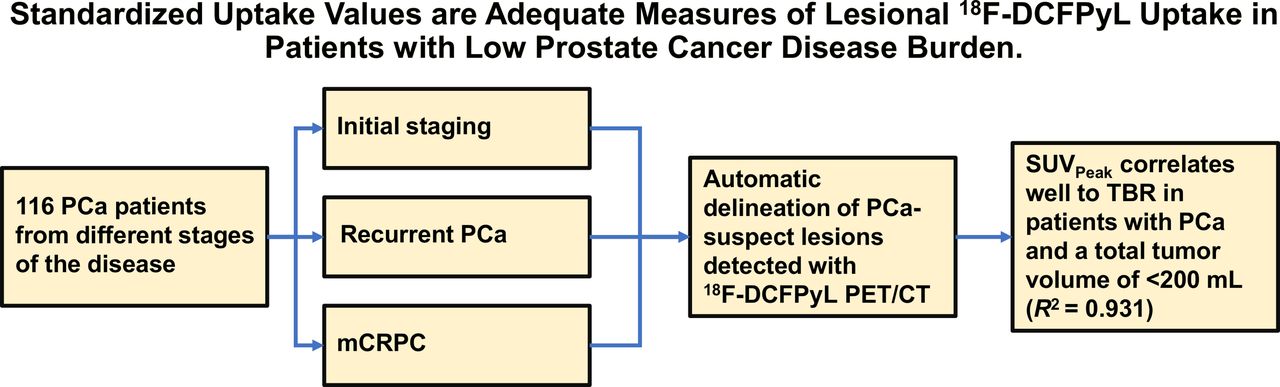
Visual Abstract
Abstract
In prostate cancer (PCa) patients, the tumor-to-blood ratio (TBR) has been validated as the preferred simplified method for lesional 18F-DCFPyL (a radiolabeled prostate-specific membrane antigen ligand) uptake quantification on PET. In contrast to SUVs, the TBR accounts for variability in arterial input functions caused by differences in total tumor burden between patients (the sink effect). However, TBR depends strongly on tracer uptake interval and has worse repeatability and is less applicable in clinical practice than SUVs. We investigated whether SUV could provide adequate quantification of 18F-DCFPyL uptake on PET/CT in a patient cohort with low PCa burden. Methods: In total, 116 patients with PCa undergoing 18F-DCFPyL PET/CT imaging were retrospectively included. All 18F-DCFPyL–avid lesions suspected of being PCa were semiautomatically delineated. SUVpeak was plotted against TBR for the most intense lesion of each patient. The correlation of SUVpeak and TBR was evaluated using linear regression and was stratified for patients undergoing PET/CT for primary staging, patients undergoing restaging at biochemical recurrence, and patients with metastatic castration-resistant PCa. Moreover, the correlation was evaluated as a function of tracer uptake time, prostate-specific antigen level, and PET-positive tumor volume. Results: In total, 436 lesions were delineated (median, 1 per patient; range, 1–66). SUVpeak correlated well with TBR in patients with PCa and a total tumor volume of less than 200 cm3 (R2 = 0.931). The correlation between SUV and TBR was not affected by disease setting, prostate-specific antigen level, or tumor volume. SUVpeak depended less on tracer uptake time than did TBR. Conclusion: For 18F-DCFPyL PET/CT, SUVpeak correlates strongly with TBR. Therefore, it is a valuable simplified, semiquantitative measurement in patients with low-volume PCa (<200 cm3). SUVpeak can therefore be applied in 18F-DCFPyL PET assessment as an imaging biomarker to characterize tumors and to monitor treatment outcomes.
Prostate cancer (PCa) is the second most prevalent type of cancer in men worldwide (1). Conventional imaging studies such as CT, bone scintigraphy, and MRI have moderate sensitivity for the detection of PCa metastases (2,3). The recent prostate-specific membrane antigen (PSMA) PET/CT scans are showing more promising results in detecting metastases and in primary staging but especially in the recurrent stage of the disease (4,5). In addition, PSMA tracers are most commonly labeled with 68Ga (i.e., 68Ga-PSMA-11) or 18F (18F-DCFPyL or 18F-PSMA-1007) (6).
Recent studies demonstrated a benefit from using semiquantitative measures of radiolabeled PSMA ligand uptake on PET for prognostication, as an imaging biomarker to characterize tumors and monitor treatment outcomes (7,8). A requisite for reliable clinical use of semiquantitative PET uptake parameters is that they correlate with the underlying tracer kinetics in vivo (9). For 18F-DCFPyL uptake, our group recently validated the tumor-to-blood ratio (TBR) as the preferred simplified method, demonstrating a strong correlation with the reference pharmacokinetic parameter based on Patlak analyses (10,11). We observed that for 18F-DCFPyL, high tumor volumes (1,000–2,000 cm3) had an effect on the tracer plasma input functions. This effect renders SUV invalid for such patients, as it assumes that plasma input functions between patients are similar. In contrast to SUV, using TBR can correct for differences in plasma input functions between patients. Unfortunately, TBR poses some disadvantages (Table 1), as it depends more on uptake interval, has worse repeatability, and is more labor-intensive than SUV (12–14).
Advantages and Disadvantages of SUV vs. TBR
The extraordinarily high tumor volumes that affected 18F-DCFPyL kinetics in previous studies are relatively rare and seen only in end-stage disease (15,16). Even in patients with metastasized castration-resistant PCa (mCRPC), only 6.2% have a tumor volume of 500 cm3 or higher (17). In clinical practice, most patients with PCa who undergo PSMA PET/CT scan in both the primary-PCa and the recurrent-PCa setting have relatively low-volume disease (18–20). We hypothesized that SUV might be a valid alternative to TBR for lesional 18F-DCFPyL quantification in most PCa patients with a low disease burden, defined as 200 cm3 or less. The aim of this study was to validate SUV against TBR in PCa patients with commonly seen low tumor burdens and potentially define a tumor volume threshold below which SUV remains a valid parameter for 18F-DCFPyL uptake quantification. Second, we illustrated the influence of uptake interval on SUV versus TBR based on the hypothesis that SUV will be less dependent than TBR on uptake intervals.
MATERIALS AND METHODS
Patients
A retrospective analysis was performed on 124 patients with histologically proven PCa treated at the Amsterdam University Medical Centers (location VUmc) [Vrije Universiteit Medical center]). As an inclusion criterion, all patients who underwent a 18F-DCFPyL PET/CT scan within variable stages of disease were eligible. We performed a secondary analysis of data pooled from 4 studies conducted from November 2017 and August 2019 that encompassed patients with primary PCa, recurrent PCa, and mCRPC (5,14,16,21). All 4 studies were approved by the local medical ethical committee (review numbers 2017.543 and 2017.565 [combined for 2 studies] and 2018.453). The main analysis included 116 patients, with 81 patients receiving a 18F-DCFPyL PET/CT scan for primary PCa, 25 patients having a 18F-DCFPyL PET/CT scan in the recurrent setting, and 10 patients with mCRPC. The 81 patients who received a 18F-DCFPyL PET/CT scan in the primary-staging setting were patients who underwent 18F-DCFPyL PET/CT before surgery, so it is assumed that these patients had low-volume disease. Additionally, dynamic PET acquisitions from 8 patients with end-stage, metastasized CRPC were available and used for time-dependent analyses. All subjects gave written informed consent when enrolling in the original studies, which were approved by the institutional review board of VUmc, explicitly allowing (by both the patients and the review board) secondary analysis of their study data.
Image Acquisition
18F-DCFPyL was synthesized under good-manufacturing-practice conditions at the on-site cyclotron (22,23). Images were acquired using an Ingenuity TF PET/CT system (Philips Healthcare). The scan trajectory included mid thigh to skull base (static scans), with 4 min per bed position. All PET scans were combined with a low-dose or high-dose CT scan without intravenous contrast medium (30–110 mAs, 110–130 kV). Images were corrected for decay, scatter, random coincidences, and photon attenuation. Images were reconstructed with a binary-large-object–based ordered-subsets expectation maximization algorithm (3 iterations; 33 subsets).
Scan Assessment
The PET/CT scans of the primary cohort of 116 patients were analyzed, and all tumor deposits were delineated according to the available clinical reports. All local tumors, lymph node metastases, and bone or visceral metastases were delineated individually as a volume of interest. An automatically generated SUVpeak isocontour of 50% with correction for background uptake was used to create the volume of interest in the tissues suspected of malignancy (24). Per volume of interest, tumor volume (in cm3) and SUVpeak were calculated. SUVpeak was chosen because it is less variable and has less inherent intrapatient bias than SUVmax and does not require exact tumor borders as compared with SUVmean (25,26). Per patient, total tumor volume (TTV) and total lesion uptake were calculated. TTV was defined as the sum of the delineated tumor volumes within 1 patient, and total lesion uptake was defined as the lesional mean uptake multiplied by the lesion volume, as a percentage of injected dose. Additionally, a 3 × 3 volume of interest was placed in the ascending aorta on 5 consecutive slices of the CT scan (27), yielding the blood-pool activity used for the calculation of TBR. TBR was determined by dividing the SUVpeak of the lesions by the SUVpeak of the aortic blood pool. Delineation was performed using the in-house–developed ACCURATE tool (28).
Effect of Uptake Interval on SUV Versus TBR
In a subanalysis, 8 patients with mCRPC who were dynamically scanned with 18F-DCFPyL PET/CT were reinvestigated to define their correlation of SUVpeak versus TBR over time (16). These patients received a low-dose CT scan (30 mAs, 120 kV) followed by a dynamic PET scan from 0 to 120 min after injection of 18F-DCFPyL (median dose, 313 MBq; range, 292–314 MBq), with a 30-min break in acquisitions, for patient comfort, 60 min after the first dynamic scan. Similarly to the scans of the main cohort, data were corrected for decay, dead time, scatter, and random coincidences; photon-attenuation correction was performed using the low-dose CT scans. Patient demographic data can be found in the primary publication (16).
Statistical Analysis
Numeric variables were summarized with medians and interquartile ranges; categoric variables were summarized with proportions and percentages. Data were assessed for normality using histograms. The most intense lesion with the highest SUVpeak within each patient was compared with the corresponding TBR by linear regression analysis (R2) using the Pearson correlation coefficient and the Spearman rank correlation coefficient. To assess whether uptake time (time from injection to scan start) affected the correlation between SUV and TBR, 3 uptake-interval groups were identified: less than 110 min, 110–130 min, and more than 130 min. The significance level was set at a P value of less than 0.05. Statistical analysis was performed using SPSS Statistics (version 26; IBM) for Windows (Microsoft) and Prism (version 8.0.0; GraphPad Software) for Windows.
RESULTS
Patient Characteristics
In total, 116 patients were included in the main analysis of this study. Patients had a median age of 68.0 y (range, 49.0–84.0 y). The 18F-DCFPyL PET/CT scans from 81 primary-PCa patients, 25 recurrent-PCa patients, and 10 patients with mCRPC were analyzed. Therapy before 18F-DCFPyL PET/CT was given to 35 of 116 (30.1%) patients: in the recurrent-PCa group, 14 of 25 (56.0%) patients received radical prostatectomy, 3 of 25 (12.0%) received androgen deprivation therapy combined with chemotherapy, and 8 of 25 (28.0%) received radiotherapy. In the mCRPC group, 7 of 10 (70.0%) patients received androgen deprivation therapy alone, 3 of 10 (30.0%) received androgen deprivation therapy and chemotherapy, and in 1 patient prior therapy was unknown. Further details of the study population are provided in Table 2. Demographics per disease setting are presented in Supplemental Table 1 (supplemental materials are available at http://jnm.snmjournals.org).
Baseline Patient Characteristics
PET Imaging Results
The median uptake time was 120.2 min (range, 103.1–163.7 min), with a median injected dose of 314.0 MBq (range, 250.4–330.9 MBq). In total, 436 lesions were delineated (median, 1 per patient; range, 1–66). Sixty-nine of 116 (59.4%) patients had a total of 1 lesion, 35 of 116 (30.1%) had 2–5 lesions, and 11 of 116 (9.4%) had more than 5 lesions. Of the 436 lesions, 105 (24.1%) were intraprostatic, 189 (43.3%) bone, 141 (32.3%) lymph node, and 1 (0.2%) pulmonary. Median TTV was 8.1 cm3 (range, 1.4–79.2 cm3), 24.4 cm3 (range, 2.9–173.4 cm3), and 21.5 cm3 (range, 5.4–473.1 cm3), respectively, for the primary-disease, recurrent-PCa and mCRPC groups. Characteristics stratified per disease setting are detailed in Table 3.
Baseline Scan Characteristics
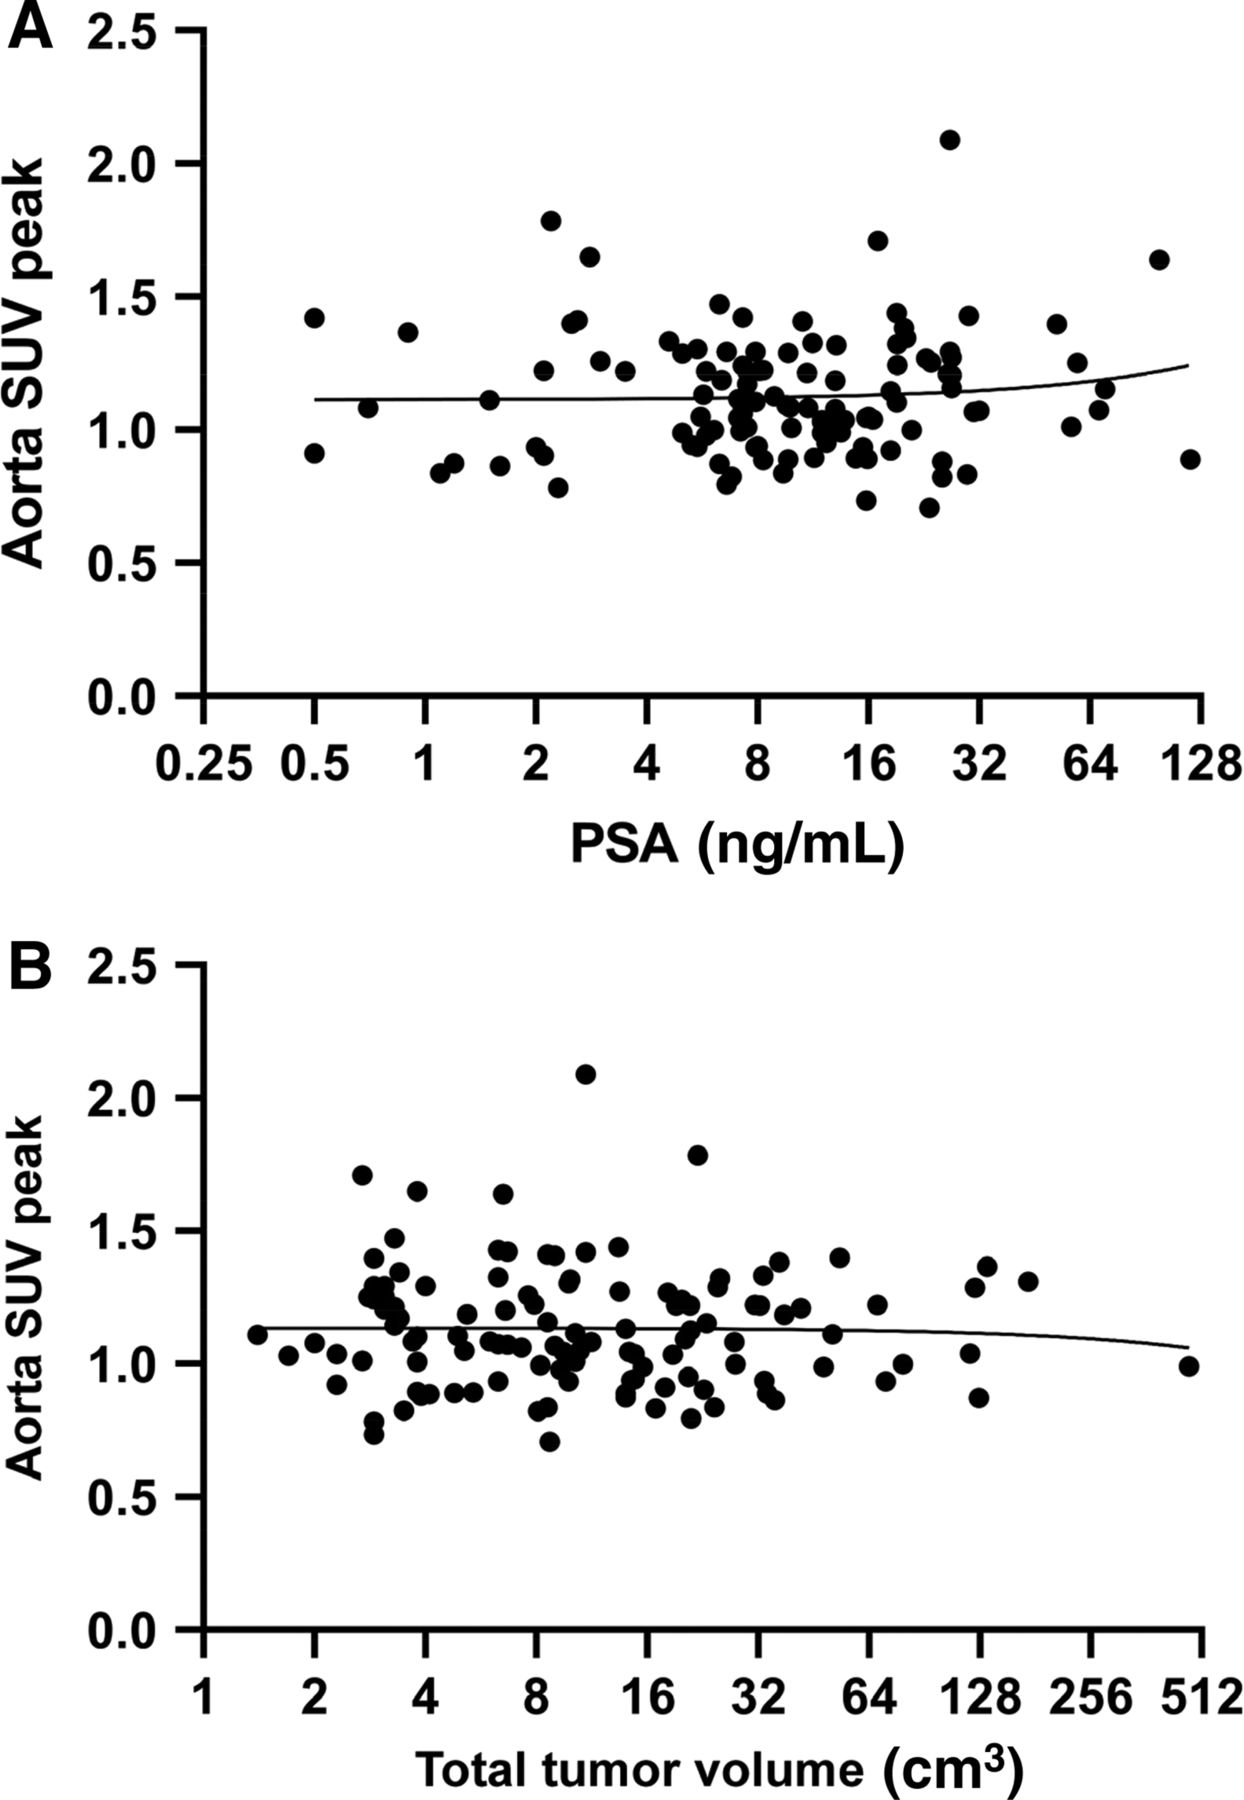
Aortic SUVpeak as Function of TTV and PSA
On a patient level, there was no correlation between the blood-pool (aorta) SUVpeak and the TTV (R2 = 0.001). The blood-pool SUVpeak remained stable around increasing TTVs (Fig. 1A). Similarly, no correlation was noted between blood-pool SUVpeak and serum PSA (as a potential surrogate marker for disease load) at the time of the scan (R2 = 0.007; Fig. 1B).

(A) Linear regression of aortic SUVpeak vs. PSA with exclusion of the PSA outlier on log2-scaled x-axis. Slightly positive slope of 0.001 is visible, with R2 = 0.007. With aortic SUVpeak of 0.994, outlier with PSA of 2,790.0 ng/mL did not alter results and was therefore excluded from graph. (B) Linear regression of aortic SUVpeak vs. TTV on log2-scaled x-axis. Both R2 and correlation coefficient r were highly insignificant (R2 = 0.001; r = 0.038).
Correlative Analysis Between SUVpeak and TBR
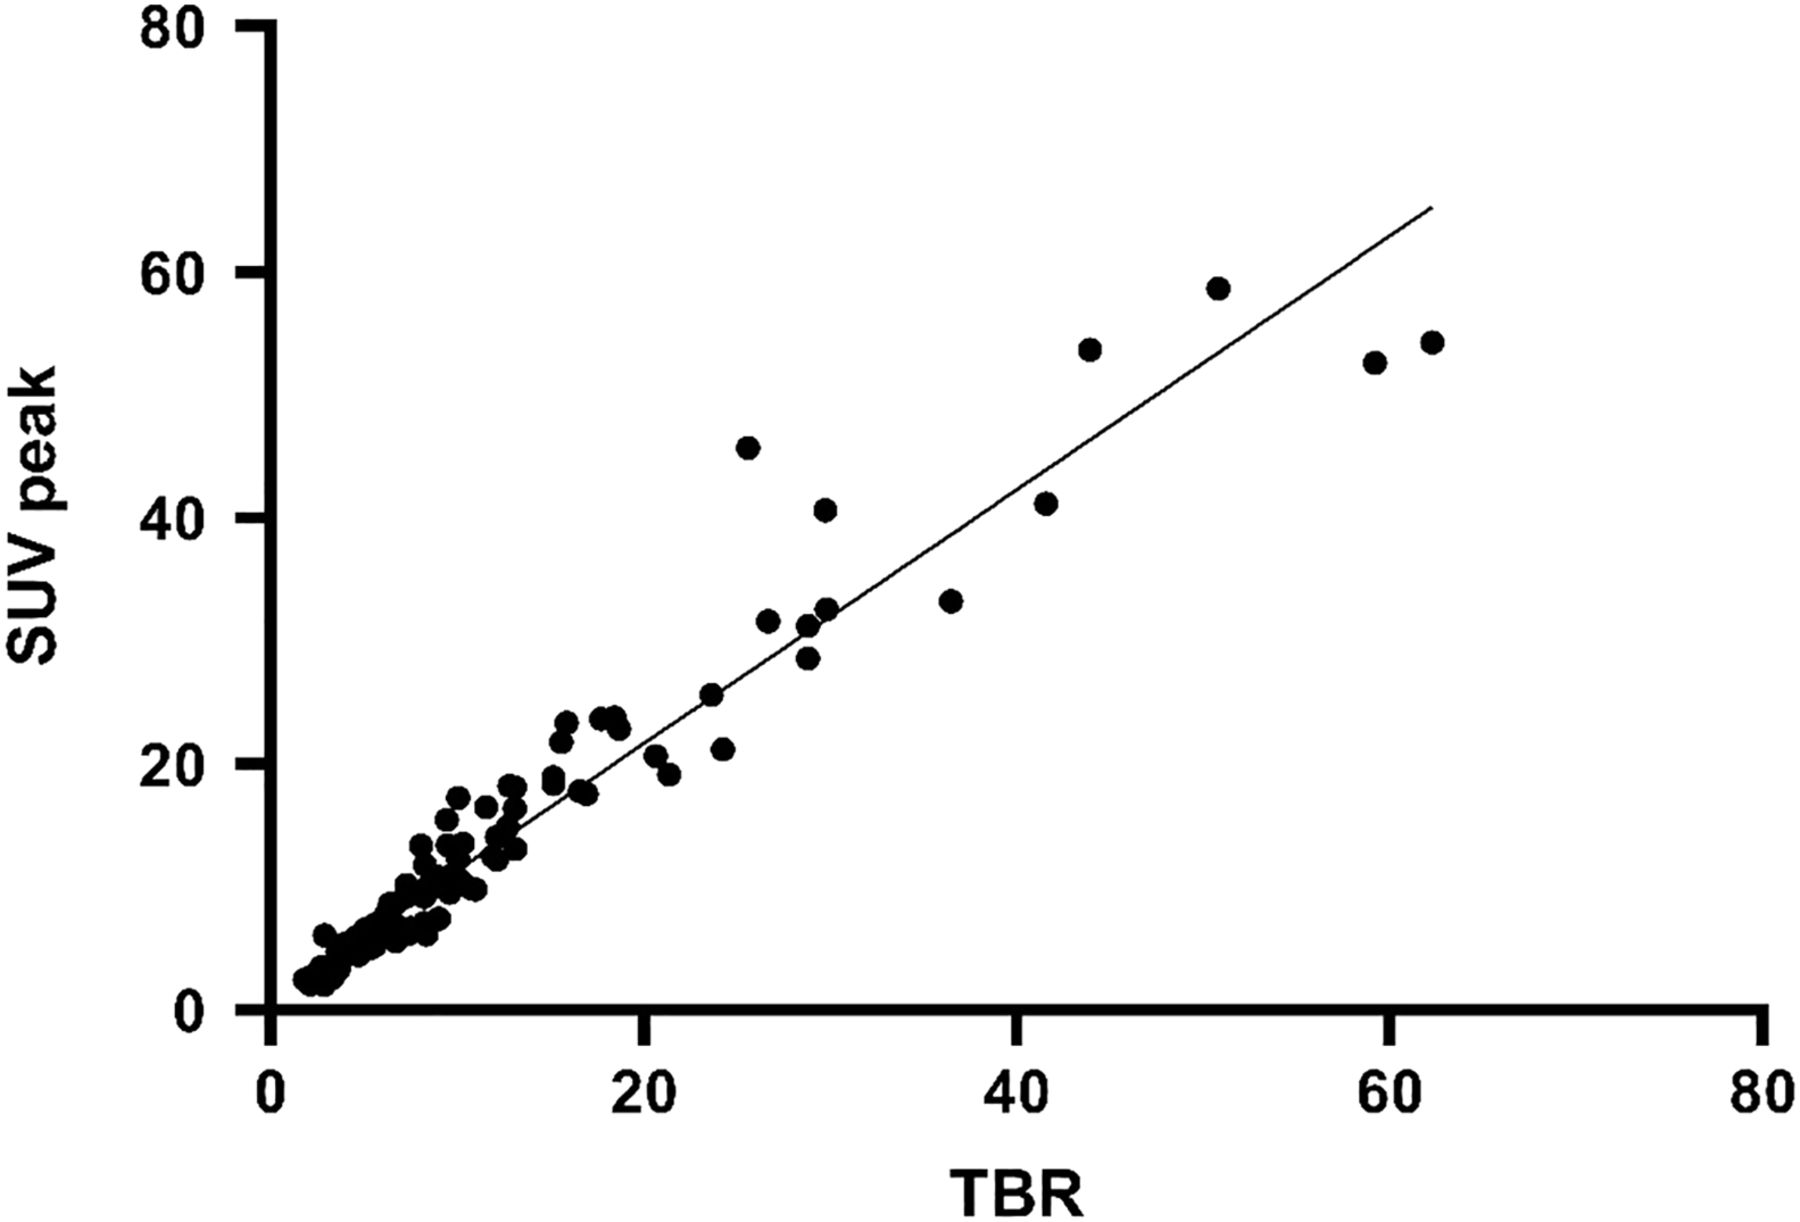
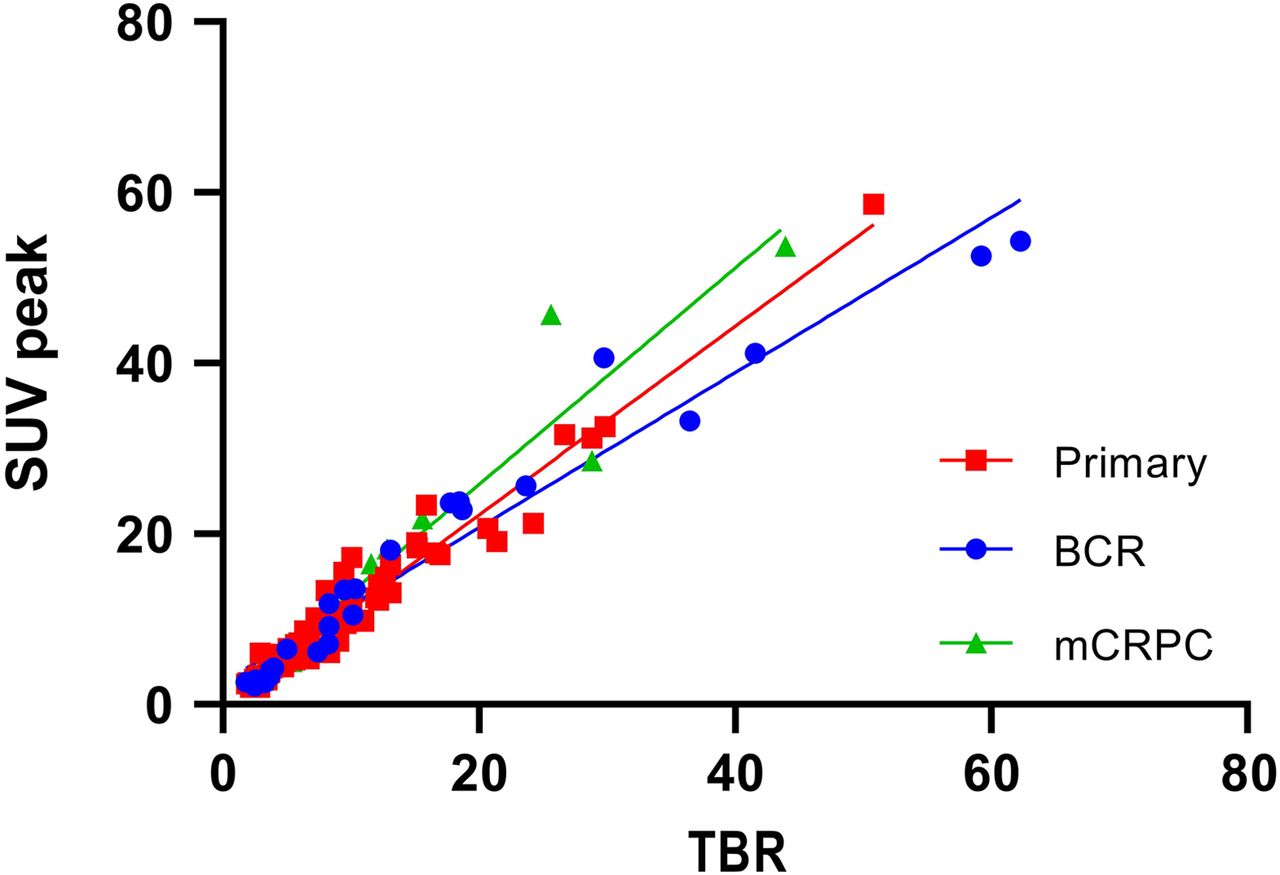
Overall, SUVpeak correlated with TBR with an R2 of 0.931 (most intense lesion per patient, all patients included; Fig. 2). When plotted separately, SUVpeak still correlated with TBR, with an R2 of 0.950, 0.902, and 0.957, respectively, for the primary, recurrent, and mCRPC groups (Fig. 3). Linear regression slopes were 1.10, 0.90, and 1.26, respectively, for the primary, recurrent, and mCRPC groups. PSA versus SUVpeak (most intense lesion) and PSA versus TBR per patient did not correlate (r = 0.13, P = 0.18, and r = 0.14, P = 0.13, respectively).

Linear regression of maximal SUVpeak vs. TBR for most intense lesion suspected of being PCa on 18F-DCFPyL PET/CT in 114 patients. R2 measured 0.931, and slope of regression was 1.032.

Linear regression of SUVpeak vs. TBR for most intense lesion suspected of being PCa on 18F-DCFPyL PET/CT, with stratification for different groups: primary PCa, biochemically recurrent PCa (BCR), and mCRPC. This plot emphasizes high correlation for primary-PCa group (R2 = 0.957) and recurrent-PCa group (R2 = 0.950) and somewhat lower correlation for mCRPC group (R2 = 0.902), as individuals.
SUVpeak Versus TBR over Injection Time
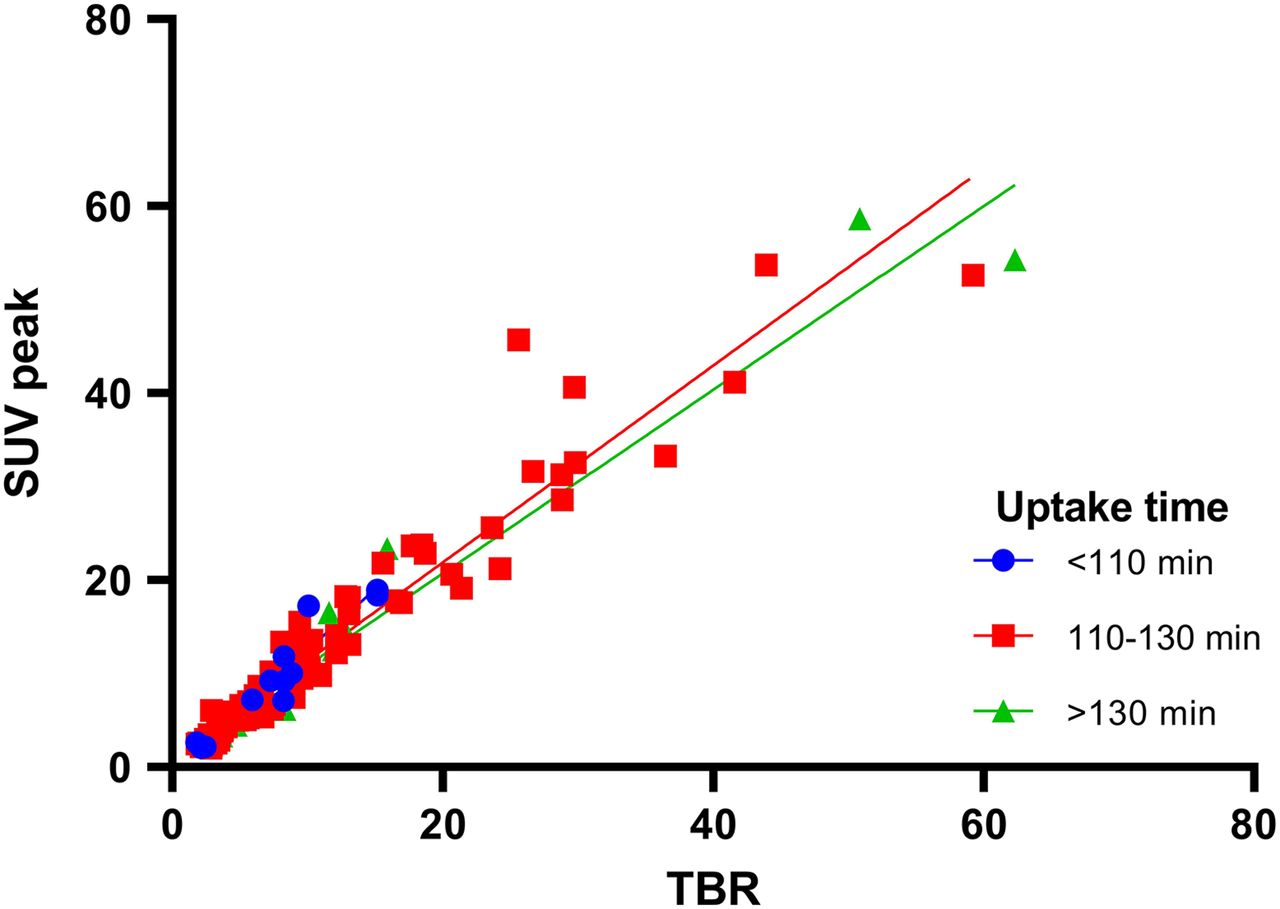
Three patient groups were generated to stratify postinjection scan time in minutes, with the first group being less than 110 min, the second 110–130 min, and the third more than 130 min after radiotracer injection. Figure 4 shows the linear regression analysis; all 3 groups showed a strong correlation on Spearman testing, with an R2 of 0.907, 0.925, and 0.955 for the first, second, and third groups, respectively. The slopes of these groups were 1.299, 1.053, and 0.9823, respectively. For the subanalysis of 8 mCRPC patients who received a dynamic scan spanning 120 min, Figure 5 shows the development of SUVpeak versus TBR over time. In these 8 patients, the SUVpeak of the maximally intense lesion showed a stable development after 20 min, whereas TBR showed a gradual increase until 120 min.

Linear regression of SUVpeak vs. TBR for most intense lesion suspected of being PCa on 18F-DCFPyL PET/CT, stratified for injection time. R2 in ascending order for uptake time was 0.907, 0.925, and 0.955.

Development of mean and range for SUVpeak and TBR for most intense lesions as function of uptake interval in 8 mCRPC patients. SUV and TBR are presented as percentage of maximum value measured per respective patient.
DISCUSSION
In this study, we assessed the use of SUVpeak as a simplified method for quantification of tumor PSMA expression on 18F-DCFPyL PSMA PET/CT scans in a combined cohort of PCa patients from primary-staging, recurrent-PCa, and mCRPC settings. A high correlation between SUVpeak and TBR was found for each group in the cohort, as well as a high correlation between SUV and TBR in the pooled data. The correlation between SUVpeak and TBR in the present study thus implicates SUVpeak as a suitable, simplified method to quantify 18F-DCFPyL PSMA PET/CT in patients with a TTV below 200 cm3, based on the earlier findings that TBR correlates with parameters from full kinetic modeling (16).
When the patient cohort was stratified for tracer uptake time, all subgroups showed a correlation between SUVpeak and TBR. Nonetheless, intergroup evaluation showed more favorable slopes (i.e., a slope closest to 1) for uptake times above 110 min. This finding is in line with that of Wondergem et al., who found that a scan time of 120 min was optimal for visualizing an increased number of lesions (29). The weaker correlation for the lower uptake times can be explained by the results from our subanalysis of 8 additional mCRPC patients, which showed that SUVpeak increased rapidly after injection and stabilized earlier than TBR. When one is visually interpreting the curve in Figure 5, SUVpeak seems to be less dependent on uptake interval. In addition, SUVpeak has better repeatability than TBR, especially in lesions with a small volume (defined as <4.2 cm3), as reported by Jansen et al. (14). Therefore, SUVpeak may be a more suitable measure for clinical practice than TBR, given the heterogeneity of scan protocols across hospitals. Nevertheless, TBR stands as a reliable method of semiquantification for the whole spectrum of TTVs, but only when adhering to strict uptake timing protocols (16).
The sink effect, as described by Jansen et al. and Gaertner et al. (16,30), was observed only in mCRPC patients with extreme TTVs ranging up to 1,000 or 2,000 cm3 scanned in a research setting. Following the sink effect hypothesis, the aortic SUVpeak is expected to decrease with increasing tumor load (TTV), as was observed in the aforementioned studies. In another study, from Werner et al., conducted on patients with lower PCa TTVs (median, 4.8 cm3; range, 0.3–98.4 cm3), the absence of a sink effect was noted after analyzing 50 18F-DCFPyL PET/CT scans (20). Like our study, this cohort included a variety of indications to perform a PSMA PET/CT scan, but no patient presented with a TTV higher than 100 cm3. As in the study by Werner et al., a clear cutoff for a sink effect was not established in the present paper, since no measurable effect on 18F-DCFPyL input functions was noticed (Fig. 1B), possibly because only 1 patient with a high TTV (>200 cm3) was included. Still, a very small slope was observed in both linear regressions. In particular, the trend observed in aortic SUVpeak versus TTV may implicate a minor sink effect in larger PCa metastatic volumes caused by increased TTVs that decrease blood-pool activity, as described by Cysouw et al. (15). Since most included patients had either primary PCa or a lower TTV, the nonsignificant correlations can strengthen the argument that SUV is an applicable semiquantitative measure for most clinical PSMA scans. Still, the validity of TBR has previously been demonstrated (19).
This study carried the limitations inherent in a retrospective study, including a potential selection bias. We tried to overcome this selection bias by including a heterogeneous group of indications for 18F-DCFPyL PSMA PET/CT scans. Second, a pharmacokinetic study (with arterial and venous blood samples) should ideally be performed on the entire cohort to verify our results. Such a study would validate SUVpeak versus actual pharmacodynamics but would be very labor intensive for the number of patients we included.
Our findings imply that SUVpeak is a valid, simplified method to quantify 18F-DCFPyL PSMA PET/CT scans in patients with PCa and a TTV below 200 cm3. Unfortunately, a cutoff for the sink effect could not be identified because of the low number of patients with high TTVs. Therefore further research to find a sink effect is needed in patients with a broad range of TTVs, with at least a reasonable number of TTVs that have a volume above 200 cm3, possibly even above 500 cm3. Therefore, we recommend use of SUVpeak when tumor volumes are less than 200 cm3, as was proven accurate in this study. In current clinical practice, this TTV encompasses most patients receiving PSMA PET scans (14,19). Still, TBR remains a reliable, simplified quantification method in the full spectrum of TTVs, provided that injection-to-scan intervals are above 110 min.
CONCLUSION
For 18F-DCFPyL PET/CT, SUV is a valuable simplified, semiquantitative measurement in patients with low-volume PCa (<200 cm3) and correlates strongly with TBR. SUVpeak can therefore be potentially applied to improve the precision of 18F-DCFPyL PSMA PET/CT scans, as an imaging biomarker to characterize tumors and monitor treatment outcomes. Although the presence of a sink effect has been demonstrated for 18F-DCFPyL PET/CT previously, we could not identify the threshold TTV for this effect within our real-life clinical cohort.
DISCLOSURE
Ronald Boellaard received a grant from Philips Healthcare, outside the submitted work. No other potential conflict of interest relevant to this article was reported.
KEY POINTS
QUESTION: In clinical practice, do TBRs correlate with SUVs in quantitative evaluation of 18F-DCFPyL PET/CT for patients with a low PCa volume?
PERTINENT FINDINGS: In 18F-DCFPyL PET/CT, TBRs correlate strongly with SUVs. Therefore, TBR is a valuable simplified, semiquantitative measurement for patients with low-volume PCa (<200 cm3).
IMPLICATIONS FOR PATIENT CARE: TBRs and SUVs can be used as simplified methods for quantitative assessment of 18F-DCFPyL PET/CT, enabling reliable interpretation of PET/CT scans and use of tracer uptake as an imaging biomarker.
Acknowledgments
We gratefully acknowledge the patients for their participation in this study.
Footnotes
Published online January 28, 2021.
- © 2021 by the Society of Nuclear Medicine and Molecular Imaging.
REFERENCES
- Received for publication November 12, 2020.
- Accepted for publication January 3, 2021.
In this issue


Jump to section
Related Articles
Cited By...
- No citing articles found.