


Abstract
The aim of this study was to determine whether quantitative PET parameters on baseline 68Ga-DOTATATE PET/CT and interim PET (iPET) performed before the second cycle of therapy are predictive of the therapy response and progression-free survival (PFS). Methods: Ninety-one patients with well-differentiated neuroendocrine tumors (mean Ki-67 index, 8.3%) underwent 68Ga-DOTATATE PET/CT to determine suitability for peptide receptor radionuclide therapy as part of a prospective multicenter study. The mean follow-up was 12.2 mo. Of the 91 patients, 36 had iPET. The tumor metrics evaluated were marker lesion–based measures (mean SUVmax and ratio of the mean lesion SUVmax to the SUVmax in the liver or the SUVmax in the spleen), segmented 68Ga-DOTATATE tumor volumes (DTTVs), SUVmax and SUVmean obtained with the liver and spleen as thresholds, and heterogeneity parameters (coefficient of variation, kurtosis, and skewness). The Wilcoxon rank sum test was used for the association between continuous variables and the therapy response, as determined by the clinical response. Univariable and multivariable Cox proportional hazards models were used for the association with PFS. Results: There were 71 responders and 20 nonresponders. When marker lesions were used, higher mean SUVmax and ratio of the mean lesion SUVmax to the SUVmax in the liver were predictors of the therapy response (P = 0.018 and 0.024, respectively). For DTTV parameters, higher SUVmax and SUVmean obtained with the liver as a threshold and lower kurtosis were predictors of a favorable response (P = 0.025, 0.0055, and 0.031, respectively). The latter also correlated with a longer PFS. The iPET DTTV SUVmean obtained with the liver as a threshold and the ratio of mean SUVmax obtained from target lesions at iPET to baseline PET correlated with the therapy response (P = 0.024 and 0.048, respectively) but not PFS. From the multivariable analysis with adjustment for age, primary site, and Ki-67 index, the mean SUVmax (P = 0.019), ratio of the mean lesion SUVmax to the SUVmax in the liver (P = 0.018), ratio of the mean lesion SUVmax to the SUVmax in the spleen (P = 0.041), DTTV SUVmean obtained with the liver (P = 0.0052), and skewness (P = 0.048) remained significant predictors of PFS. Conclusion: The degree of somatostatin receptor expression and tumor heterogeneity, as represented by several metrics in our analysis, were predictive of the therapy response or PFS. Changes in these parameters after the first cycle of peptide receptor radionuclide therapy did not correlate with clinical outcomes.
Neuroendocrine tumors (NETs) are uncommon malignancies with a documented population incidence of 6 or 7 per 100,000 in 2012 (1). The most common primary tumor sites are gastroenteropancreatic, but they may arise in the lungs, adrenal glands, and pituitary gland, among other locations (2). Most NETs overexpress somatostatin receptors (SSTRs) on the cell surface, allowing for SSTR-based imaging with 68Ga-(DOTA)-peptide PET; in recent years, the latter technique has become the preferred imaging modality for diagnosis, staging, and selection of patients for peptide receptor radionuclide therapy (PRRT) (3).
Coupling β- or γ-emitting radionuclides (177Lu or 90Y) to somatostatin analogs allows radionuclide therapy for well-differentiated unresectable or metastatic tumors that are highly DOTA–somatostatin analog avid (4). Multiple studies, including a recent phase III randomized trial (NETTER-1), have shown favorable progression-free survival (PFS) and overall survival, with limited, acceptable side effects (5–11). In 1 of those studies, treatment of patients who had midgut NETs with 177Lu-DOTATATE and octreotide long-acting release resulted in longer PFS and overall survival than treatment with octreotide long-acting release alone (11).
In July 2016, a prospective, multicenter trial was launched in Ontario, Canada, to assess the outcome of patients who had progressive metastatic NETs treated with individualized dosimetry-guided 177Lu-DOTATATE therapy and who were provided access to PRRT with regulatory Health Canada oversight. A further aim of that trial was to evaluate the prognostic value of quantitative 68Ga-DOTATATE PET/CT performed for patient selection. The purpose of the present study was to determine whether semiquantitative, volumetric, and tumor heterogeneity parameters on baseline PET (bPET) and early interim PET (iPET) performed before a second cycle of therapy are predictive of the therapy response and PFS.
MATERIALS AND METHODS
Study Design
Patients included in this analysis were enrolled in a prospective, multicenter, single-arm institutional review board–approved study (NCT02743741). All patients signed a written informed consent form. Eligibility criteria included biopsy-proven NET, with no restriction on primary site of origin; Ki-67 index of less than or equal to 30%; and progressive disease before study enrollment. All patients underwent screening with 68Ga-DOTATATE PET/CT to confirm the adequate expression of SSTR type 2. In eligible patients, most tumor sites exhibited a high level of 68Ga-DOTATATE uptake (defined as a Krenning score of 3 or 4) (12,13). An optional iPET scan was performed before cycle 2 of 177Lu-DOTATATE therapy to explore its prognostic value for clinical outcomes. Associations between bPET or iPET parameters and the outcome measures (therapy response and PFS) were evaluated.
Study Procedure
68Ga-DOTATATE PET/CT Imaging Protocol
PET was performed on a Siemens mCT40 PET/CT scanner (Siemens Healthcare). Patients were positioned supine with arms outside the region of interest. Images were obtained from the top of the skull to the upper thighs. Iodinated oral contrast material was administered for bowel opacification; no intravenous iodinated contrast material was used. Overall, 5–9 bed positions were obtained, depending on patient height, with an acquisition time of 2–3 min per bed position. A mean dose of 131.8 (SD = 29.7) MBq (range, 54.5–205 MBq) of 68Ga-DOTATATE was administered, with a mean uptake time of 65.8 min (range, 50–93 min). CT parameters were 120 kV; 3.0 mm slice width, 2.0 mm collimation; 0.8 sec rotation time; 8.4 mm feed/rotation. A PET emission scan using time of flight with scatter correction was obtained covering the identical transverse field of view. PET parameters were as follows: image size: 2.6 pixels; slice: 3.27; and 5-mm full width at half maximum (FWHM) gaussian filter type. PET/CT images were reviewed on a dedicated nuclear medicine PACS system with fusion software (Mirada Medical). SUV measurements were obtained using a region of interest delineating selected tumor sites (Fig. 1).
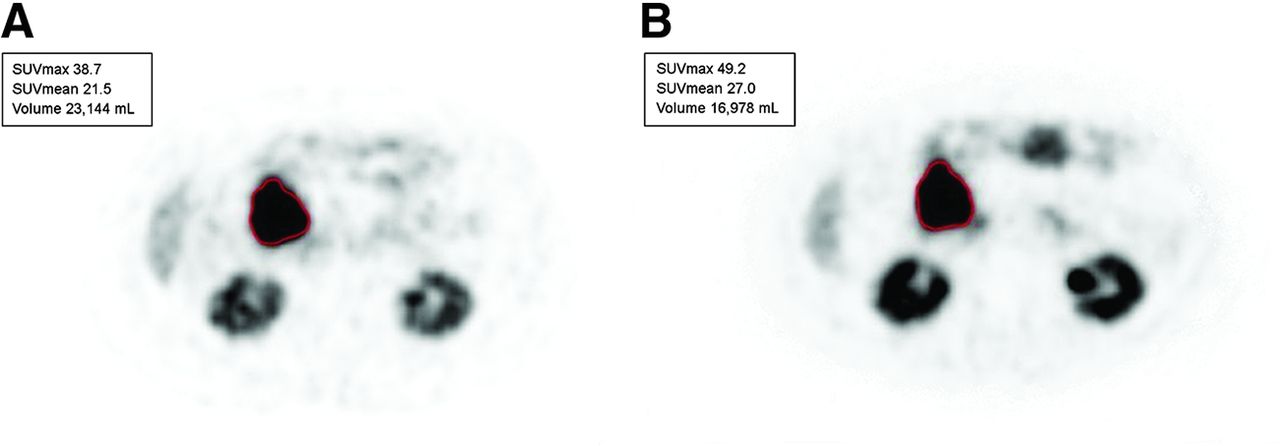
60-y-old woman with metastases of well-differentiated small bowel NET to liver and retroperitoneal lymph nodes (G1; Ki-67 index, 6%). Lesion-based assessment was done with bPET and iPET before cycle 2 of 177Lu-DOTATATE therapy. (A) Metastatic nodal mass chosen as marker lesion at bPET (SUVmax, 38.7) (outlined in red). (B) Same lesion before cycle 2 of therapy (SUVmax, 49.2) (outlined in red).
Tumor Volume Segmentation Software
A graphical user interface was developed in-house specifically to delineate whole-body tumor burden. An initial mask was defined by setting a threshold equal to the maximal value in a 3-dimensional volume of interest drawn within normal reference tissue, initially within the normal liver. From this general mask, normal physiologic tracer uptake was manually removed in a 3-dimensional maximum-intensity-projection space. The PET volume and the mask overlay were displayed at various radial angles, allowing the user to define and remove regions of normal uptake (e.g., myocardium, spleen, bladder) at any view, providing the clearest visible margins. Once the normal tissues were removed from the tumor mask, a final step allowed the user to manually add or subtract any other region to or from the mask. Correlation with morphologic imaging (contrast-enhanced CT or MRI) was performed when needed to ensure the accurate delineation of tumor sites. 68Ga-DOTATATE tumor volumes (DTTVs), SUVmax, and SUVmean were generated from the final tumor mask (Fig. 2). The same process was repeated with a threshold equal to the maximal value in a 3-dimensional volume of interest drawn within the normal spleen (a step-by-step demonstration of the segmentation process is provided in Supplemental Fig. 1 [supplemental materials are available at http://jnm.snmjournals.org]).
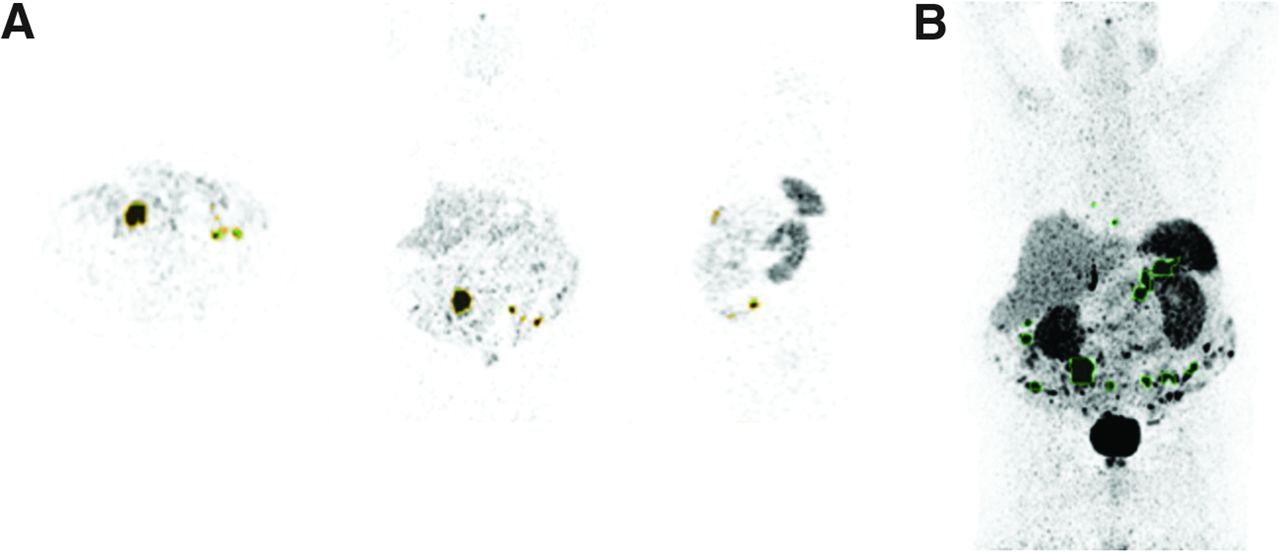
68Ga-DOTATATE tumor volume analysis using in-house automated segmentation software. (A) Multiplanar segmentation tool (to identify and confirm tumor sites). (B) Mask generated using tracer uptake in spleen as threshold (tumor lesions with SUVmax above that of spleen are outlined in green).
177Lu-DOTATATE Therapy and Clinical Outcomes
Eligible patients were treated with 4 cycles of 177Lu-DOTATATE or fewer if limited by toxicity or disease progression. Individualized dosimetry was used for the provision of 177Lu-DOTATATE therapy. The initial administered activity of 177Lu-DOTATATE was standardized at 7,400 MBq (200 mCi). Whole-body scintigraphy was performed at 4, 24, and 72 h after each cycle to estimate a recommended activity that will result in an accumulated absorbed dose to the kidneys of 23 Gy, with estimates of absorbed doses in the bone marrow and tumor. Dose escalation was capped at a maximum of 11,100 MBq (300 mCi) per dose. The final prescribed activity was determined by the treating physician on the basis of the recommended activity and patient factors, including renal and hematologic laboratory results. For the present report, the response to therapy was defined by the investigator on the basis of CT of the chest, abdomen, and pelvis performed 3 mo after the completion of therapy or earlier if disease progression was observed (12). Responders were defined as patients with a complete/partial response or stable disease, and nonresponders had progressive disease. Patients continued clinical and CT surveillance, and time to progression was documented for all study participants.
PET Data Abstraction
Reference Normal Tissue Values
The SUVmax in reference tissues, normal liver (lower threshold), and spleen (upper threshold) were recorded. In the liver, the SUVmax was measured in the posterior right lobe. For patients who underwent splenectomy, normal renal parenchyma was used for the upper threshold instead of the spleen (12,13). In the present report, both upper-threshold references are referred to collectively as “spleen.”
Tumor Parameters
Three types of tumor parameters (marker lesion–based, whole-body DTTV, and first-order heterogeneity parameters) were assessed, for a total of 13 metrics from the baseline and before cycle 2 scans, when available.
For lesion-based parameters, reference background tracer uptake in normal liver and spleen tissues (or left renal cortex in the case of previous splenectomy) was measured (volumes of interest placed in the right hepatic lobe and spleen). Up to 5 well-defined, reproducible marker lesions larger than 1 cm were chosen, with no more than 2 lesions per disease site or organ, in accordance with RECIST 1.1 recommendations (14,15). The SUVmax of each lesion and the mean SUVmax of all marker lesions were recorded. In addition, the ratio of the lesion SUVmax to the SUVmax in the liver (SUVmax T/L) or the SUVmax in the spleen (SUVmax T/S) was calculated.
For DTTV parameters, the maximum SUV within the volume of interest drawn over the liver and spleen was used as a threshold for the measurement of DTTV in the liver and DTTV in the spleen. The total DTTV (DTTV with liver and spleen as thresholds), the SUVmax generated from the contoured volumes, and the SUVmean generated for each threshold were documented.
The heterogeneity of SSTR type 2 expression at the various tumor sites was assessed using the segmented 3-dimensional tumor volumes. For this purpose, 3 different first-order heterogeneity radiomics parameters were evaluated within the generated volumes: coefficient of variation, defined as the SD divided by the mean of the activity concentration in the tumor volume; skewness, the third standardized moment and measure of the asymmetry of the activity distribution at tumor sites; and kurtosis, the fourth standardized moment and measure of the “tailedness” of the probability distribution. For both skewness and kurtosis, the metrics were calculated with and without sample size bias correction, and no significant differences were observed.
Statistical Analysis
Summary statistics were used to describe patient and disease characteristics, with mean and range for continuous variables and frequency and percentage for categoric variables. Box plots were used to visualize the distribution of continuous variables between responders and nonresponders. A 2-sided Wilcoxon rank sum test was used to test for associations between continuous variables and the response. All markers for PFS, defined as survival without progression or death, were assessed using a univariable Cox proportional hazards model. Each statistically significant marker from the univariable analysis was further assessed using a multivariable Cox proportional hazards model with adjustment for patient factors, including age, primary disease site, and Ki-67 index. A P value of less than 0.05 was considered statistically significant, without adjustment for multiple comparisons.
RESULTS
Patient Demographics
At the time of data lock for the present analysis (December 2019), 96 consecutive subjects had been referred between August 2016 and January 2019 for consideration of PRRT. Five subjects who were not treated were excluded (2 withdrew from the study, and 3 had inadequate tracer uptake in tumor sites). Thus, 91 patients who fulfilled the inclusion criteria, received therapy, and had follow-up data available comprised the study cohort. Thirty-six of them underwent iPET. Patient characteristics are shown in Table 1. Patients received up to 4 cycles of PRRT (mean, 3.67: range, 1–4) with an average dose of 7,375.1 MBq (range, 972–12,659 MBq). The mean clinical follow-up was 12.2 mo (range, 1.4–38 mo). There were 71 responders (51 with stable disease; 20 with a partial response) and 20 nonresponders. The mean PFS was 18.9 mo (95% CI, 15.6–22.8 mo).
Patient Characteristics for Entire Cohort and Subgroup with iPET
bPET Parameters
Reference Tissues
The SUVmax in 2 reference tissues, normal liver and spleen, were compared in responders and nonresponders. For 9 patients who underwent splenectomy, normal renal parenchyma was used instead of the spleen as the upper-threshold reference. For the lesion-based analysis, a mean of 4.7 target lesions was evaluated for each patient (median, 5; range, 2–5). Baseline reference tissue parameters (lesion-based 68Ga-DOTATATE PET/CT measures, DTTV parameters, and heterogeneity parameters) for responders and nonresponders are summarized in Table 2.
bPET Reference Parameters, Lesion-Based Parameters, DTTV Parameters, and First-Order Heterogeneity Parameters
Tumor Parameters
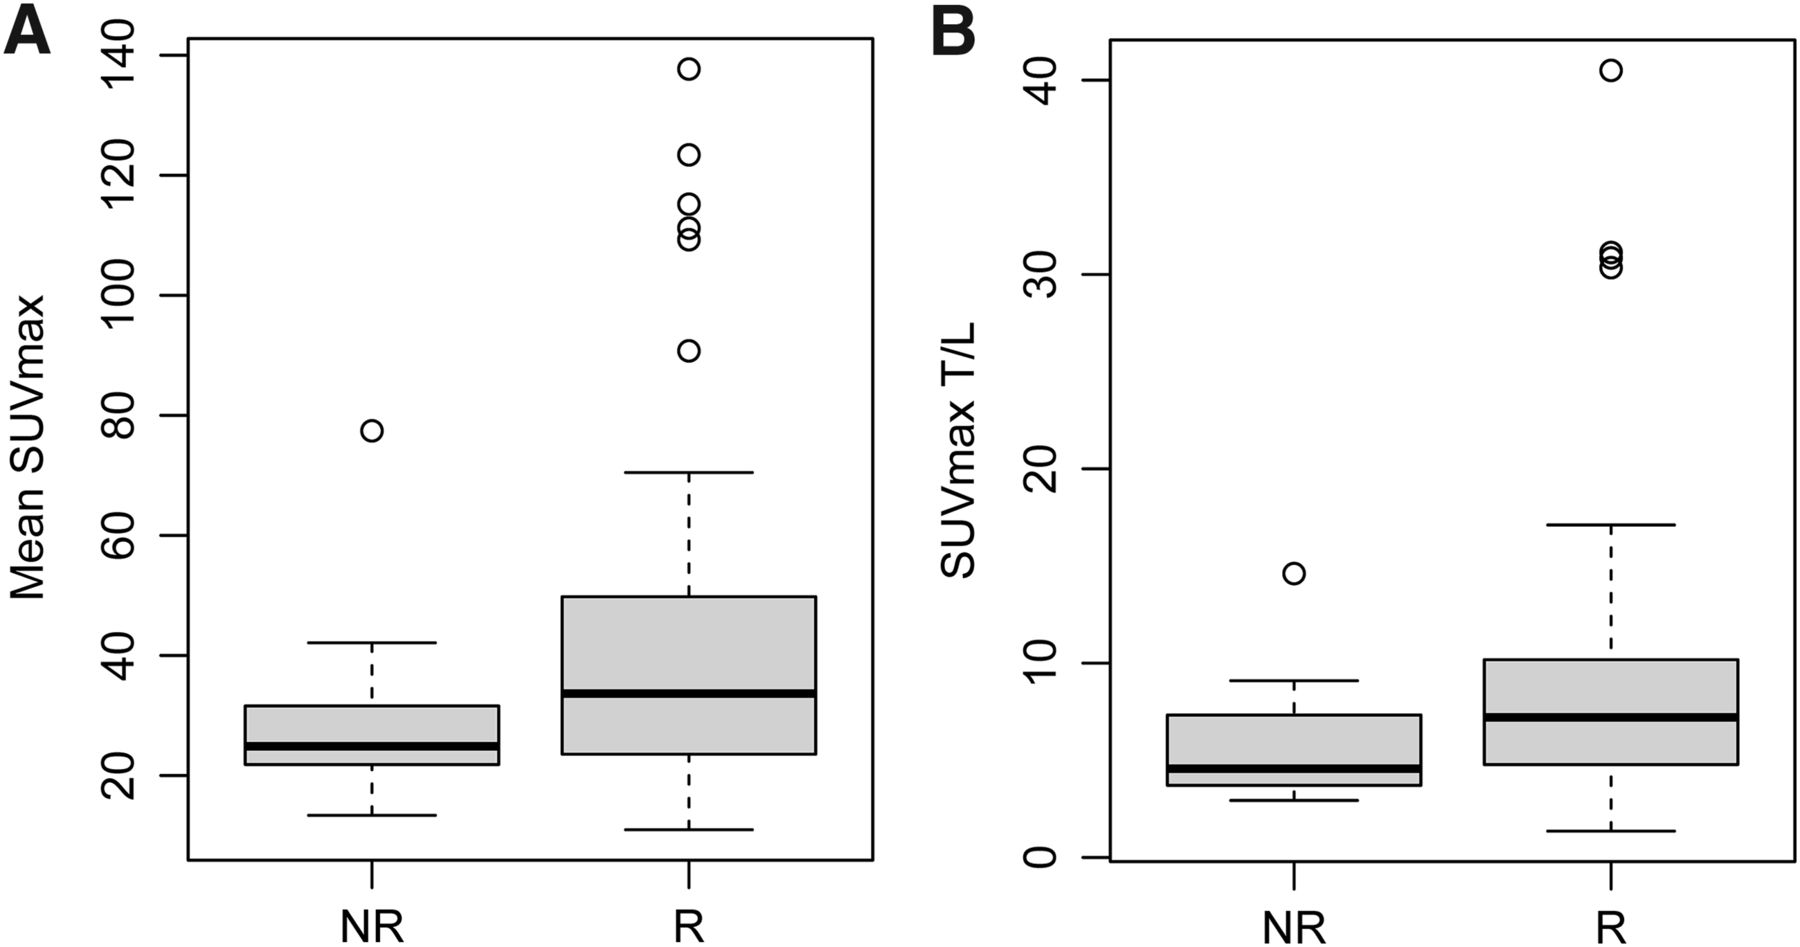
For marker lesions, higher mean SUVmax and SUVmax T/L were predictive of the therapy response (P = 0.018 and 0.024, respectively) (Fig. 3). Similarly, higher SUVmax measured in DTTVs and SUVmean of segmented tumor volumes with the liver used as a threshold were associated with the therapy response (P = 0.025 and 0.0055, respectively) (Fig. 4). An association of mean SUVmax of target lesions, SUVmax T/L, SUVmax T/S, and SUVmean of segmented tumor volumes with the liver used as a threshold with progression or death was demonstrated (P = 0.0023. 0.028, 0.047, and 0.0053, respectively).

Lesion-based measures. Distributions of median SUVmax (P = 0.018) (A) and SUVmax T/L (P = 0.024) (B) are shown. Box plots represent median and upper and lower quartiles of each distribution, with whiskers showing limits of distribution (1.5 times interquartile range). NR = nonresponders; R = responders.
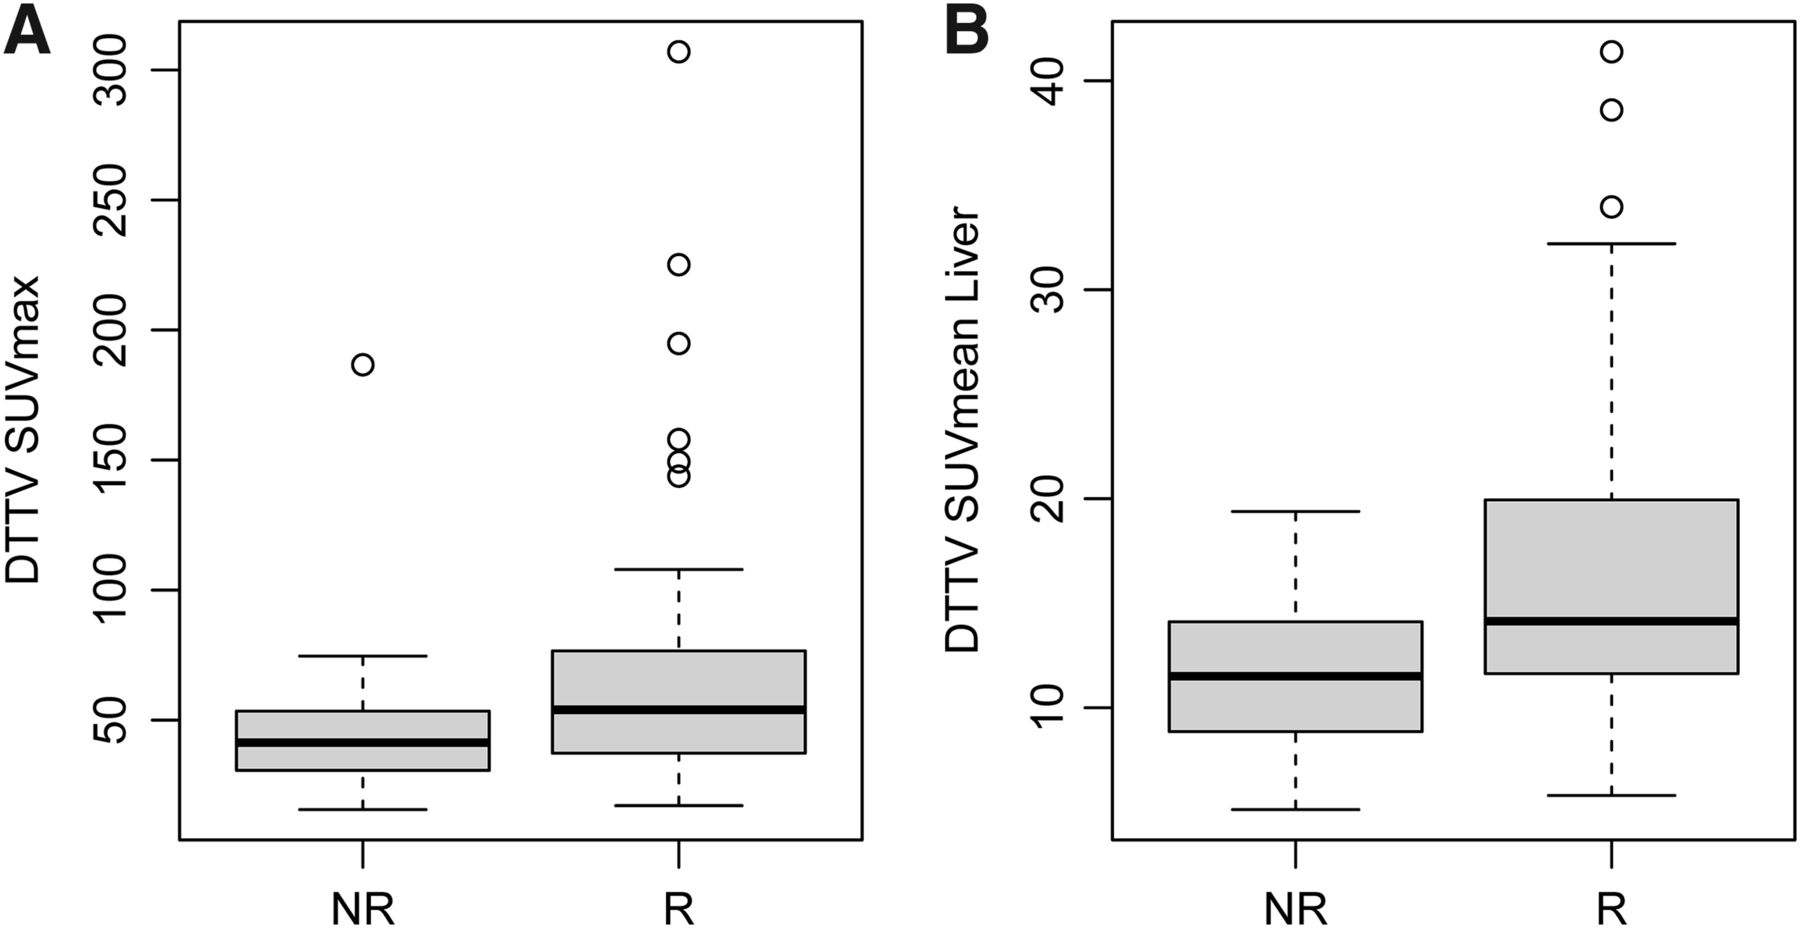
DTTV parameters. Distributions of mean DTTV SUVmax (P = 0.025) (A) and SUVmean obtained with liver as threshold (SUVmean Liver) (P = 0.0055) (B) are shown. Box plots represent median and upper and lower quartiles of each distribution, with whiskers showing limits of distribution (1.5 times interquartile range). NR = nonresponders; R = responders.
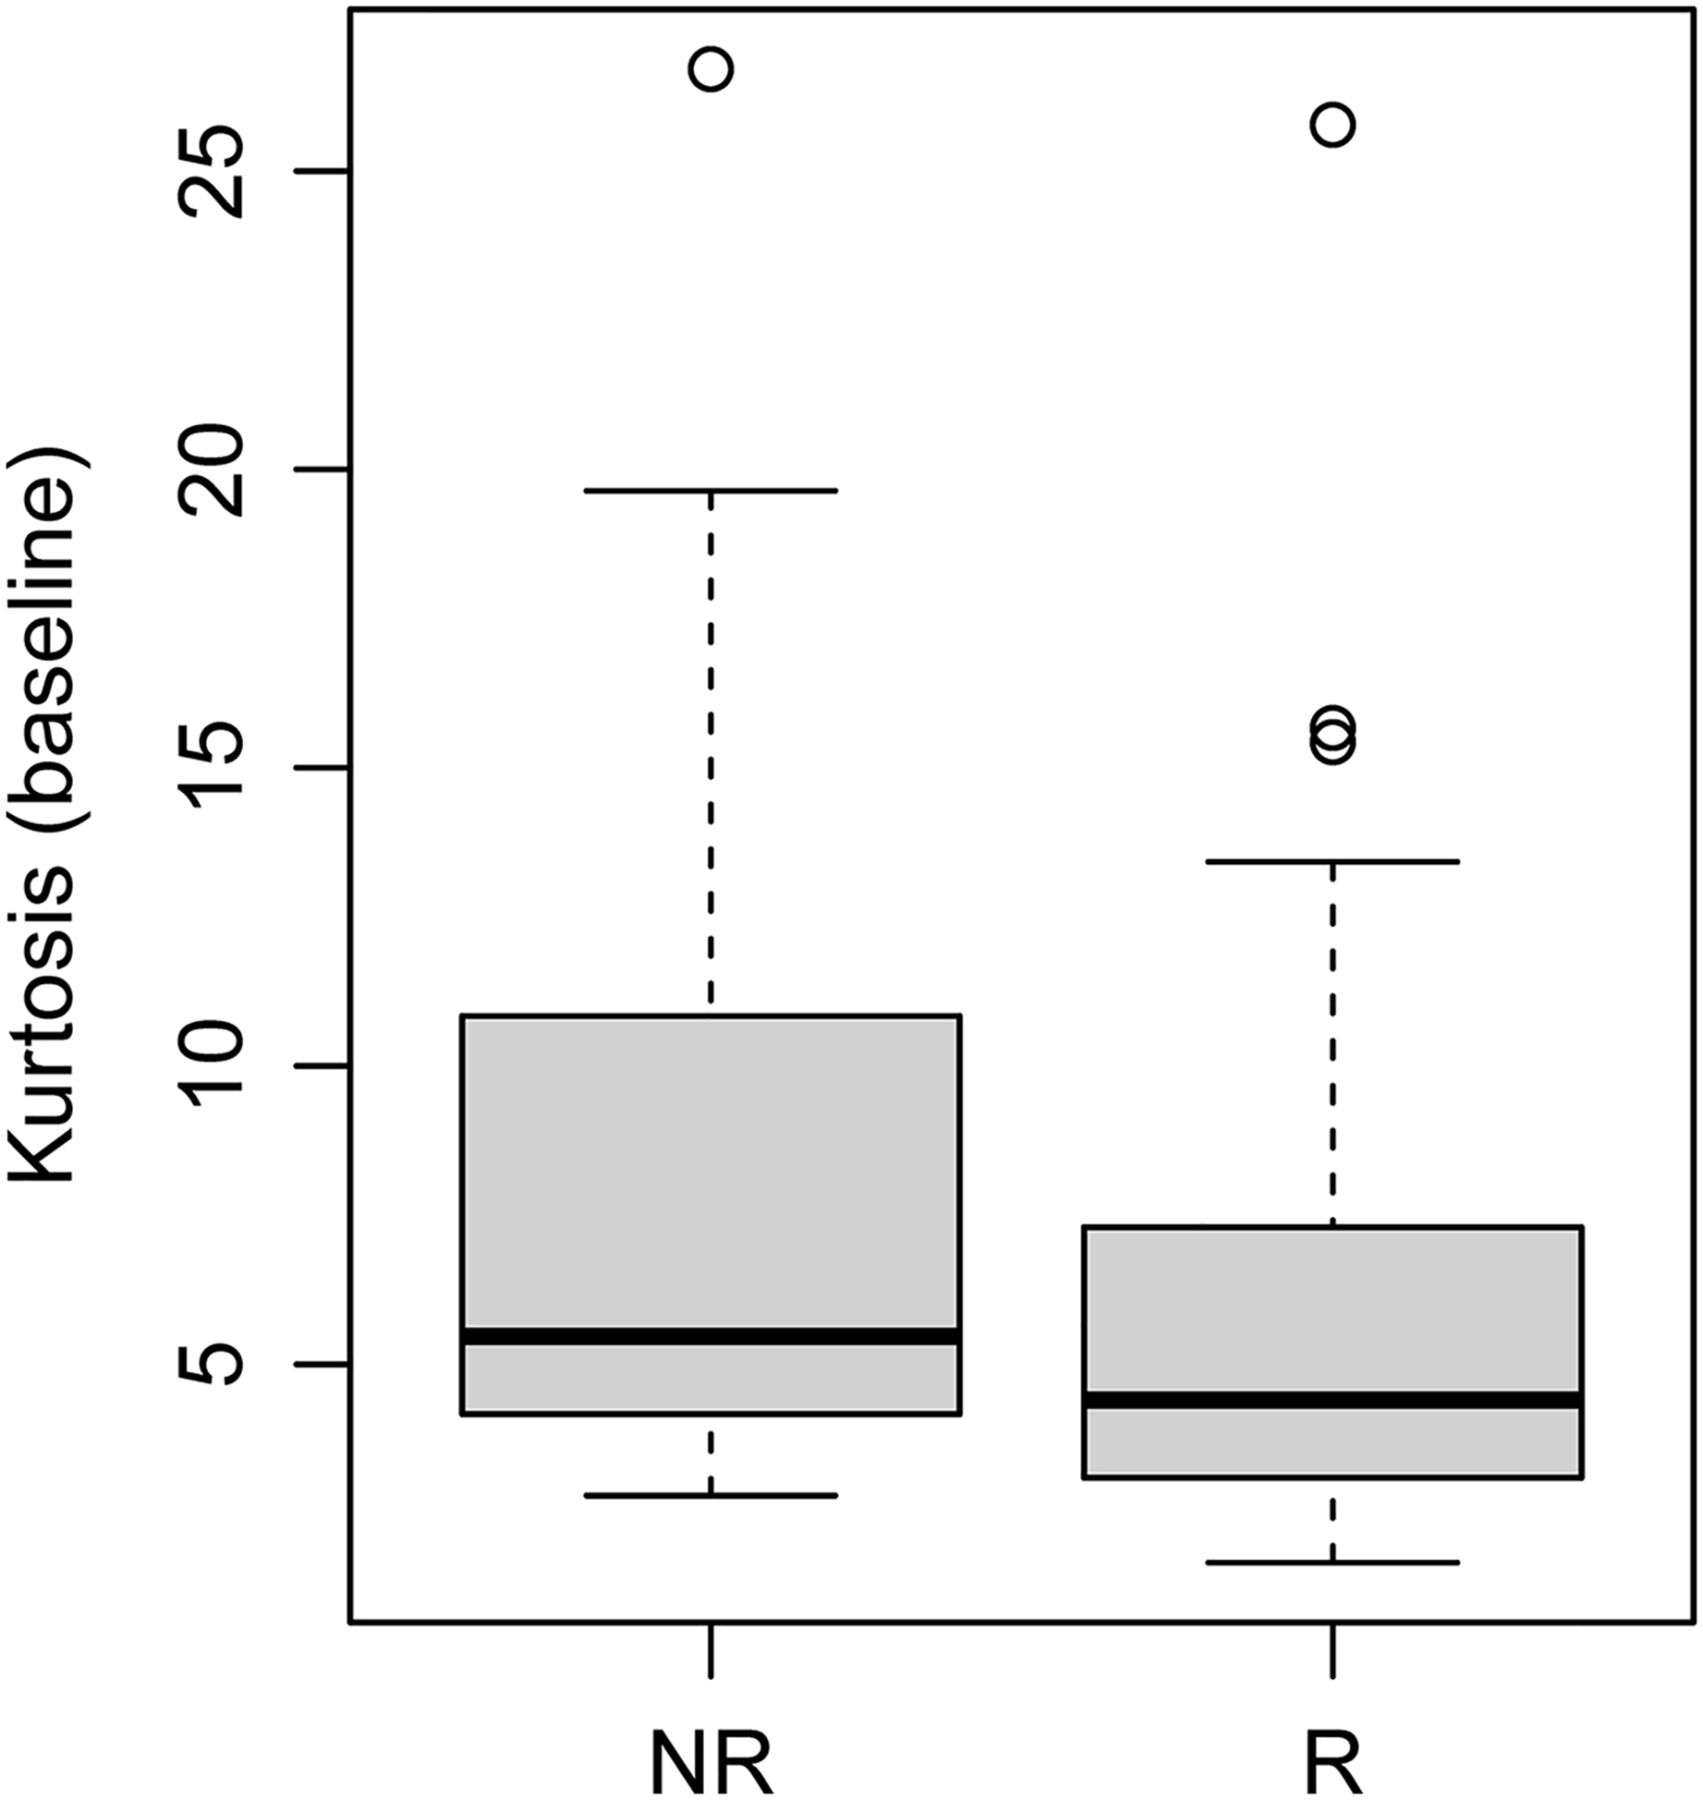
Of the 3 analyzed first-order heterogeneity parameters, only kurtosis emerged as a significant predictor of outcome, with higher values in nonresponders than in responders (Fig. 5). Both skewness (hazard ratio [HR], 1.49 [95% CI, 1.07–2.07]; P = 0.017) and kurtosis (HR, 1.06 [95% CI, 1.01–1.11]; P = 0.022) were associated with progression or death.

Kurtosis on baseline 68Ga-DOTATATE PET/CT. Distribution of kurtosis was estimated from 68Ga-DOTATATE tumor volumes (P = 0.031). Box plot represents median and upper and lower quartiles of each distribution, with whiskers showing limits of distribution (1.5 times interquartile range). NR = nonresponders; R = responders.
iPET Response Assessment Parameters
iPET lesion-based, DTTV, and heterogeneity parameters are shown in Table 3. Changes in the various parameters between bPET and iPET are shown in Supplemental Table 1.
iPET Reference Parameters, Lesion-Based Parameters, DTTV Parameters, and First-Order Heterogeneity Measures, Part 1
PFS
There was a correlation of higher mean SUVmax, SUVmax T/L, SUVmax T/S, and DTTV SUVmean obtained with the liver as a threshold with a longer PFS (P = 0.023, 0.028, 0.047, and 0.0053, respectively). Conversely, higher kurtosis and skewness were correlated with a shorter PFS (P = 0.0022 and 0.017, respectively).
From the multivariable analysis with adjustment for age, primary site, and Ki-67 index, the mean SUVmax (P = 0.019), SUVmax T/L (P = 0.018), SUVmax T/S (P = 0.041), DTTV SUVmean obtained with the liver as a threshold (P = 0.0052), and skewness (P = 0.048) remained statistically significant predictors of PFS; however, variable kurtosis was not significant in the multivariable analysis. None of the analyzed parameters at iPET showed a statistical correlation with PFS in the univariable analysis.
Table 4 shows the results for the univariable analysis of the prediction of PFS from demographic data, the tumor Ki-67 index, lesion-based measures, DTTV parameters, and heterogeneity parameters on bPET as well as the multivariable analysis results obtained from statistically significant parameters in the univariable analysis when correlated with age, primary disease site, and Ki-67 index. The complete univariable analysis is shown in Supplemental Table 2.
Univariable (UVA) and Multivariable (MVA) Analyses of Lesion-Based, Tumor Volume–Based, and Heterogeneity Parameters as Predictors of PFS
DISCUSSION
The identification of biomarkers predictive of the therapy response and prognosis is essential for personalized care. PRRT is an effective mode of therapy in patients with metastatic NETs, but it is only appropriate for patients whose tumors highly overexpress somatostatin receptors (16). As would be expected and as previously reported, a higher tumor SUVmax on 68Ga-DOTATATE PET/CT correlates with the treatment response (17–20). A few SUV-based parameters, including the mean SUVmax of target lesions and the SUVmean generated from the DTTV with the liver as a threshold, were predictive of the response to PRRT; both the mean SUVmax and the DDTV SUVmean obtained with the liver as a threshold also correlated with PFS (HRs, 1.04 and 1.19, respectively). A further interesting observation from the present study was that there was generally a higher SUVmax in reference tissues (normal liver and spleen) at iPET in patients who responded to PRRT. In the normal liver, SSTRs are predominantly found in bile ducts, whereas in the normal spleen, autoradiography and immunohistochemistry studies have shown that they are found predominantly in red pulp (21,22). The reason for the presumed flare phenomenon in tracer uptake in normal tissues with a high level of expression of SSTRs is uncertain; however, it may reflect an inflammatory response, with an increase in activated macrophages that overexpress SSTR-1 and SSTR-2 on their cell surface (23,24). This phenomenon has also been the basis of imaging of inflammation in atherosclerosis and myocarditis with 68Ga-DOTATATE PET/CT (25,26).
Early prediction of treatment failure can be a powerful clinical tool. For certain disease entities, early biomarkers have been validated and are clinically used to tailor therapy and reduce toxicity. Although generally well tolerated, PRRT can be associated with significant hematologic, renal, and hepatic toxicities (in approximately 10%, 0.4%, and 0.4% of patients, respectively) (27). Despite the high radiation dose delivered, disease progression is observed in 20%–30% of patients, and most patients achieve stable disease as the best response (28). Biomarkers that accurately predict PRRT outcomes may identify patients who are unlikely to benefit from it and limit unnecessary toxicity. Although the SUVmean generated from the DTTV with the liver as a threshold on iPET was significantly higher in responders than in nonresponders (18.1 [SD = 9.1] and 11.2 [SD = 3.3], respectively), the overlap may limit the clinical utility of this observation.
NETs often exhibit intratumoral heterogeneity. Skewness and kurtosis, first-order features of heterogeneity, depict the asymmetry within the gray-level distribution observed within a volume of interest and spreading of the expected gaussian curve, respectively. We have shown an inverse relationship between the baseline measurement of kurtosis and the response to PRRT. Both measured parameters correlate inversely with PFS (HRs, 0.54 and 0.9, respectively). These findings are in line with those of previous studies showing the predictive value of the subjective assessment of tumor heterogeneity and the response to PRRT (29–31). Graf et al. recently reported that the visual assessment of SSTR heterogeneity had both predictive value and prognostic value in progressive grade 1 or grade 2 NET patients undergoing PRRT, exceeding the prognostic value of the Ki-67 index (31).
There are several limitations of the present study. First, we included patients with multiple different NET sites, as the study was designed to enable broad access to PRRT for patients with metastatic NETs. However, patient selection criteria, including the Ki-67 index and SSTR type 2 expression on PET, were standardized. Second, iPET was optional and was performed only for a subset of patients. However, iPET parameters added little to patient outcomes and were not predictive of PFS. Third, DTTV and quantitative heterogeneity parameters required the use of segmentation tools, some of which are time-consuming and may not be practical for routine clinical use. However, we have shown that manual SUVmax measurements of target lesion can be used. Furthermore, a previous publication suggested that the subjective evaluation of heterogeneity has prognostic value, and some of our objective measures of tumor heterogeneity confirm this observation (31). Fourth, there was an overlap between responders and nonresponders for all of the predictive parameters, including parameters after cycle 1 of PRRT, limiting their clinical utility in isolation for guiding patient management.
CONCLUSION
The degree of SSTR type 2 expression and tumor heterogeneity, as represented by several metrics in our analysis, are predictive of the therapy response or PFS. Changes in these parameters after cycle 1 of PRRT did not correlate with clinical outcomes. A model or scoring system integrating combinations of the predictive parameters identified with other clinical prognostic factors should be developed to predict the therapy response and patient outcomes more reliably.
DISCLOSURE
Funding was provided by the Ontario Health-Cancer Care Ontario Neuroendocrine Tumor Consortium to run the trial at the local sites as well as for central trial coordination. Funding was also provided by the Princess Margaret Hospital Foundation to support central trial coordination. In addition, funding was provided by the Susan Leslie Clinic for Neuroendocrine Tumors, Odette Cancer Centre, to support the implementation of the trial at Odette Cancer Center. No other potential conflict of interest relevant to this article was reported.
KEY POINTS
QUESTION: Are there quantitative 68Ga-DOTATATE parameters at bPET or iPET after 1 cycle of PRRT that are predictive of the response to therapy, PFS, or both?
PERTINENT FINDINGS: Higher SUVmax in marker tumor sites and SUVmean of segmented DTTVs obtained with the liver as a threshold at bPET and iPET correlated with the therapy response, and the baseline parameters were predictive of PFS. Skewness, a first-order feature of tumor heterogeneity, was also associated with PFS, and changes observed at iPET did not correlate with outcomes.
IMPLICATIONS FOR PATIENT CARE: Although certain quantitative 68Ga-DOTATATE PET parameters are predictive of a response to PRRT and PFS, the overlap of these parameters in responders and nonresponders limits their clinical utility in isolation for guiding patient management.
Footnotes
Published online February 12, 2021.
- © 2021 by the Society of Nuclear Medicine and Molecular Imaging.
REFERENCES
- Received for publication September 15, 2020.
- Accepted for publication January 20, 2021.


