


Abstract
PET using O-(2-18F-fluoroethyl)-l-tyrosine (18F-FET) is useful to detect residual tumor tissue after glioma resection. Recent animal experiments detected reactive changes in 18F-FET uptake at the rim of the resection cavity within the first 2 wk after resection of gliomas. In the present study, we evaluated pre- and postoperative 18F-FET PET scans of glioma patients with particular emphasis on the identification of reactive changes after surgery. Methods: Forty-three patients with cerebral gliomas (9 low-grade, 34 high-grade; 9 primary tumors, 34 recurrent tumors) who had preoperative (time before surgery: median, 23 d; range, 6–44 d) and postoperative 18F-FET PET (time after surgery: median, 14 d; range, 5–28 d) were included. PET scans (20–40 min after injection) were evaluated visually for complete or incomplete resection and compared with MRI. Changes in 18F-FET uptake were evaluated by tumor-to-brain ratios in residual tumor and by maximum lesion-to-brain ratios near the resection cavity. Results: Visual analysis of 18F-FET PET scans revealed complete resection in 16 of 43 patients and incomplete resection in the remaining patients. PET results were concordant with MRI in 69% of the patients. The maximum lesion-to-brain ratio for 18F-FET uptake near the resection cavity was significantly higher than preoperative values (1.59 ± 0.36 vs. 1.14 ± 0.17; n = 43; P < 0.001). In 11 patients (26%), a flare phenomenon was observed, with a considerable increase in 18F-FET uptake compared with preoperative values in either the residual tumor (n = 5) or areas remote from the tumor on the preoperative PET scan (n = 6) (2.92 ± 1.24 vs. 1.62 ± 0.75; P < 0.001). Further follow-up in 5 patients showed decreasing 18F-FET uptake in the flare areas in 4 patients and progress in 1 patient. Conclusion: Our study confirmed that 18F-FET PET provides valuable information for assessing the success of glioma resection. Postoperative reactive changes at the rim of the resection cavity appear to be mild. However, in 23% of the patients, a postoperative flare phenomenon was observed that warrants further investigation.
Cerebral gliomas are difficult to treat because of their infiltrative growth, and prognosis remains poor despite intensive multimodal treatment strategies (1). Surgical resection is the proposed first-line therapy, and the extent of tumor resection correlates with the efficacy of adjuvant treatment and prolonged survival (2,3). The standard method used to assess the amount of residual tumor after surgery is contrast-enhanced MRI. This should be performed within 72 h after surgery since later it becomes challenging to differentiate contrast-enhancing tumor tissue from treatment-related changes (4). Contrast enhancement in early postoperative MRI is, however, not a reliable measure of the extent of the residual tumor, as considerable parts of gliomas may extend beyond the area of contrast enhancement and are not reliably detected by conventional MRI (5,6).
The potential of amino acid PET to determine the extent of glioma resection has been addressed in several studies, and compared with conventional MRI, a diagnostic gain has been consistently reported (7–11). PET using l-[methyl-11C]-methionine successfully detected residual tumor tissue in 13 of 19 pediatric brain tumors, which were confirmed by repeated surgery or tumor progress in all cases (7). In another study, including 43 adults with high-grade glioma, total tumor resection as assessed by l-[methyl-11C]-methionine correlated significantly with survival, whereas a total removal of contrast enhancement in MRI did not (8). For PET using O-(2-18F-fluoroethyl)-l-tyrosine (18F-FET), the most extensive study to date (n = 62) reported conflicting findings compared with MRI in 19% of patients after resection of gliomas (11). Furthermore, elevated tracer uptake on the postoperative 18F-FET PET scans correlated with the sites of subsequent tumor recurrence (12).
A recent study showed residual 18F-FET uptake after surgery beyond intraoperative fluorescence after the application of 5-aminolevulinic acid in 13 of 31 patients with glioblastoma (10).
In a recent experimental study with rat gliomas, we observed increased 18F-FET uptake at the rim of the resection cavity within the first 2 wk after glioma resection, especially in the first few days after surgery (13). Since this uptake decreased in the second week after surgery, it was recommended that 18F-FET PET be performed later than 2 wk after resection. In this retrospective study, we evaluated the pre- and postoperative 18F-FET PET scans of glioma patients, with particular emphasis on potential reactive changes after surgery.
MATERIALS AND METHODS
Patient Population
We searched our records of the last 10 y for patients with cerebral gliomas who had undergone preoperative 18F-FET PET and postoperative 18F-FET PET within 4 wk after surgery as part of clinical diagnostics. Forty-three patients met these criteria. Their preoperative imaging took place a median of 23 d before surgery (range 6–44 d), and their postoperative imaging took place a median of 14 d after surgery (range, 5–28 d). Ten of the patients had untreated primary tumors, and 33 patients had tumor relapse after various forms of pretreatment. A detailed overview of the histopathologic diagnosis and clinical data of the patients is presented in Table 1. Histopathologic diagnosis was based on the World Health Organization classification of 2007, since no molecular markers were available for the older cases (14). A further subdivision of the patients was made concerning the time interval of 18F-FET PET investigation after surgery (Fig.1), according to our previous study (13). Group A (n = 23) had the second 18F-FET PET exam within 5–14 d after tumor resection, and group B was within 15–28 d (n = 20). The resection status according to early postoperative MRI (<48 h postoperatively) was available for 39 patients, and 15 patients had additional 18F-FET PET scans in the further course of the disease (mean, 193 d; range, 54–389 d postoperatively).
Histopathologic Diagnosis and Clinical Data
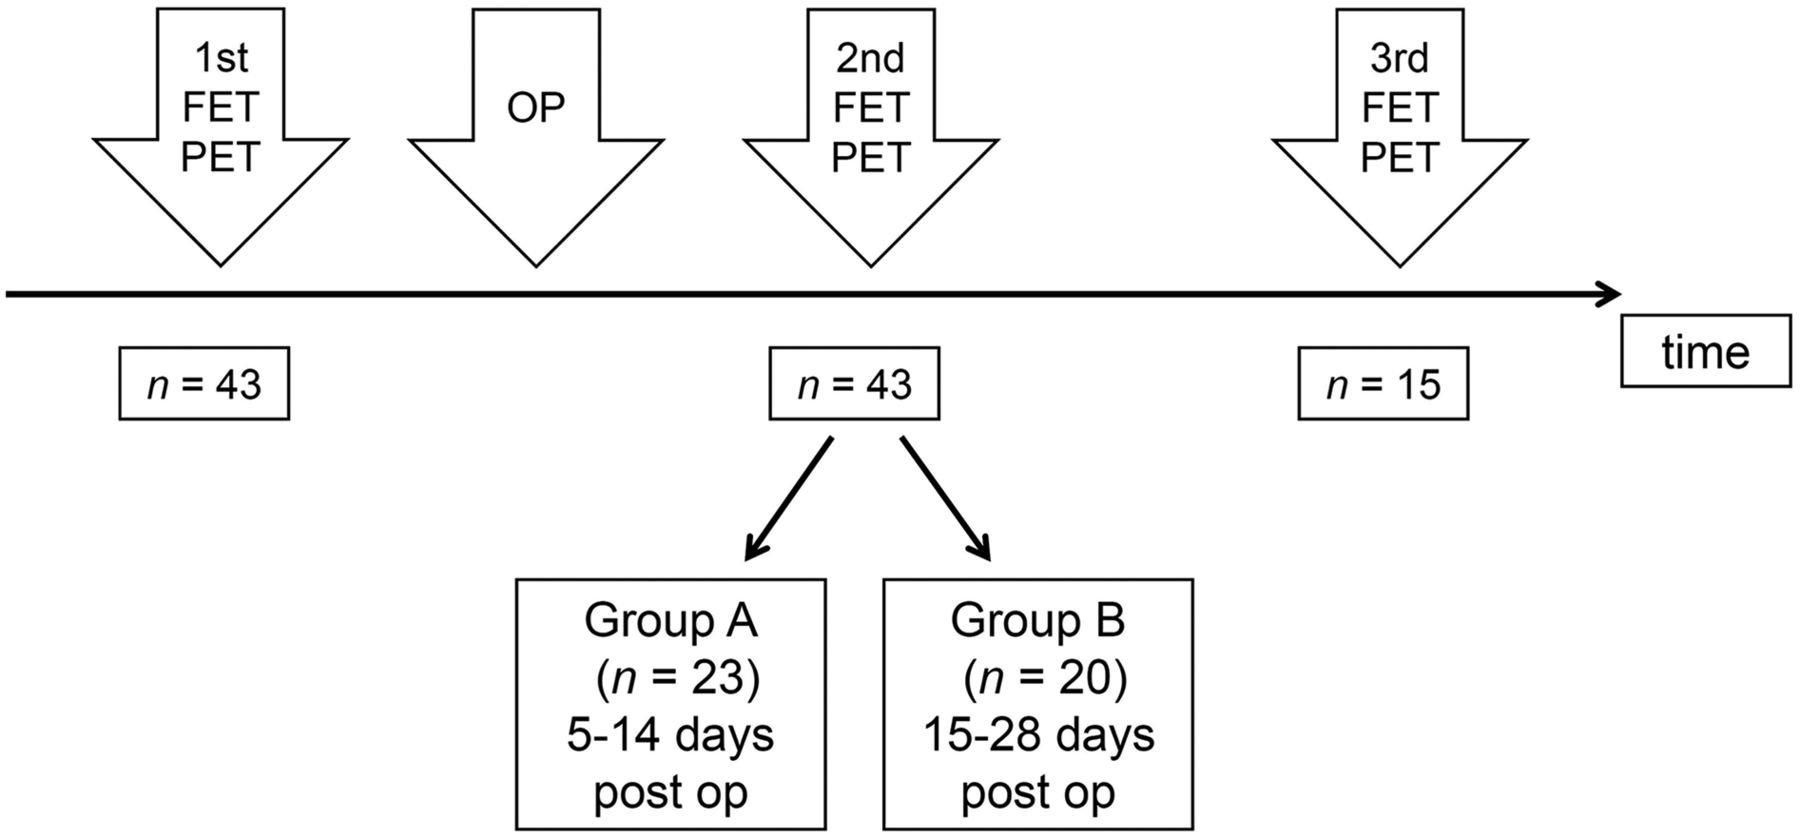
Schematic time course of 18F-FET PET. OP = surgical operation; post op = postoperatively.
18F-FET PET
18F-FET was produced via aminopolyether-activated nucleophilic 18F-fluorination and applied as described previously (15). Dynamic PET data were acquired in list mode for 40 min after intravenous injection of approximately 2.5 MBq of 18F-FET/kg of body weight. Seventy-nine scans were obtained using a stand-alone PET scanner (ECAT EXACT HR+; Siemens Healthcare) in 3-dimensional mode (32 rings; axial field of view, 15.5 cm). The reconstructed dynamic dataset consisted of 16 time frames (5 × 1 min, 5 × 3 min, and 6 × 5 min). A transmission scan (duration, 10 min) using 3 rotating line sources (68Ge/68Ga) was applied for attenuation correction. Before iterative reconstruction based on ordered-subset expectation maximization (16 subsets, 6 iterations), data were corrected for dead time, random coincidences, and scattered coincidences. Twenty-two scans were done on a high-resolution 3-T hybrid PET/MR scanner (BrainPET [Siemens Healthcare]; 72 rings; axial field of view, 19.2 cm). Image data were corrected for random and scatter coincidences, as well as dead time, before undergoing ordinary Poisson ordered-subset expectation maximization reconstruction as provided by the manufacturer (2 subsets, 32 iterations). The reconstructed dynamic dataset consisted of 16 time frames (5 × 1 min, 5 × 3 min, and 6 × 5 min). Since the hybrid PET/MR scanner does not provide a transmission source, attenuation correction was performed with a template-based approach using MRI (16). All dynamic 18F-FET PET datasets were also corrected for motion before further processing. On the basis of the reconstruction parameters and postprocessing steps used in the present work, the quantitative 18F-FET PET parameters of the different scanner types are comparable (17).
PET Data Analysis
18F-FET uptake in the tissue was expressed as SUV by dividing the radioactivity concentration (kBq/mL) in the tissue by the radioactivity injected per gram of body weight. The summed 18F-FET PET images (20–40 min after injection) were used for further analysis. The different 18F-FET PET and MRI scans of the individual patients were coregistered using the commercially available software PMOD, version 3.408. In a first step, the pre- and postoperative PET images were visually evaluated by 2 physicians experienced in 18F-FET PET reading. The images were classified in consensus as showing complete resection (CR) if no significant residual pathologic 18F-FET uptake was detectable after surgery or incomplete resection (IR) if pathologic 18F-FET uptake was present after surgery. Furthermore, cases in which there was a prominent increase in local or distant 18F-FET accumulation in the postsurgical PET scans were evaluated separately.
For quantitative evaluation, spheric 2 cm3 volumes of interest (VOIs) were used, as this volume reduces the influence of different scanner resolutions (18). A crescent-shaped reference region of interest, placed in the contralateral hemisphere in an area of normal-appearing brain tissue, served as a background region. Maximum tumor-to-brain ratios or maximum lesion-to-brain ratios were calculated by dividing the SUV in those VOIs by the SUVmean in the background region (19). To evaluate reactive changes induced by surgery, 2 cm3 VOIs were placed in the postoperative PET scans at the rim of the resection cavity, which were free of tumor according to the pre- and postoperative PET and MRI scans. The maximum lesion-to-brain ratios of these VOIs were compared with preoperative values.
In cases with a prominent increase in local or distant 18F-FET accumulation in PET scans after surgery, 2 cm3 VOIs were centered on the maximum of these areas with presumable tumor tissue, and the maximum tumor-to-brain ratio was compared with preoperative values after the projection of these VOIs to the preoperative PET scans. Furthermore, the biologic tumor volume (BTV) was determined using a threshold of 1.6 above the reference value. This threshold has been described as best separating primary tumor from nontumoral tissue in a biopsy-controlled study (20). Pre- and postoperative BTVs were compared. Furthermore, the time–activity curves for 18F-FET uptake in those areas were evaluated, and the time to peak and the slope of the time–activity curve in the late phase of 18F-FET uptake were determined.
The time–activity curves for 18F-FET uptake in areas with the flare phenomenon and in the corresponding areas before surgery were generated by application of a spheric VOI with a volume of 2 cm3 centered on maximal tumor uptake to the entire dynamic dataset as described previously (21). The time to peak (minutes from the beginning of the dynamic acquisition to the SUVmax of the lesion) and the slope of the time–activity curve in the late phase of FET uptake were assessed by fitting a linear regression line to the late phase of the curve (11–40 min after injection). The slope was expressed as the change in SUV per hour. This allows for a more objective evaluation of kinetic data than does assignment of time–activity curves to earlier reported patterns of 18F-FET uptake during dynamic acquisition.
Statistical Analysis
Descriptive statistics are provided as mean and SD or as median and range. The Student t test for independent samples was used to compare 2 groups, and the paired t test for dependent samples was used to analyze changes after therapy. The Mann–Whitney rank-sum test was used when variables were not normally distributed. Categoric variables were tested by the Pearson χ2 test or Fisher exact test. Data were analyzed using SigmaPlot, version 11.0 (Systat Software). Probability values of less than 0.05 were considered significant.
RESULTS
Visual analysis of 18F-FET PET scans yielded CR in 16 patients and IR in 27 patients. PET results were concordant with early postoperative MRI findings in 69% of the patients, that is, 13% had CR of contrast-enhancing tissue on MRI and 56% had IR. In 31% of patients, the results of PET and MRI were discordant, that is, 8% showed CR on MRI but IR on PET, and 23% showed IR on MRI but CR on PET. 18F-FET uptake near the resection cavity was significantly increased compared with preoperative values (lesion-to-brain ratio, 1.59 ± 0.36 vs. 1.14 ± 0.17; P < 0.001). Changes in the lesion-to-brain ratio near the resection cavity did not significantly differ between groups A and B. An example of increased 18F-FET uptake near the resection cavity is presented in Figure 2.
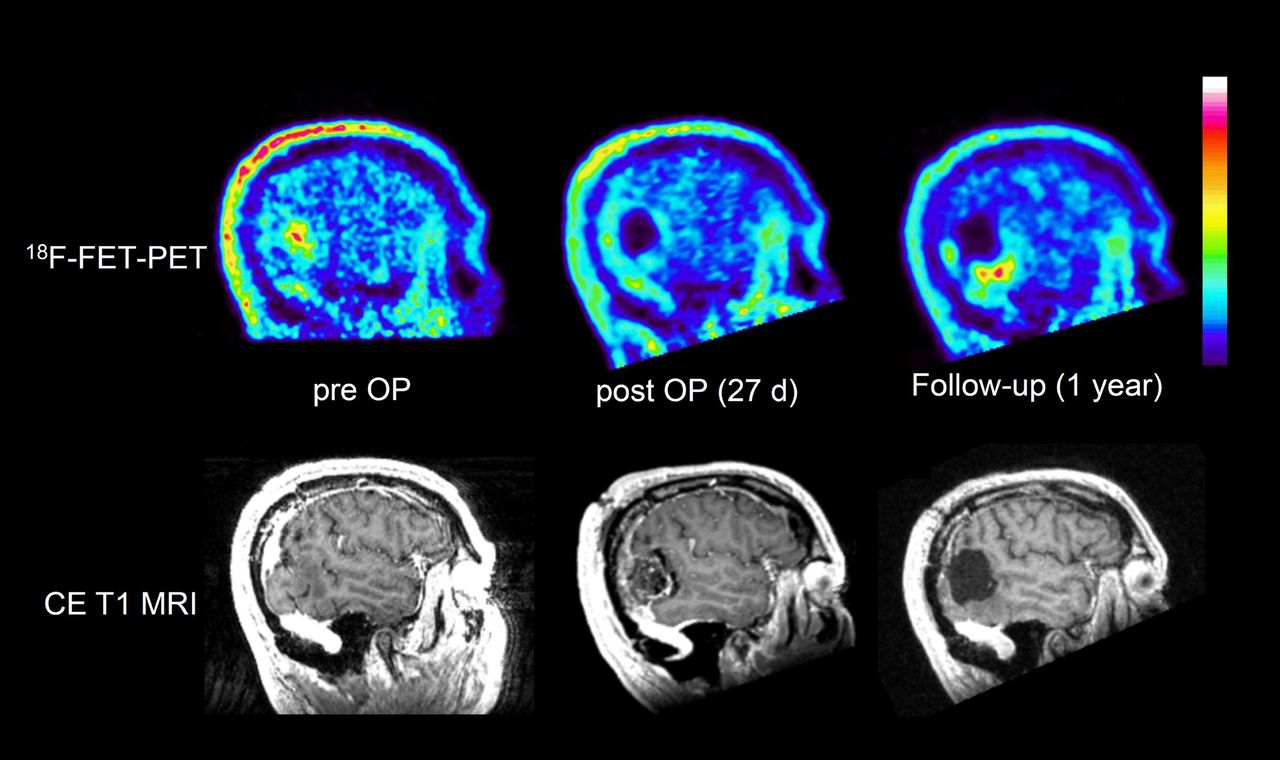
Patient 41, with recurrent oligoastrocytoma of World Health Organization grade III: sagittal slices of preoperative, postoperative, and follow-up 18F-FET PET and contrast-enhanced T1-weighted MRI. Postoperative 18F-FET PET is rated as CR of tumor, but there is slightly increased tracer uptake at rim of resection cavity (maximum lesion-to-brain ratio, 1.5), interpreted as reactive changes. Measured BTV increases from 8 to 16 cm3 after surgery. Follow-up after 1 y shows recurrent tumor at lower rim of resection cavity. CE = contrast-enhanced; OP = operative.
The median BTV of 18F-FET uptake was 18 cm3 before surgery (range, 2–162 cm3) and 22 cm3 after surgery (range, 4–222 cm3). The BTV decreased after surgery in 16 patients and increased in 27 patients. An increasing BTV after surgery occurred significantly more frequently in group A than in group B (18 vs. 9; P = 0.03). Importantly, 9 of the patients with CR of 18F-FET uptake according to visual evaluation (n = 18) showed an increasing BTV after surgery.
A prominent increase in regional 18F-FET accumulation, or flare phenomenon, after surgery was observed in 11 patients (26%) (maximum tumor-to-brain ratio, 2.92 ± 1.24 vs. 1.62 ± 0.75; P < 0.001). The flare phenomenon was significantly more frequent in group 2 (n = 9) than in group 1 (n = 2; P = 0.01). In 5 patients, the flare phenomenon occurred in the residual tumor after surgery, that is, in the area that showed highly tumor-suggestive 18F-FET uptake in the preoperative scan. In 6 patients, the flare phenomenon occurred in areas remote from the area of increased tracer uptake in the preoperative PET scan. The relative changes in maximum tumor-to-brain ratios in these patients are shown in Figure 3. In 5 cases, MRI showed contrast enhancement in the flare region, and in 6 cases, it did not. T2-weighted MRI findings were abnormal in the flare region in all cases. Analysis of the time–activity curve of 18F-FET uptake in the flare areas showed no significant change between preoperative and postoperative values (time to peak, 28.5 ± 8.1 min vs. 27.5 ± 10.3 min; slope, 0.33 ± 0.58 vs. 0.23 ± 0.94 SUV/h; n = 11, not statistically significant). In 6 patients, the slope in the flare area showed an increase both preoperatively and postoperatively: in 3 cases, an increase preoperatively and a decrease postoperatively, and in 2 cases, a decrease both preoperatively and postoperatively. In 4 of the 11 cases with the flare phenomenon, a follow-up 18F-FET PET scan was available that showed a decreasing 18F-FET uptake in the flare area during radiochemotherapy in 3 cases and further increasing 18F-FET uptake with tumor progression in 1 case. Examples of the flare phenomenon in areas remote from the area of increased tracer uptake on the preoperative PET scan in residual tumor tissue are shown in Figure 4 and in Supplemental Figure 1 (supplemental materials are available at http://jnm.snmjournals.org). In the latter case, the area with the flare phenomenon exhibited tumor progression after 3 mo.

Changes in maximum tumor-to-brain ratio (TBRmax) for 18F-FET uptake in patients with flare phenomenon after surgery, that is, either in area of tumor tissue with increased 18F-FET uptake in preoperative scan (n = 5, black symbols) or in area distant from that location (n = 6, red symbols).

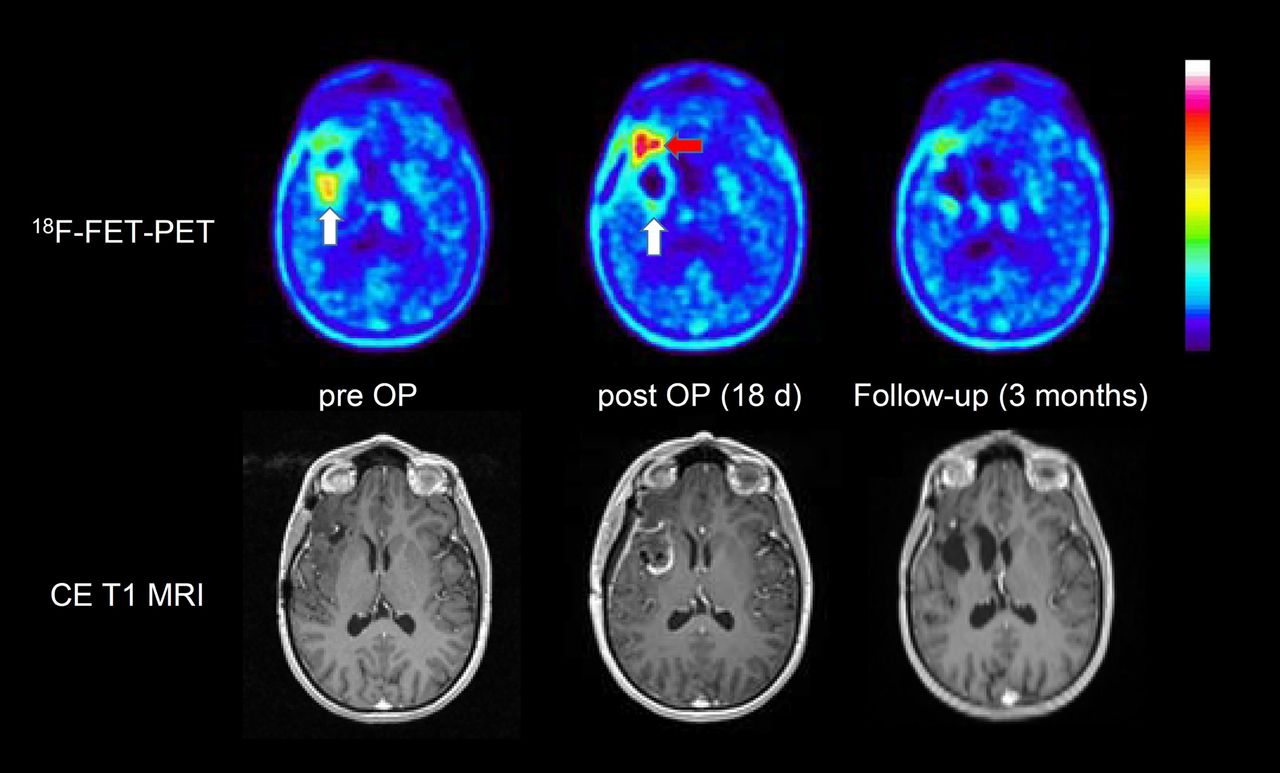
Axial images of patient 33, with frontotemporal oligodendroglioma of World Health Organization grade III in right hemisphere: preoperative, postoperative, and follow-up 18F-FET PET, and contrast-enhanced T1-weighted MRI. PET after surgery shows total resection of 18F-FET–positive area (white arrow) in preoperative scan, but flare phenomenon is noted in area frontal to resection cavity (red arrow). Follow-up PET scan after chemotherapy shows reduction of tracer uptake in that area. CE = contrast-enhanced; OP = operative.
DISCUSSION
The value of amino acid PET in the assessment of glioma resection has been investigated in several studies, which have consistently demonstrated that its use in this diagnostic question provides important additional information in comparison to MRI. In contrast to previous studies, the present study provides compelling new aspects on surgery-induced changes in 18F-FET accumulation and the occurrence of a flare phenomenon.
Concerning visual assessment of resection status, we observed an agreement between 18F-FET PET and MRI in 69% of the patients in this study (13% CR, 56% IR), a finding that is largely consistent with the results from Pirotte et al. (8), who reported agreement between postsurgical l-[methyl-11C]-methionine PET and MRI in 67% of the patients (23% CR, 44% IR). A study by Buchmann et al. reported stronger agreement between 18F-FET PET and MRI: 81% (44% CR, 37% IR) (11). In that study, the presence of residual tumor tissue on 18F-FET PET was not based on visual analysis but rather on quantitative evaluation of the BTV only, that is, the presence of tissue with an 18F-FET tumor-to-brain ratio of 1.6 or more compared with normal brain tissue. The authors reported no residual 18F-FET uptake (BTV, 0 mL) after surgery in 49% of the patients, a finding that is surprising since this was not observed in any patient in the current study or in the study by Müther et al. (10). This discrepancy may be explained by a different definition of the background region of interest (22), but it certainly raises questions about the comparability of the different studies.
In a recent experimental study on rat gliomas (13), we observed treatment-related 18F-FET uptake with a mean lesion-to-brain ratio of 2.0 ± 0.3 at the rim of the resection cavity, a value that is well above the limit of 1.6. In agreement with these animal experiments, in the current study we observed increased 18F-FET uptake near the resection cavity after surgery, and a lesion-to-brain ratio of more than 1.6 was noted in all patients (smallest BTV, 4 cm3). Our data suggest that reactive changes in 18F-FET uptake after surgery are a common phenomenon (Fig. 2) and should be carefully considered when assessing residual tumor tissue. We suggest that the determination of BTV based on a ratio of more than 1.6, compared with normal brain tissue, is not a reliable method for determining residual tumor volume in the early postoperative situation.
Interestingly, an increasing BTV after surgery occurred more frequently in group 1 than in group 2 (18 vs. 9 patients), suggesting that reactive changes in 18F-FET uptake after surgery are more pronounced in the first 2 wk after surgery than in weeks 3–4. This observation is in line with the rat glioma experiments mentioned above, which demonstrated a decrease in reactive changes of 18F-FET uptake 14 d after surgery.
A striking discovery of our study is the observation of a flare phenomenon for 18F-FET uptake after surgery, which has not been reported in previous studies (7,10,11). This phenomenon was found in 26% of patients and cannot be considered an exceptional observation. In 5 patients, flare was observed in the area of the preoperatively detectable tumor tissue, and in 6 patients, it was observed at distant sites that showed only a slightly increased 18F-FET accumulation in the preoperative 18F-FET PET images (Fig. 4; Supplemental Fig 1). Moreover, it occurred significantly more frequently in group B than in group A. Further follow-up, which was available for 4 patients, showed a decrease in 18F-FET uptake in the flare area during radiochemotherapy in 3 patients (Fig. 4) and a further increase in 18F-FET uptake corresponding to tumor progression in 1 patient (Supplemental Fig. 1).
Several hypotheses may help to explain this phenomenon. First, the flare phenomenon might be caused by reactive astrocytosis. This explanation appears unlikely, because in previous animal studies 18F-FET uptake in areas of reactive astrocytosis around the resection cavity was only moderately increased and not as pronounced as in the flare areas, which often were in remote regions (13). Another explanation may be a rapid tumor progression, which is not unusual in glioblastoma, but as the flare phenomenon occurred also in 2 cases of oligodendroglioma, this explanation also seems implausible. Thus, a more likely hypothesis is the assumption that surgical intervention stimulated the metabolic activity of infiltrating tumor tissue with low metabolic activity before surgery. Accumulative evidence suggests that the tissue response to surgical brain injury participates in the formation of recurrence-prone microenvironments (23,24). Experiments on a murine glioma resection-and-recurrence model demonstrated that surgical injury to astrocytes promotes tumor proliferation and migration (23,25). It is tempting, therefore, to speculate that 18F-FET PET could discover such types of tumor activation after surgery.
The results of this study are limited by the fact that the observed changes in 18F-FET PET after surgery were not histologically confirmed and not systematically evaluated by further follow-up. Furthermore, most patients had been treated previously, and it may not be correct to extrapolate these findings to patients undergoing initial resection of glioma. Therefore, further investigation and confirmation of these results by prospective studies are necessary. Nevertheless, reactive changes in 18F-FET PET at the rim of the resection cavities should be considered in postoperative scan readings because they are in line with experimental studies and because histologic clarification of these changes is difficult to perform for ethical reasons.
CONCLUSION
Our study confirms that 18F-FET PET adds valuable information in the assessment of patients with glioma after resection. Postoperative reactive changes at the rim of the resection cavity have to be considered, especially in the first 2 wk after surgery. In a considerable number of patients, a postoperative flare phenomenon was observed that needs further investigation.
DISCLOSURE
No potential conflict of interest relevant to this article was reported.
KEY POINTS
QUESTION: Does resection of cerebral gliomas lead to increased 18F-FET accumulation in reactive tissue?
PERTINENT FINDINGS: In a retrospective study, 18F-FET uptake was analyzed before and after surgery in 43 patients with cerebral gliomas. A moderate but significant increase in 18F-FET uptake was noted at the rim of the resection cavity. Unexpectedly, a postoperative flare phenomenon was observed in 26% of the patients, possibly reflecting activation of residual tumor tissue by surgical injury.
IMPLICATIONS FOR PATIENT CARE: 18F-FET PET is helpful in assessing glioma resection, but the intervention can also lead to increased tracer uptake, which must be considered when assessing the extent of glioma resection.
Acknowledgments
We thank Erika Wabbals, Silke Grafmueller, and Sascha Rehbein for technical assistance with radiosynthesis of 18F-FET, and we thank Silke Frensch, Suzanne Schaden, Natalie Judov, Kornelia Frey, and Trude Plum for technical assistance with the PET measurements.
Footnotes
Published online Jan. 31, 2020.
- © 2020 by the Society of Nuclear Medicine and Molecular Imaging.
REFERENCES
- Received for publication October 23, 2019.
- Accepted for publication January 14, 2020.


Jump to section
Related Articles
Cited By...
- No citing articles found.