


Abstract
The first Biograph Vision PET/CT system (Siemens Healthineers) was installed at the University Medical Center Groningen. Improved performance of this system could allow for a reduction in activity administration or scan duration. This study evaluated the effects of reduced scan duration in oncologic 18F-FDG PET imaging on quantitative and subjective imaging parameters and its influence on clinical image interpretation. Methods: Patients referred for a clinical PET/CT scan were enrolled in this study, received a weight-based 18F-FDG injected activity, and underwent list-mode PET acquisition at 180 s per bed position (s/bp). Acquired PET data were reconstructed using the vendor-recommended clinical reconstruction protocol (hereafter referred to as “clinical”), using the clinical protocol with additional 2-mm gaussian filtering (hereafter referred to as “clinical+G2”), and—in conformance with European Association of Nuclear Medicine Research Ltd. (EARL) specifications—using different scan durations per bed position (180, 120, 60, 30, and 10 s). Reconstructed images were quantitatively assessed for comparison of SUVs and noise. In addition, clinically reconstructed images were qualitatively evaluated by 3 nuclear medicine physicians. Results: In total, 30 oncologic patients (22 men, 8 women; age: 48–88 y [range], 67 ± 9.6 y [mean ± SD]) received a single weight-based (3 MBq/kg) 18F-FDG injected activity (weight: 45–123 kg [range], 81 ± 15 kg [mean ± SD]; activity: 135–380 MBq [range], 241 ± 47.3 MBq [mean ± SD]). Significant differences in lesion SUVmax were found between the 180-s/bp images and the 30- and 10-s/bp images reconstructed using the clinical protocols, whereas no differences were found in lesion SUVpeak. EARL-compliant images did not show differences in lesion SUVmax or SUVpeak between scan durations. Quantitative parameters showed minimal deviation (∼5%) in the 60-s/bp images. Therefore, further subjective image quality assessment was conducted using the 60-s/bp images. Qualitative assessment revealed the influence of personal preference on physicians’ willingness to adopt the 60-s/bp images in clinical practice. Although quantitative PET parameters differed minimally, an increase in noise was observed. Conclusion: With the Biograph Vision PET/CT system for oncologic 18F-FDG imaging, scan duration or activity administration could be reduced by a factor of 3 or more with the use of the clinical+G2 or the EARL-compliant reconstruction protocol.
PET integrated with CT is a noninvasive imaging method widely used in oncology (1–3) and many other indications, providing both anatomic information and metabolic information (4). In oncology, PET/CT is a rapidly evolving technique for diagnosis, cancer staging, radiation therapy planning, prognosis, and treatment response monitoring (1,3,5).
Recently introduced PET/CT systems are equipped with silicon photomultiplier–based detectors with improved detection capabilities that might contribute to enhanced diagnostic performance but could also allow for a reduction in activity administration or scan duration (3,6–8). The first silicon photomultiplier–based detector Biograph Vision PET/CT system (Siemens Healthineers) was installed at the Department of Nuclear Medicine and Molecular Imaging at the University Medical Center Groningen in May 2018.
Despite its frequent and widespread use in oncologic imaging, PET/CT is associated with some radiation exposure, particularly relevant for young lymphoma patients (9). A pilot phantom study investigating the possibility of activity reduction using the Biograph Vision PET/CT system (Supplemental Tables 1 and 2; supplemental materials are available at http://jnm.snmjournals.org) (6) showed that 18F-FDG administration can be decreased by a factor of approximately 8 for scanning at 60 s per bed position (s/bp) using European Association of Nuclear Medicine Research Ltd. (EARL)–compliant reconstructions (1,10). Lowering the injected activity results in a decrease in radiation exposure for young patients as well as medical staff but can also reduce 18F-FDG costs. On the other hand, shorter scan times can increase patient throughput, in turn increasing cost-effectiveness.
To our knowledge, scan duration or activity optimization has not yet been explored for the Biograph Vision PET/CT system. Therefore, to further clinically validate the findings obtained from our phantom measurements, the effects of scan duration or administered activity reduction in 18F-FDG PET imaging on quantitative and subjective imaging parameters and its influence on clinical image interpretation were evaluated in this study.
MATERIALS AND METHODS
Patient Population
Patients referred for oncologic clinical PET/CT were enrolled in this prospective study. For optimal comparison of quantitative parameters, 3 different malignancies were selected to form homogeneous groups: non–small cell lung carcinoma (NSCLC), esophageal cancer, and lymphoma. Patients with a glucose level of greater than or equal to 198 mg/dL before 18F-FDG administration were excluded from participation in this study.
According to the Dutch Medical Research Involving Human Subjects Act, the local medical ethics committee exempted approval without additional procedures (waiver number: METc2017/489). No additional informed consent was required. Patient information was anonymized before data analysis.
Imaging Protocol
In accordance with European Association of Nuclear Medicine guidelines for tumor imaging, patients received a weight-based bolus injection of 18F-FDG activity (3 MBq/kg) via intravenous infusion (1,11). The syringe and catheter were not measured after the injection for any residual activity. Approximately 60 min after injection (mean ± SD, 62 ± 5), patients underwent a list-mode PET/CT imaging protocol on the Biograph Vision system.
Patients were instructed to avoid strenuous exercise for 24 h and to fast for at least 4–6 h before 18F-FDG activity administration. At the time of 18F-FDG injection, blood glucose levels measured less than or equal to 198 mg/dL. A standard low-dose CT (an x-ray tube current of 43 mAs, a tube voltage of 100 kV, and a spiral pitch factor of 1) scan was acquired from the vertex to the midthigh and used for attenuation correction. A consecutive emission PET scan was acquired at 180 s/bp in list mode. All scans were obtained during normal breathing.
Subsequently, PET list-mode data were reprocessed to produce additional sets of sinograms: 10, 30, 60, and 120 s/bp. Three different reconstruction protocols were used to reconstruct the PET images for each of the 5 scan durations. The vendor-recommended clinical reconstruction protocol involved an ordinary Poisson ordered-subset expectation maximization 3-dimensional iterative algorithm (12) using 4 iterations, 5 subsets, time-of-flight application, and resolution modeling, without filtering (hereafter referred to as “clinical”) and with 2-mm gaussian filtering (hereafter referred to as “clinical+G2”). The resulting image size was 440 × 440, with a voxel size of 1.6 × 1.6 × 1.5 mm. In addition, EARL1- and EARL2-compliant reconstructions (1,10) were obtained using 3-dimensional ordinary Poisson ordered-subset expectation maximization, time-of-flight application, 4 iterations, 5 subsets, resolution modeling, and gaussian filters of 7 and 5 mm, respectively. The resulting image size was 220 × 220, with a voxel size of 3.3 × 3.3 × 1.5 mm. All scans were acquired during normal breathing without respiratory motion gating or correction.
Quantitative Image Analysis
Reconstructed PET images were analyzed using the quAntitative onCology moleCUlar Analysis suiTE (ACCURATE), version v03012019 (13). Two semiautomated tumor delineation methods were used to segment and analyze individual lesions per image (with a maximum of the 10 hottest lesions). The first semiautomated method was based on a fixed SUV threshold of 4.0 g/mL (SUV = 4), whereas the other method, the so-called majority vote (MV2), was based on agreement in tumor delineation between multiple semiautomated methods (14). For clarity, an illustrative clinical image example and a schematic overview of the MV2 method are shown in Supplemental Figures 1 and 2, respectively. If the semiautomated methods were incapable of delineating the lesion, then a 1-mL spheric volume of interest (VOI) was manually placed on (the hottest part in) the lesion. Analyses were performed using SUVmax and SUVpeak measurements derived from the 2 semiautomated delineation methods or manual VOI placement.
In addition, for each image, a 3-mL spheric VOI was placed in the liver, where activity distribution was almost uniform, as a reference and to characterize image noise using the SD of the voxel values within the VOI.
Qualitative Image Analysis
Images obtained at 180 s/bp and at a shorter scan duration (i.e., 60 s/bp) using the clinical reconstruction protocols were qualitatively evaluated. The 60-s/bp data were chosen because, at this shorter duration, the images were quantitatively still comparable to those at 180 s/bp (as will be shown later). Three experienced nuclear medicine physicians with 15, 5, and 10 y of experience in interpreting PET scans (Andor W.J.M. Glaudemans, Gilles N. Stormezand, and Walter Noordzij, respectively) independently reviewed the reconstructed images using a dedicated syngo.via VB30 (Siemens Healthineers) workstation. Interpreters were not unaware of scan duration. Images reconstructed according to the clinical protocol were evaluated first. After 4 wk, images reconstructed according to the clinical+G2 protocol were evaluated. Images were scored on the basis of 5-point Likert scales with regard to the following characteristics: image noise, lesion margin demarcation, and overall image quality. In addition, the number of avid 18F-FDG lesions per image was counted to assess possible missed lesions in shorter scan durations, and TNM staging was performed.
Statistical Analysis
Analyses were performed with SPSS Statistics, version 25.0 (IBM Corp.). For each reconstruction method, the lesion SUVs at each scan duration (120, 60, 30, and 10 s/bp) were compared with the lesion SUVs of images acquired at 180 s/bp using a repeated-measures ANOVA with post hoc Bonferroni adjustment for pairwise comparison. A P value of less than 0.05 was considered significant. Pairwise comparisons were also performed to assess the differences between each lesion’s SUVmax derived from the 180-s/bp images and shorter scan durations.
All quantitative analyses were performed once for the quantitative parameters obtained using the SUV = 4 semiautomated delineation method and once for the parameters obtained using the MV2 semiautomated delineation method.
Furthermore, qualitative Likert scale scores for the images were compared pairwise using a 2-tailed paired-samples t test; in addition, interinterpreter agreement was evaluated using κ statistics.
RESULTS
A total of 30 oncology patients (22 men, 8 women; age: 48–88 y [range], 67 ± 9.6 y [mean ± SD]) received a single weight-based bolus of 18F-FDG injected activity (weight: 45–123 kg [range], 81 ± 15 kg [mean ± SD]; activity: 135–380 MBq [range], 241 ± 47.3 MBq [mean ± SD]) via intravenous infusion. For optimal quantitative comparison, 3 homogeneous groups were formed and consisted of 15 NSCLC patients, 9 patients with lymphoma, and 6 patients with esophageal cancer. Table 1 shows relevant demographic and clinical information.
Demographic and Clinical Data for All Included Patients
Quantitative Image Analysis
For each of the 30 patients, a total of 20 images were obtained (4 reconstruction methods times 5 scan durations times 30 patients, resulting in 600 images). Tumor segmentations were performed on each of the 600 images individually. In total, 4,076 tumor segmentations were made; approximately 100 tumor lesions were segmented using 2 semiautomated segmentation methods (SUV = 4 and MV2) for each reconstructed scan duration and each reconstruction method, resulting in 40 segmentations per lesion. A total of 352 lesion segmentations could not be made by the SUV = 4 method, whereas the MV2 method was unsuccessful in capturing 1,155 lesion segmentations. The median lesion SUVmax was 8.7 (range, 1.7–57), and the median lesion SUVpeak was 3.9 (range, 0.2–59).
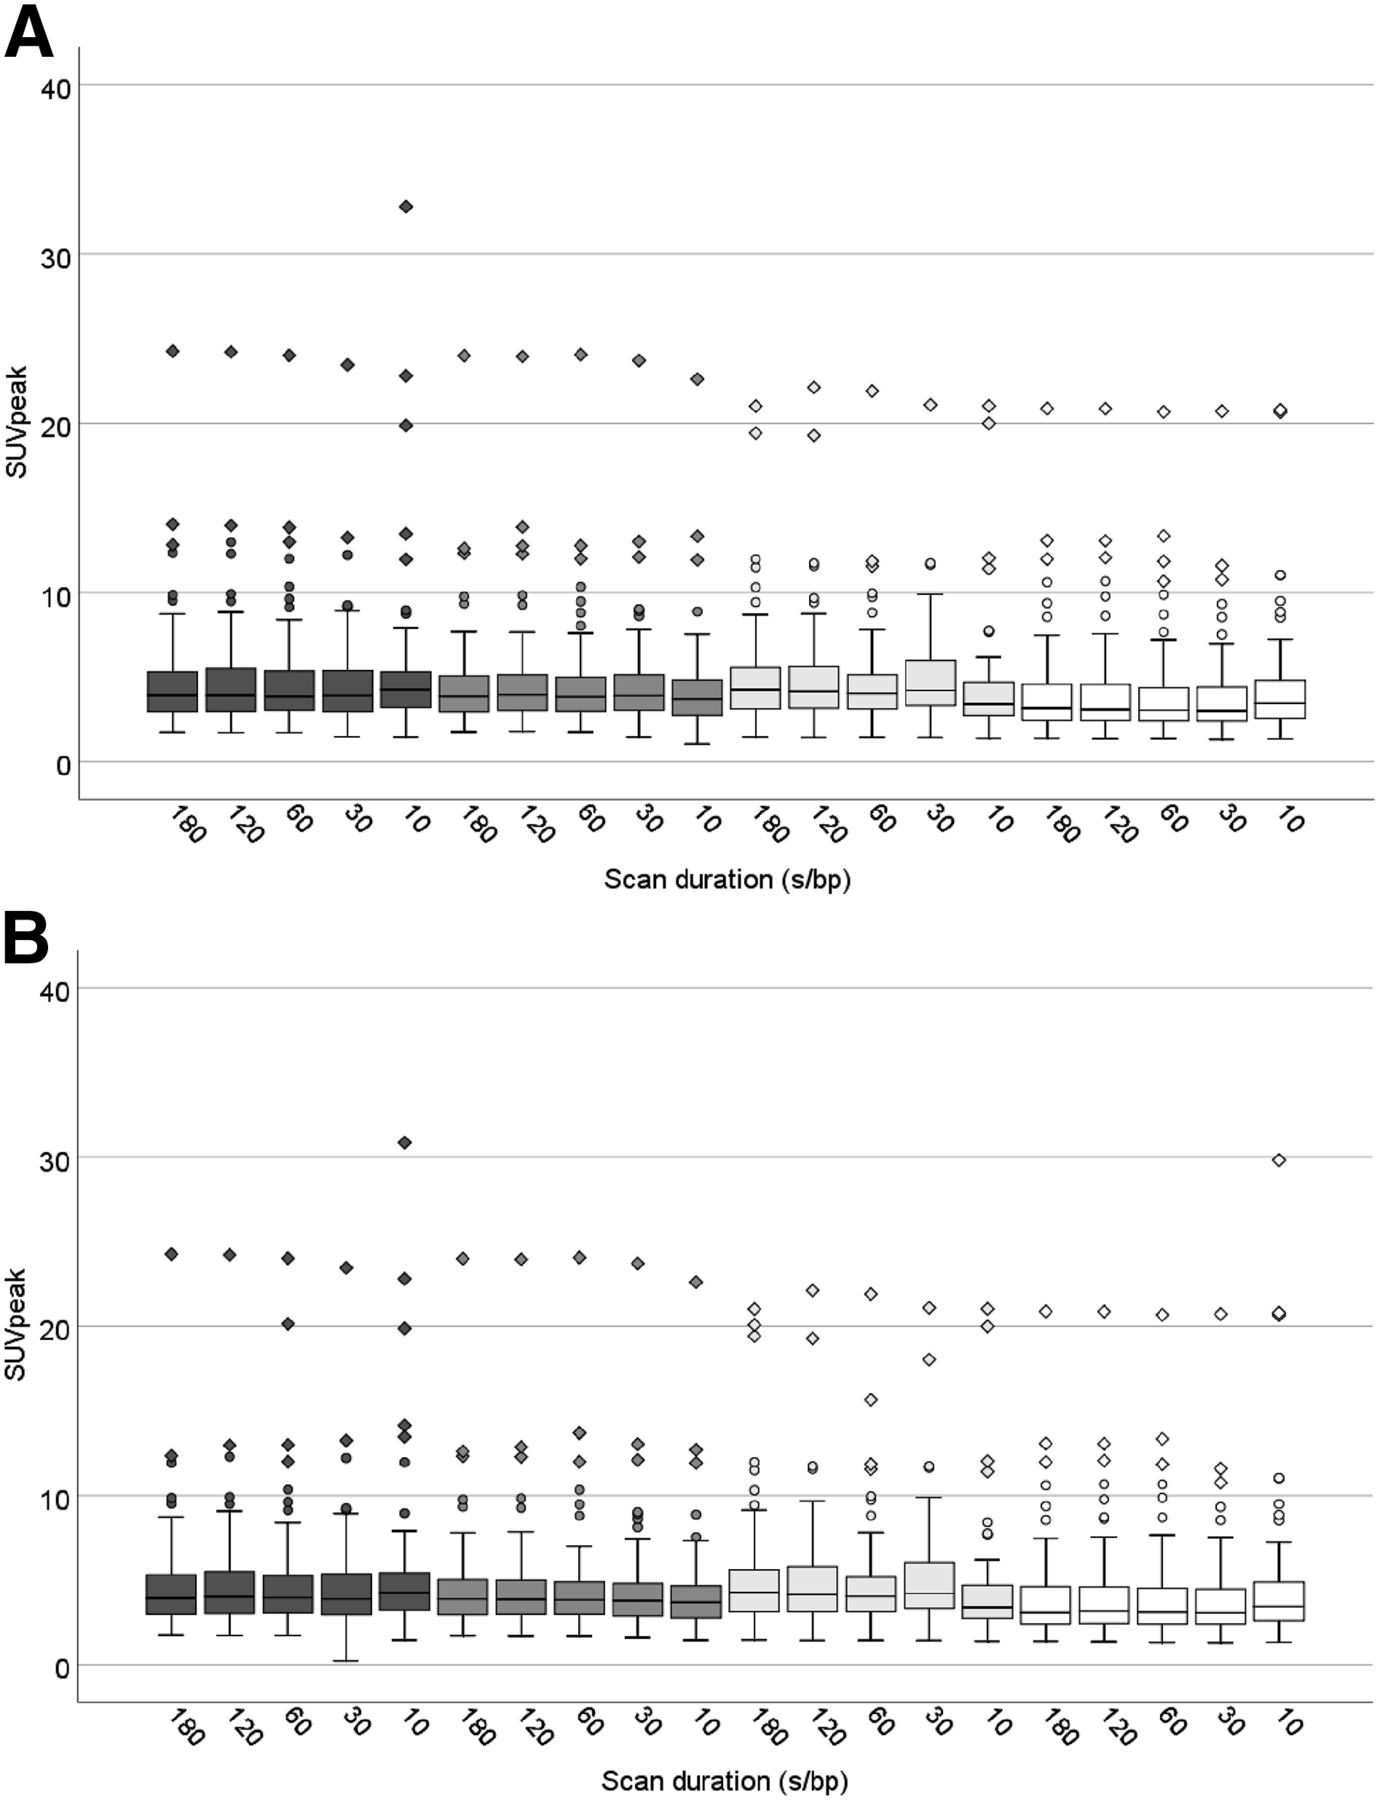
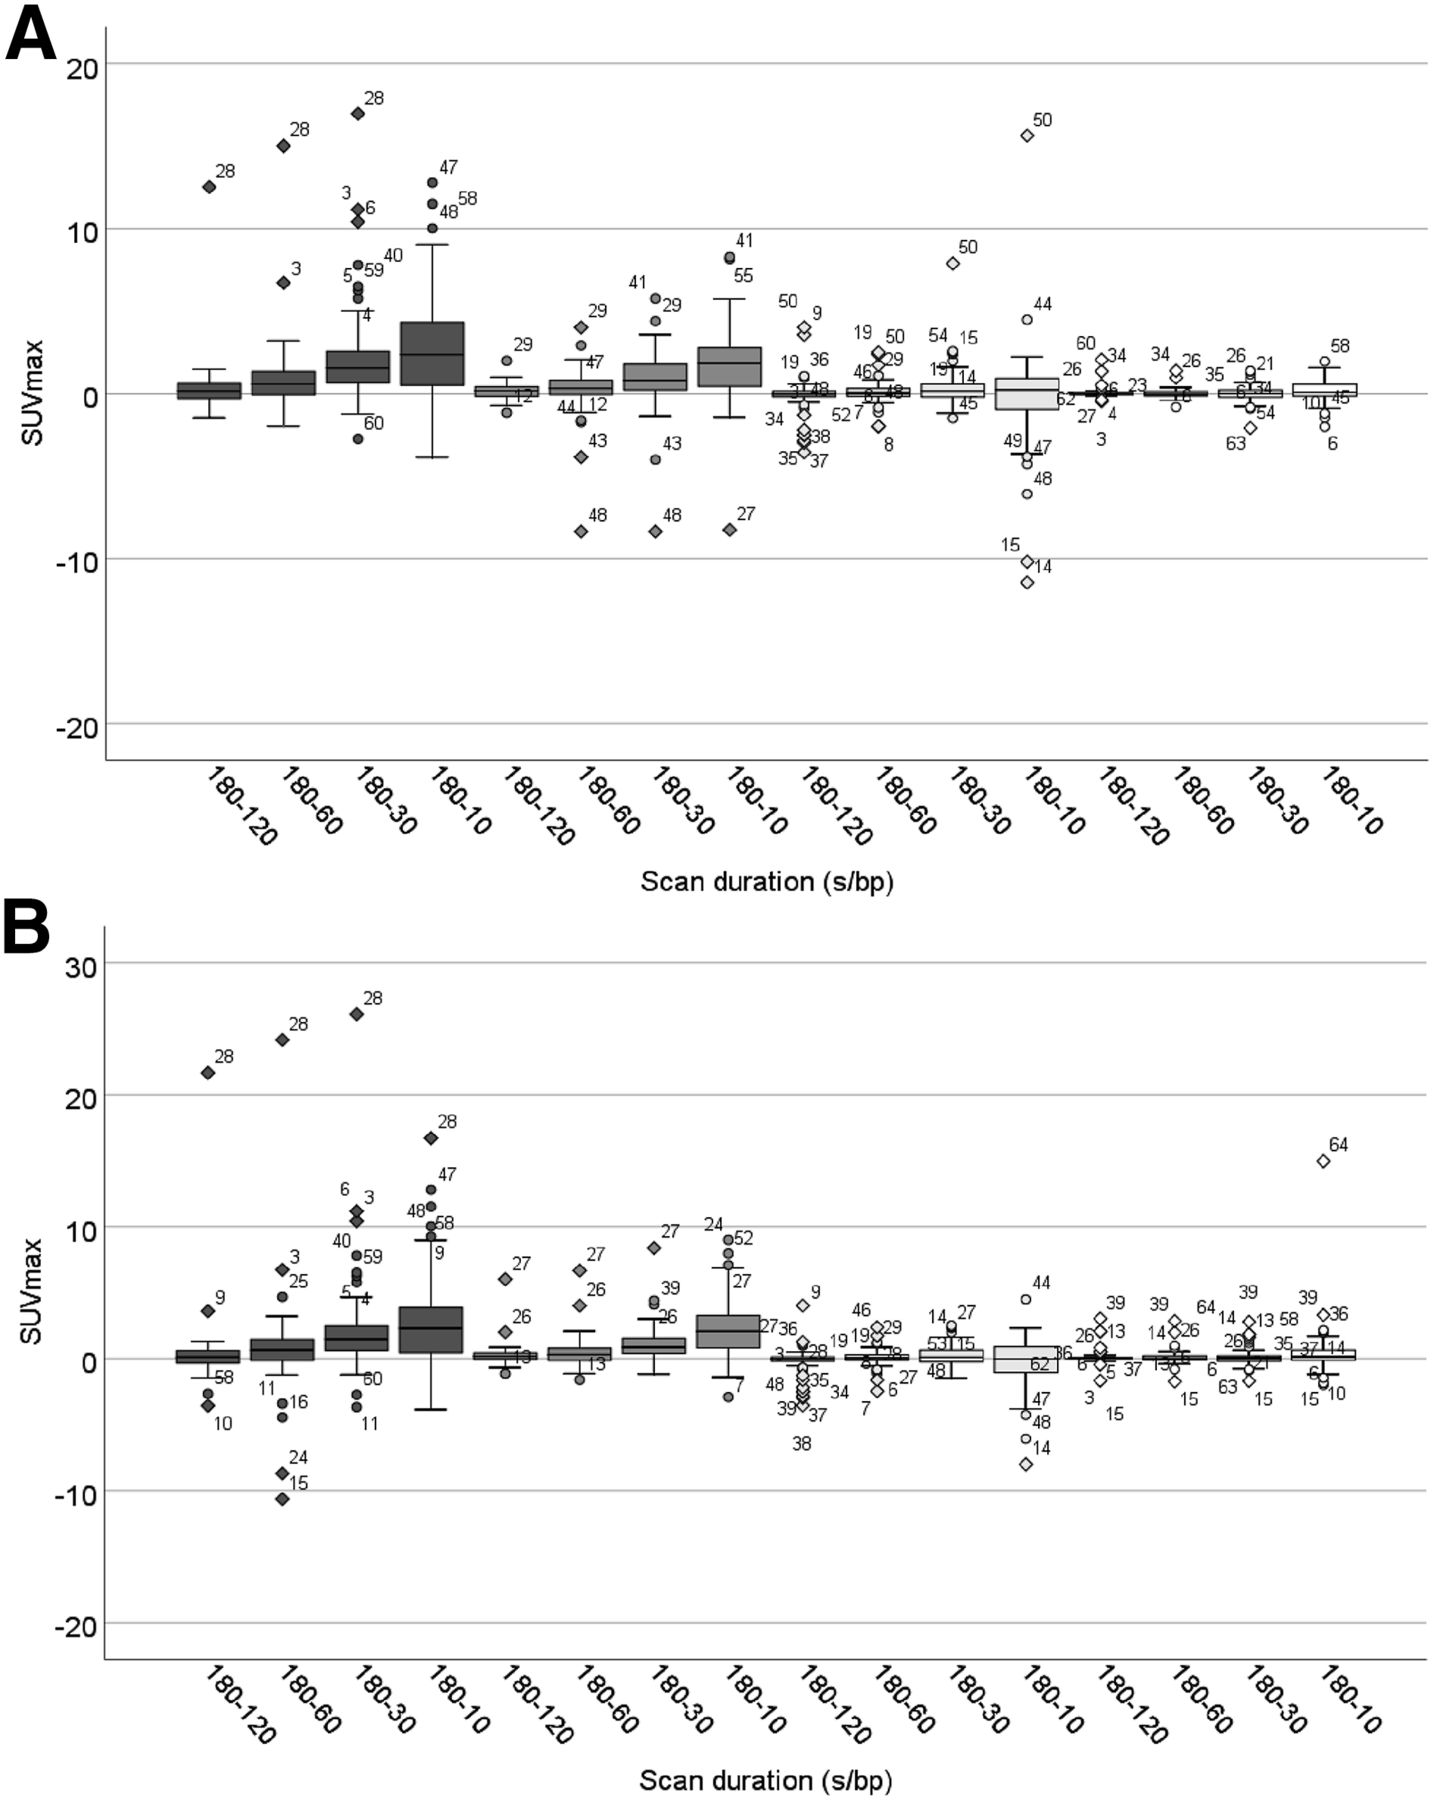
The results of the lesion SUVmax comparisons between different scan durations obtained using the SUV = 4 and the MV2 semiautomated lesion delineation methods for the 4 different reconstruction protocols are shown in box plots in Figure 1. Similarly, the results of the lesion SUVpeak comparisons are shown in Figure 2. Differences in SUVmax comparisons per lesion between measurements derived from the 180-s/bp images and measurements obtained at shorter scan durations for the 4 different reconstruction protocols, delineated using both semiautomated methods, are shown in box plots in Figure 3.

Box plots showing spread of SUVmax obtained from clinical (dark gray), clinical+G2 (gray), EARL2-compliant (light gray), and EARL1-compliant (white) image reconstructions at different scan durations. Quantitative analyses were performed using SUV = 4 (A) and MV2 (B) semiautomated lesion delineation methods. Outliers are illustrated with circles, and diamonds represent extreme outliers. Single asterisks and double asterisks indicate significant differences between scan durations at P < 0.05 and P < 0.001, respectively.

Box plots showing spread of SUVpeak obtained from clinical (dark gray), clinical+G2 (gray), EARL2-compliant (light gray), and EARL1-compliant (white) image reconstructions at different scan durations. Quantitative analyses were performed using SUV = 4 (A) and MV2 (B) semiautomated lesion delineation methods. Outliers are illustrated with circles, and diamonds represent extreme outliers.

Box plots showing spread of SUVmax differences per lesion between 180 s/bp and shorter scan durations obtained from clinical (dark gray), clinical+G2 (gray), EARL2-compliant (light gray), and EARL1-compliant (white) image reconstructions. Quantitative analyses were performed using SUV = 4 (A) and MV2 (B) semiautomated lesion delineation methods. Outliers are illustrated with circles, diamonds represent extreme outliers, and numbers indicate lesion numbers.
The median lesion SUVmax obtained at shorter scan durations—120, 60, 30, and 10 s/bp—were each directly compared with the median lesion SUVmax obtained from the 180-s/bp images. These comparisons were done twice for both semiautomated delineation methods. The results are shown in Table 2. This clarifies the difference in median SUVmax between the shorter scan durations and the 180-s/bp images.
Median Lesion SUVmax Scores Derived From Images Obtained Using Clinical and Clinical+G2 Reconstruction Settings*
When the clinical and clinical+G2 reconstruction settings were used, significant differences in lesion SUVmax were found between the 180-s/bp images (P < 0.01; 95% CI, 0.50–5.91) and the 10-s/bp images (P < 0.001; 95% CI, 0.85–3.65) when delineated with the SUV = 4 method. In addition, when the clinical+G2 reconstruction setting was used, significant differences in lesion SUVmax were found between the 60-s/bp images and the 10-s/bp images (P < 0.05; 95% CI, 0.24–3.42).
When delineations were performed with the MV2 method, significant differences were found in lesion SUVmax in the clinically reconstructed images between the 180-s/bp images and both the 30-s/bp images (P < 0.05; 95% CI, 0.12–4.10) and the 10-s/bp images (P < 0.001; 95% CI, 0.99–5.85). Significant differences were also found between the 120-s/bp images and both the 30-s/bp images (P < 0.05; 95% CI, 0.30–3.38) and the 10-s/bp images (P < 0.05; 95% CI, 0.47–5.83) as well as between the 60-s/bp images and the 30-s/bp images (P < 0.001; 95% CI, 0.43–2.09). Between the images obtained using the clinical+G2 reconstruction method, significant differences in lesion SUVmax were found between the 180-s/bp images and the 10-s/bp images (P < 0.05; 95% CI, 0.02–0.28) as well as between the 120-s/bp images and the 10-s/bp images (P < 0.05; 95% CI, 0.31–3.85) and between the 60-s/bp images and both the 30-s/bp images (P < 0.001; 95% CI, 0.39–1.05) and the 10-s/bp images (P < 0.05; 95% CI, 0.21–4.20).
No significant differences were found between lesion SUVpeak at different scan durations. Furthermore, EARL1- and EARL2-compliant image reconstructions did not show any significant differences in SUVmax or SUVpeak in comparisons between all different scan durations.
Qualitative Image Analysis
From the quantitative analysis, the shorter scan duration that still quantitatively resembled the values obtained from the 180-s/bp images reconstructed according to the clinical and clinical+G2 protocols (deviation of ∼5%) was found to be the 60-s/bp option (Fig. 1; Table 2). Therefore, further clinical qualitative evaluations were conducted with the 180-s/bp images and the 60-s/bp images. For illustrative purposes, Figure 4 shows an example of patient PET images acquired using the 4 reconstruction protocols at different scan durations ranging from 180 s/bp to 10 s/bp. Figures 5 and 6 show examples of reconstructed patient PET images obtained using the 4 different reconstruction settings at 180 s/bp versus 60 s/bp.
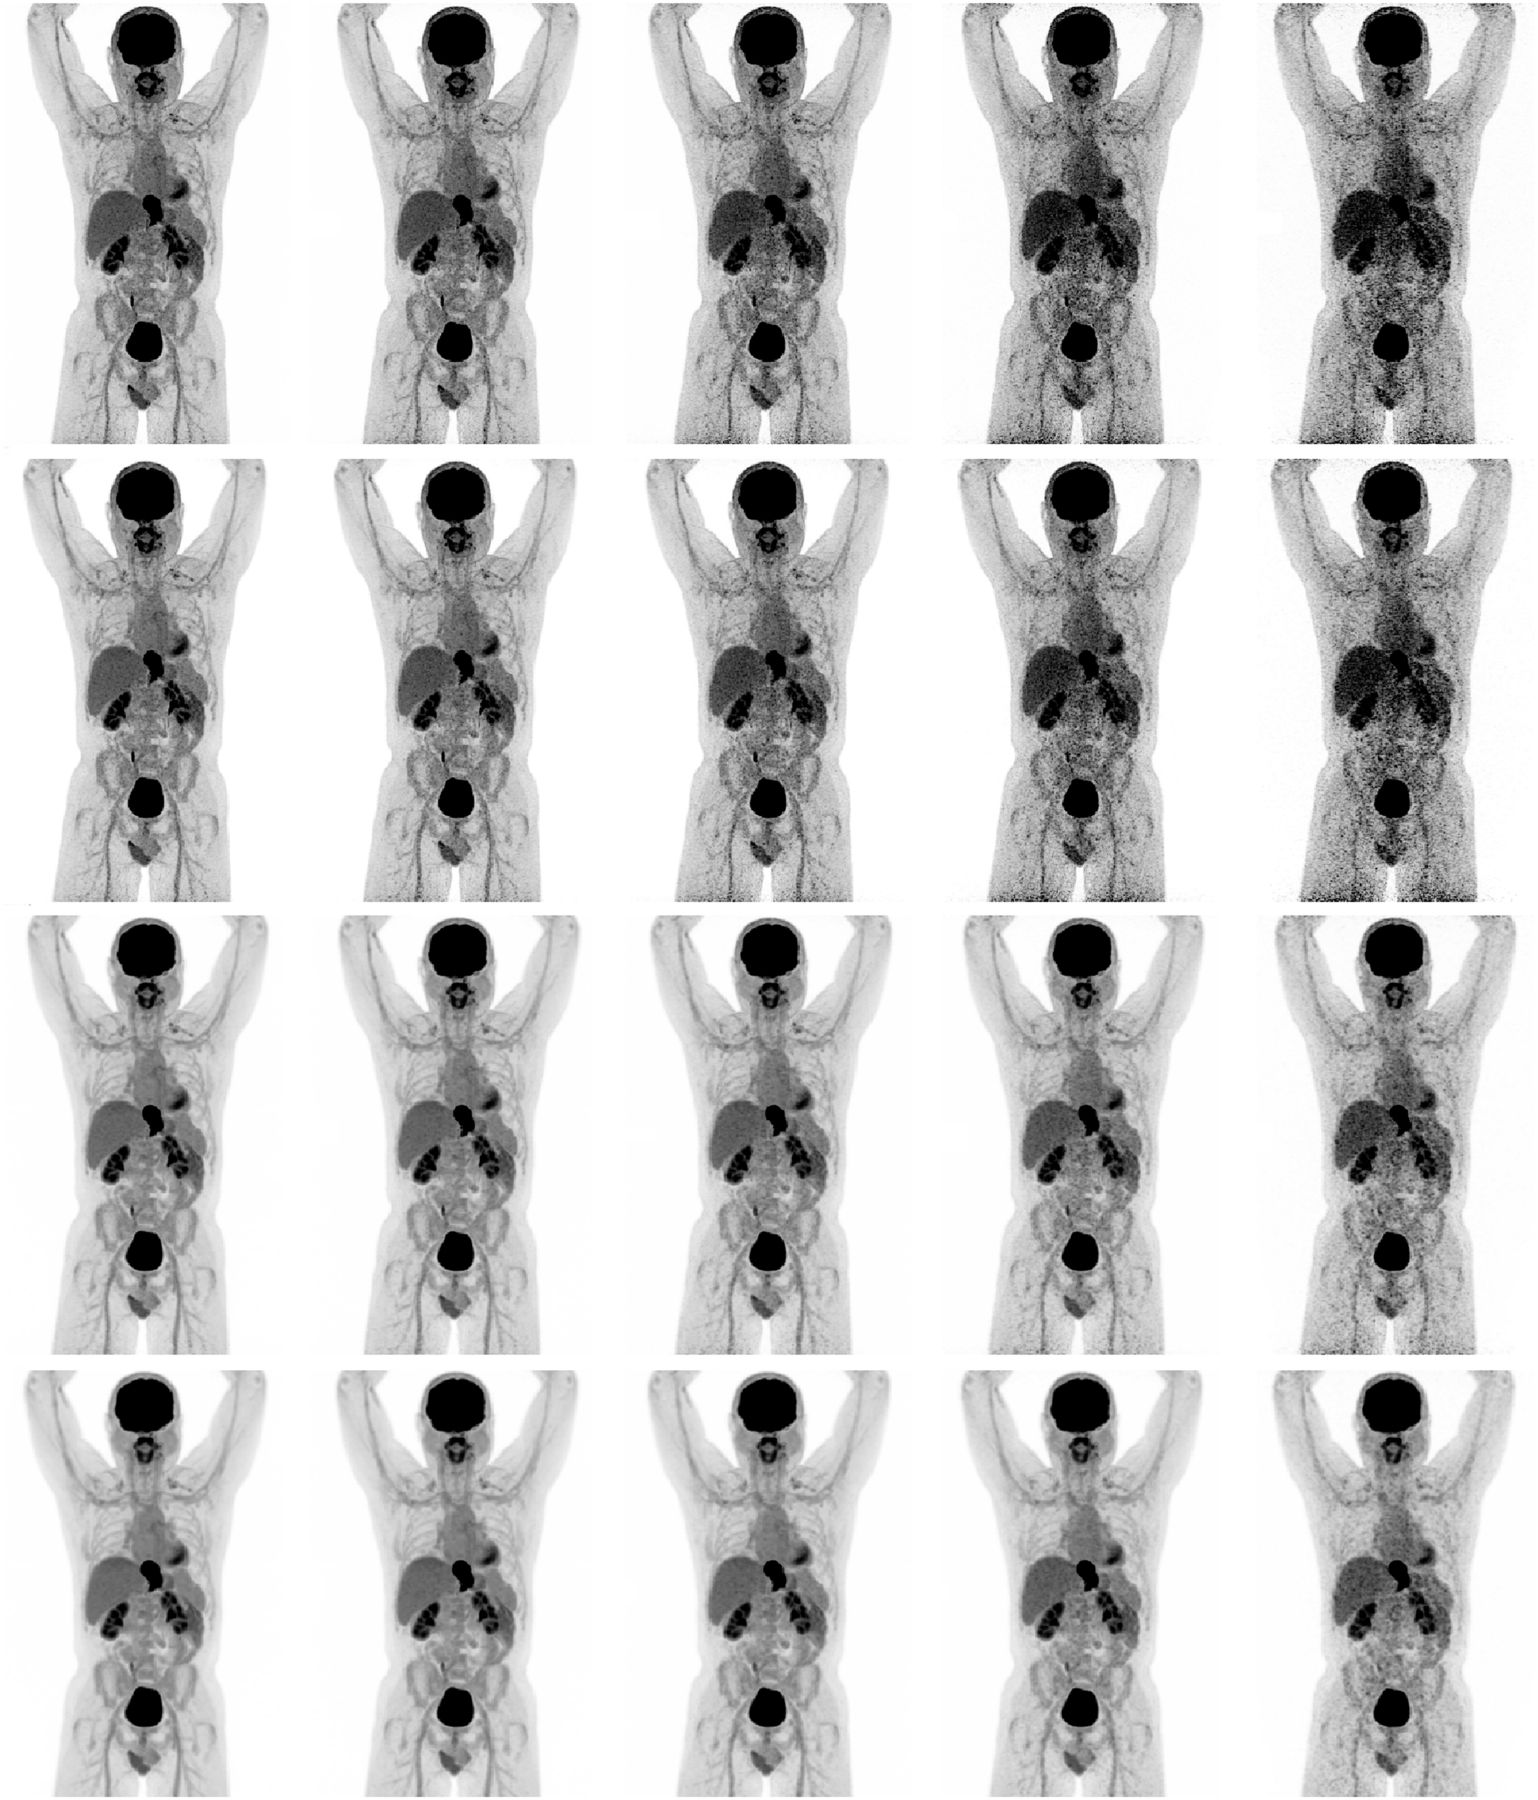
Maximum-intensity-projection PET images of 52-y-old man (weight, 86 kg) with esophageal cancer. Images were acquired at 180, 120, 60, 30, and 10 s/bp (from left to right, respectively) using clinical, clinical+G2, EARL2-compliant, and EARL1-compliant reconstruction protocols (from top to bottom, respectively).
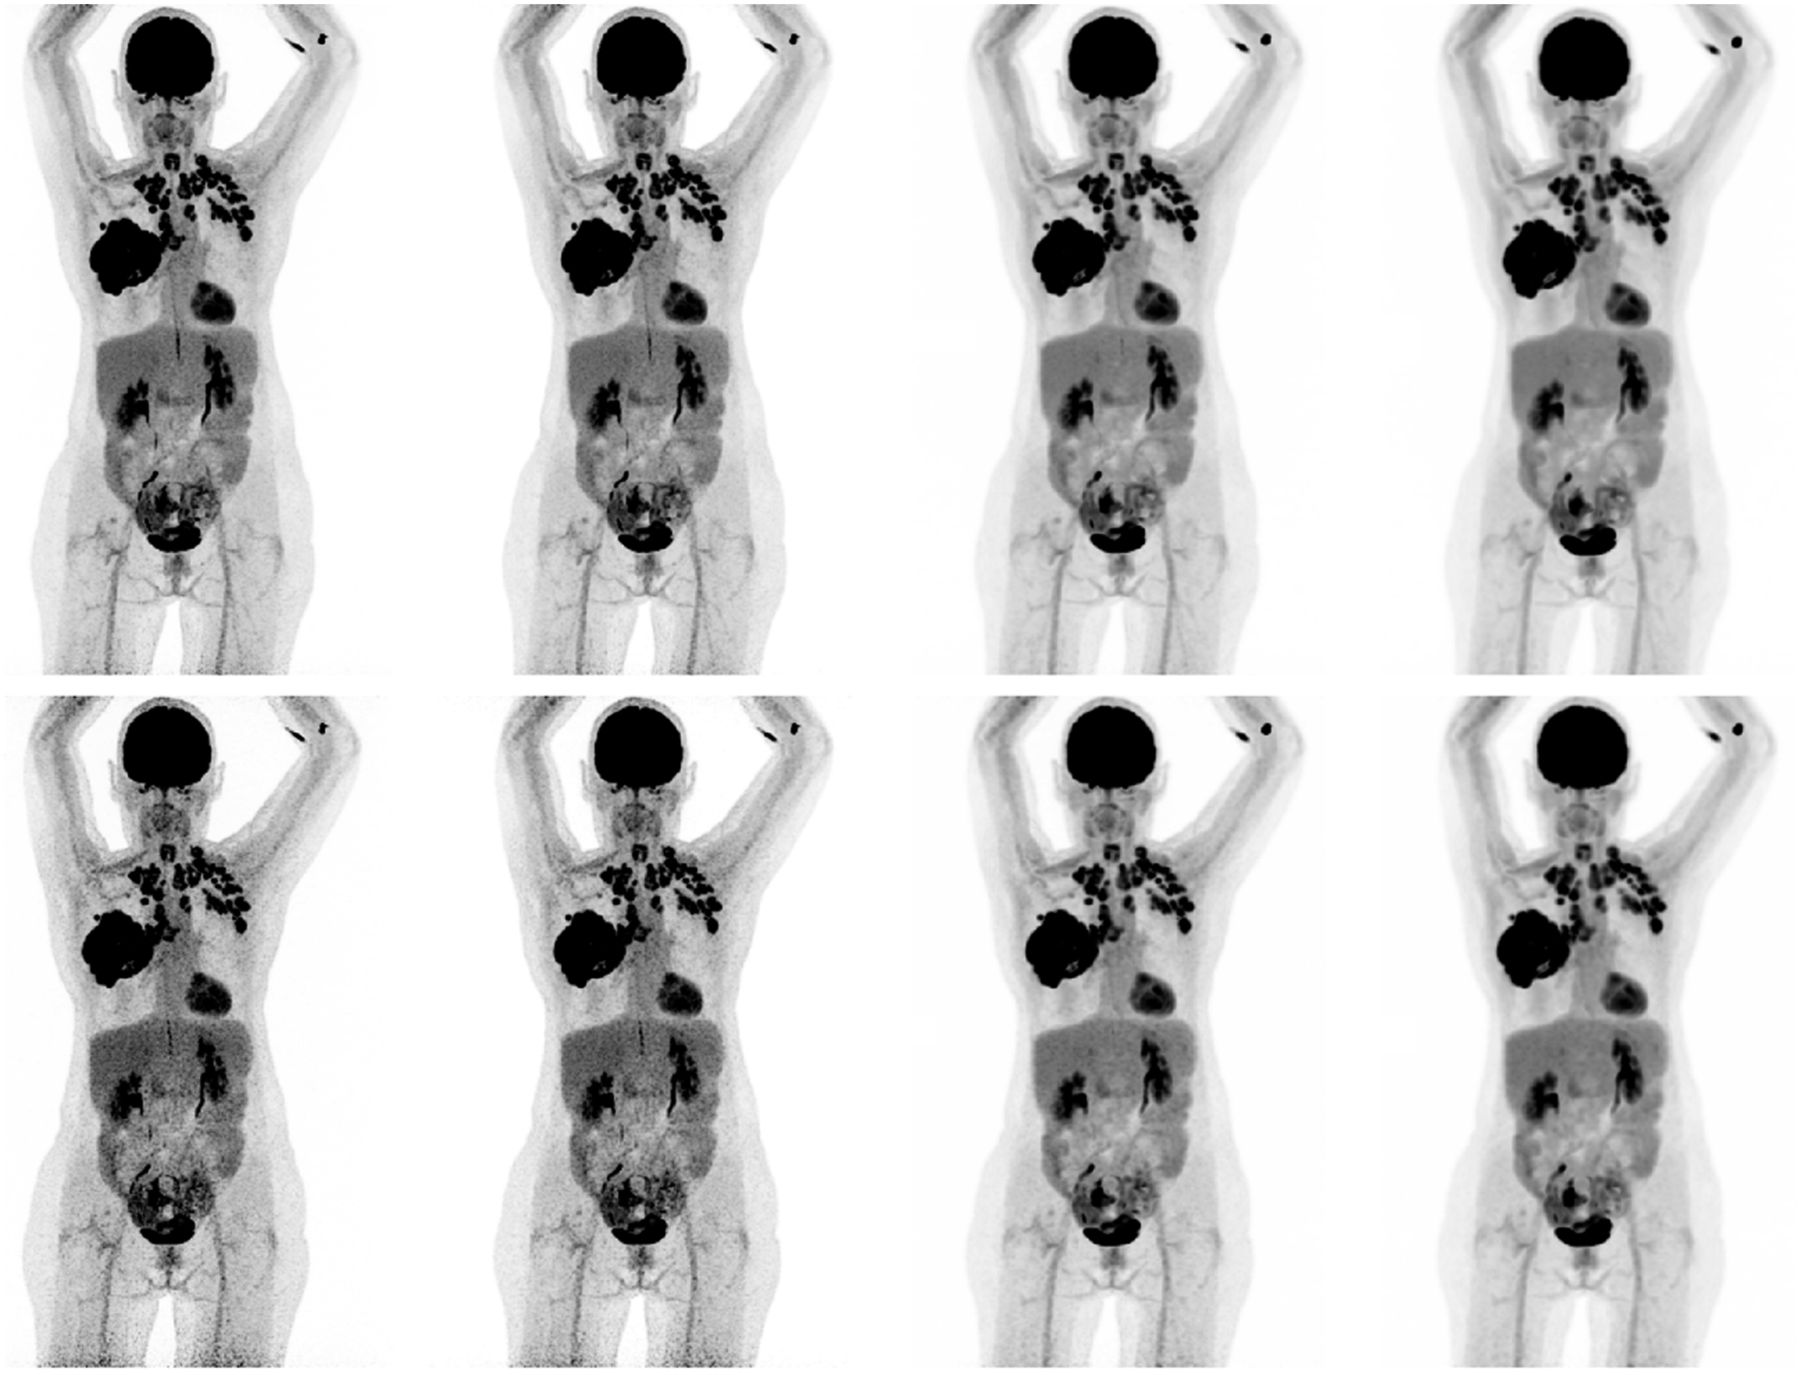
Maximum-intensity-projection PET images of 62-y-old woman (weight, 68 kg) with metastasized NSCLC. Images were acquired at 180 s/bp (top row) and 60 s/bp (bottom row) and reconstructed using clinical, clinical+G2, EARL2-compliant, and EARL1-compliant protocols (from left to right, respectively).

Maximum-intensity-projection PET images of 61-y-old man (weight, 77 kg) with metastasized NSCLC. Images were acquired at 180 s/bp (top row) and 60 s/bp (bottom row) and reconstructed using clinical, clinical+G2, EARL2-compliant, and EARL1-compliant protocols (from left to right, respectively).
All 180-s/bp images reconstructed using the clinical reconstruction protocol were scored significantly higher than the images acquired at 60 s/bp on noise, lesion demarcation, and overall image quality (P < 0.001; 95% CI of 2.25–2.55, 2.03–2.35, and 2.20–2.58, respectively). When the clinical+G2 reconstruction protocol was used, images obtained at 180 s/bp were scored higher than the 60-s/bp images as well. In addition, the filtered images were more highly valued with respect to their unfiltered counterparts (P < 0.001; 95% CI of 2.87–3.20, 3.02–3.24, and 3.16–3.35, respectively). For images reconstructed according to the clinical protocol, the Fleiss κ statistics did not show significant interinterpreter agreement. For the clinically reconstructed images with additional 2-mm filtering, interinterpreter agreement was good regarding the evaluation of noise, lesion demarcation, and overall image quality, with κ values of 0.65 (P < 0.001; 95% CI, 0.57–0.74), 0.64 (P < 0.001; 95% CI, 0.56–0.73), and 0.72 (P < 0.001; 95% CI, 0.64–0.81), respectively.
With regard to the images reconstructed according to the clinical protocol, in 5 of 30 cases, reducing the scan duration from 180 s/bp to 60 s/bp resulted in missed lesions, changing the TNM staging of the disease. In 2 of these cases, the change in TNM staging would have influenced the choice of therapy. In these 2 cases, 2 NSCLC patients, the missed lesions were specifically a contralateral lung nodule in 1 patient and a distant liver metastasis in the other. There was no interinterpreter agreement on exchanging the 180-s/bp images for the shorter acquisition time, since the interpreting physicians were willing to exchange the 180-s/bp images for the 60-s/bp images in 27, 8, and 23 cases, respectively.
Concerning the images reconstructed using the clinical+G2 protocol, in 1 of 30 cases, reducing the scan duration from 180 s/bp to 60 s/bp resulted in a missed lesion, changing the TNM staging of the disease. This missed lesion would not have had any influence on the therapy choice for this patient, as it was 1 of 3 small locoregional lymph node metastases from a primary esophageal carcinoma. There was no interinterpreter agreement on exchanging the 180-s/bp images for the shorter acquisition time, since the interpreting physicians were willing to exchange the 180 s-bp images for the 60-s/bp images in 13, 24, and 21 cases, respectively.
The results of the noise quantification through calculation of the coefficient of variance obtained from the 3-mL liver VOIs in each image are shown in Figure 7. Here, a difference in the amount of image noise between images obtained at 180 s/bp and images obtained at 60 s/bp can be observed for all 4 reconstruction protocols.

Liver coefficient of variance (COV) obtained from clinical (black), clinical+G2 (gray), EARL2-compliant (light gray), and EARL1-compliant (white) image reconstructions at 180 s/bp (left column) vs. 60 s/bp (right column).
DISCUSSION
In the present study, we explored the effect of scan time reduction on quantitative PET image parameters and image quality using the digital Biograph Vision PET/CT system. Administered 18F-FDG activity can be adjusted proportionally to shorter scan times per bed position (with an added 10% for compensation of lower noise-equivalent count rates per megabecquerel at higher activity concentrations) (5). The results obtained using the clinical protocols suggest that with a minimal bias (∼5%) for quantitative image parameters, reducing scan time or activity by a factor of 3 when using the clinical and clinical+G2 reconstruction protocols is feasible. When EARL-compliant reconstructions are applied, even further reductions are potentially achievable (6).
The quality of PET images obtained at a reduced scan duration was evaluated by 3 nuclear medicine physicians to assess its impact in clinical practice. From this evaluation it became apparent that personal preference is an essential element contributing to physicians’ willingness to adopt the shorter scan duration for diagnosing in clinical practice. Although quantitative PET parameters differed minimally, a substantial increase in noise was observed (Fig. 7). The extent to which this increase in noise is disturbing to physicians is decisive for the scoring of image quality and for the consideration of working with the shorter scan duration. The addition of a small gaussian filter of 2 mm to the reconstruction protocol in the 60-s/bp image setting diminished the influence of image noise without notably affecting the apparent spatial resolution (15).
With the clinical+G2 reconstruction protocol, a reduction of scan time or injected activity could have led to downstaging in only 1 of 30 cases, as indicated by 2 of 3 nuclear medicine specialists. The 3 nuclear medicine physicians evaluated the images obtained with the shorter scan duration as they would have evaluated the 180-s/bp images. With extra time being taken, the missed lesion might not be overlooked in the 60-s/bp images. A trade-off between increasing patient throughput or reducing radiation exposure and possibly reserving more time for image interpretation is a factor that needs to be taken into consideration.
With regard to other commercially available digital PET/CT systems, a comparable study stated that a reduction in activity or scan time to 90 s/bp (which equals a factor of 2) is feasible when the Discovery MI PET/CT system (GE Healthcare) is used (16). For the Vereos PET/CT system (Philips Healthcare), a similar study on activity optimization has not been conducted yet.
To our knowledge, this is the first study to explore scan duration or activity optimization and image quality using the digital Biograph Vision PET/CT system. Lowering the injected activity by a factor of 3 will result in a decrease in radiation exposure for patients (particularly important for young lymphoma patients) as well as medical staff and will also reduce 18F-FDG costs while maintaining quantitative PET performance. For institutions more interested in increased patient throughput, shorter scan times (down to ∼6 min for a whole-body scan) in combination with an activity prescription of 3 MBq/kg are feasible with the Biograph Vision PET/CT system, in turn also increasing cost-effectiveness. However, with increasing patient throughput, there is also more demand for peripheral sources, such as preparation rooms, staff, and time for reporting. For pediatric purposes, both reducing activity and scanning faster are of high clinical importance, as radiation exposure should be kept to the bare minimum in this patient population; in addition, faster scanning decreases the need for anesthetics.
CONCLUSION
When the Biograph Vision PET/CT system is used for oncologic 18F-FDG imaging, it is acceptable to reduce scan duration or activity administration by a factor of 3 (compared with European Association of Nuclear Medicine activity prescriptions (1)) for routine clinical imaging when using the clinical+G2 reconstruction protocol. When applying EARL-compliant reconstructions, further reductions are achievable, depending on local preferences.
A reduction of injected activity will decrease radiation exposure for patients as well as for medical staff. In addition, for institutions without the ability to produce their own 18F-FDG, activity reduction will lower the costs of PET/CT imaging. Alternatively, a faster scan time increases patient throughput, resulting in a higher cost efficiency for PET centers.
KEY POINTS
QUESTION: Does the new Siemens Biograph Vision PET/CT system allow for a reduction in scan duration or activity administration to decrease radiation exposure or reduce 18F-FDG PET imaging costs?
PERTINENT FINDINGS: Images obtained at 180 s/bp were quantitatively compared with images acquired at shorter scan durations in 30 patients referred for oncologic clinical PET/CT. The optimal shorter scan duration, still quantitatively representative for the 180-s/bp images (with ∼5% bias) and of adequate diagnostic image quality (according to 3 nuclear medicine physicians), was found to be 60 s/bp.
IMPLICATIONS FOR PATIENT CARE: The Biograph Vision allows administered 18F-FDG activity or scan duration to be reduced by a factor of 3, thereby decreasing patients’ radiation exposure or increasing patient throughput.
Acknowledgments
The research presented in this study was financially supported by Siemens Molecular Imaging under a collaborative research contract. No other potential conflict of interest relevant to this article was reported.
Footnotes
Published online Oct. 18, 2019.
- © 2020 by the Society of Nuclear Medicine and Molecular Imaging.
REFERENCES
- Received for publication July 23, 2019.
- Accepted for publication September 23, 2019.


