


Abstract
An unmet need for the clinical management of chronic kidney disease is a predictive tool of kidney function during the first decade of the disease, when there is silent loss of glomerular function. The objective of this study was to demonstrate receptor-mediated binding of tilmanocept to CD206 within the kidney and provide evidence of kinetic sensitivity of this binding to renal function. Methods: Rats were positioned in a PET scanner with the liver and kidneys within the field of view. After an intravenous injection of 68Ga-IRDye800-tilmanocept, using 1 of 2 scaled molar doses (0.02 nmol/g, n = 5; or 0.10 nmol/g, n = 5), or coinjection (n = 3) of 68Ga-IRDye800-tilmanocept (0.10 nmol/g) and unlabeled tilmanocept (5.0 nmol/g), or a negative control, 68Ga-IRDye800-DTPA-galactosyl-dextran (0.02 nmol/g, n = 5), each animal was imaged for 20 min followed by a whole-body scan. Frozen kidney sections were stained for podocytes and CD206 using immunofluorescence. Molecular imaging of diabetic db/db mice (4.9 wk, n = 6; 7.3 wk, n = 4; 13.3 wk, n = 6) and nondiabetic db/m mice (n = 6) was performed with fluorescence-labeled 99mTc-tilmanocept (18.5 MBq, 2.6 nmol). Thirty minutes after injection, blood, liver, kidneys, and urine were assayed for radioactivity. Renal time–activity curves were generated. Results: Rat PET whole-body images and time–activity curves of 68Ga-IRDye800-tilmanocept demonstrated receptor-mediated renal accumulation with evidence of glomerular uptake. Activity within the renal cortex persisted during the 40-min study. Histologic examination demonstrated colocalization of CD206 and IRDye800-tilmanocept within the glomerulus. The glomerular accumulation of the coinjection and the negative control studies were significantly less than the CD206-targeted agent. The db/db mice displayed a multiphasic renal time–activity curve with high urinary bladder accumulation; the nondiabetic mice exhibited renal uptake curves dominated by a single phase with low bladder accumulation. Conclusion: This study demonstrated receptor-mediated binding to the glomerular mesangial cells and kinetic sensitivity of tilmanocept to chronic renal disease. Given the role of mesangial cells during the progression of diabetic nephropathy, PET or SPECT renal imaging with radiolabeled tilmanocept may provide a noninvasive quantitative assessment of glomerular function.
In 2017, the International Diabetes Federation estimated that the worldwide prevalence of diabetes would increase from 415 million persons in 2015 to 642 million in 2040 (1). Approximately 40% of persons with diabetes develop diabetic nephropathy as manifested by albuminuria or impaired glomerular filtration rate (2). As diabetic kidney disease progresses over 2–3 decades, it is critical to have a noninvasive measure that monitors early disease activity since markers such as albuminuria may often be transient and reductions in the estimates of glomerular filtration rate would already indicate more advanced disease (3). Consequently, the detection of renal dysfunction within the first decade of diabetic nephropathy is an unmet clinical need (4).
We propose external imaging of mesangial cell function as a biomarker for diabetic nephropathy. Our reasoning is based on the following. Mesangial cell matrix expansion is a histologic hallmark of diabetic nephropathy (5), which precedes the reduction of a patient’s glomerular filtration rate (6). Additionally, all of the clinical manifestations of diabetic nephropathy are highly correlated with mesangial matrix expansion (7,8). Lastly, there is evidence the mesangial expansion is reversable with therapy (9). There currently does not exist an imaging, serum, or urine biomarker that is sensitive to mesangial cell function (10).
We propose molecular imaging of mesangial cell function by targeting a radiopharmaceutical to CD206, which resides on the surface of mesangial cells (11). The imaging agent would be based on the design strategy for Tc-tilmanocept (12). 99mTc-tilmanocept, which has regulatory approvals in the United States and Europe for sentinel lymph node mapping, uses a diethylenetriaminepentaacetic acid (DTPA)–mannosyl conjugate of dextran (Fig. 1) and offers several advantages for the design of a renal imaging agent. The molecular weight of the dextran backbone can be adjusted to match the clinical requirements (13), and the number of receptor substrates per dextran can be altered to optimize receptor affinity (14). Tilmanocept can be labeled with 68Ga for PET imaging (15). During the design process, dextran conjugates such as tilmanocept can be labeled with a fluorophore without the loss of receptor affinity (16). Additionally, chemical isomers of the receptor substrate can be used to produce a negative control with completely different receptor specificity but similar hydrodynamic properties (Fig. 1).
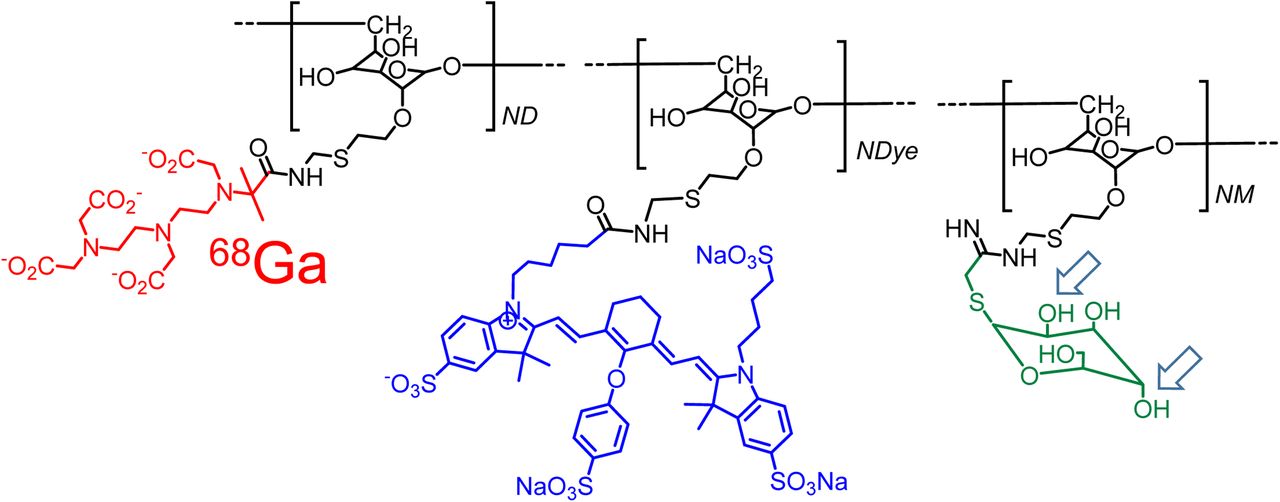
Bimodal molecular imaging agent, 68Ga-labeled IRDye800-tilmanocept, consists of modified dextran backbone (black), which carries CD206 receptor substrate, mannose (green); metal chelator, DTPA (red); and fluorescent tag, IRDye800CW (blue). Isomeric change of hydroxyls at C2 and C4 carbons of the receptor substrate (arrows) produces glycoconjugate that binds only to asialoglycoprotein receptor, which is specific to hepatocytes.
In this work, we present 5 independent experiments that demonstrate glomerular CD206 accumulation of tilmanocept and sensitivity to diabetic nephropathy. The first 3 experiments used PET imaging of healthy rats to obtain adequate spatial resolution of the renal cortex. We used a galactosyl-dextran conjugate as a negative control. We used 2 different in vivo receptor saturation methods to demonstrate changes in renal PET time–activity data. We tested the histologic colocalization of fluorescent tilmanocept with a histoimmunofluorescent marker for CD206. Lastly, we tested the kinetic sensitivity to mesangial cell matrix expansion by comparing the renal time–activity curves of nondiabetic db/m and diabetic db/db mice; the latter animal model exhibits mesangial cell matrix expansion. We conclude with a discussion of the chemical modifications of tilmanocept that will optimize a molecular imaging protocol for staging a patient with early diabetic nephropathy.
MATERIALS AND METHODS
Reagents and Animals
Tilmanocept, DTPA-mannosyl-dextran, and DTPA-dextran (12) were provided by Navidea Biopharmaceuticals. IRDye800CW-NHS-ester was purchased from LI-COR Biosciences, and Cy5-NHS-ester was purchased from GE Healthcare. Female diabetic C57BLKS/J LepRdb/LepRdb mice (db/db) and female nondiabetic C57BLKS/J LepRdb (db/m) were purchased from Jackson Laboratories. This study was approved by the University of California, San Diego, Institutional Animal Care and Use Committee.
Bimodal Radiopharmaceuticals
DTPA-galactosyl-dextran was synthesized (12) using cyanomethyl-2,3,4,6-tetra-O-acetyl-1-thio-β-d-galactopyranoside (17). IRDye800CW or Cy5 was covalently attached to tilmanocept or DTPA-galactosyl-dextran as previously described (18). The average fluorophore, chelator, carbohydrate, and amine densities for each dextran conjugate were measured by nuclear magnetic resonance (18) and were approximately 2 IRDye800CW or Cy5 molecules, 5 DTPAs, 15 thioglycosides, and 0 amino groups per dextran.
IRDye800-tilmanocept or IRDye800-DTPA-galactosyl-dextran was radiolabeled with 68Ga as previously described (19). Cy5-tilmanocept was radiolabeled with 99mTc using tin reduction (12). Quality control of each fluorescent radiopharmaceutical was performed by instant thin-layer chromatography (19). The radiochemical and optical purities of each injectate exceeded 96%.
PET Imaging of Healthy Rats: Demonstration of Glomerular CD206 Accumulation
PET imaging of 68Ga-labeled fluorescent-tilmanocept was performed using 2 scaled molar doses. Five rats (154–170 g) were injected with a 0.02 nmol/g concentration of 68Ga-IRDye800-tilmanocept (7.4–13.3 MBq), and 5 rats (171–214 g) were imaged (6.3–16.3 MBq) with a scaled molar dose of 0.10 nmol per gram of body weight. Additionally, 5 rats (221–252 g) were imaged with 68Ga-IRDye800-galactosyl-dextran (0.02 nmol/g, 7.0–13.3 MBq), and 3 rats (166–180 g) were imaged after a coinjection of 68Ga-IRDye800-tilmanocept (0.1 nmol/g, 5.8–4.7 MBq) and unlabeled tilmanocept (5.0 nmol/g). After positioning both kidneys within the field of view of a high-resolution PET scanner (Vista DR; GE Healthcare), we performed a 20-min dynamic scan immediately followed by a whole-body imaging study. At 40 min after injection, each rat was euthanized by CO2 asphyxiation. Both kidneys, the entire liver, and the urinary bladder were excised, rinsed, weighed, assayed for radioactivity (γ-8000; Beckman Instruments [400–600 keV]), bisected, placed in embedding medium, and stored at −80°C.
The dynamic scan was reconstructed into cross-sections with 30-s time intervals. Ten contiguous coronal cross-sections from each kidney and liver were used to generate decay-corrected time–activity curves. These curves were scaled to percentage injected dose per gram (%ID/g) based on measurements of each kidney and liver obtained at 40 min after injection. The whole-body images were reconstructed into transaxial cross-sections and reformatted into maximum-intensity-projection images (20).
Immunohistochemistry: Demonstration of CD206 Targeting
The bisected rat kidneys were cut into contiguous 5-μm cryostat sections, stored at −80°C, and dried at room temperature before immunofluorescent staining. All incubation solutions contained 40 mM divalent cations. After fixation, the slides were washed and incubated in phosphate-buffered saline containing 0.5% Triton X-100. This was followed by incubation in phosphate-buffered saline containing 1% bovine serum albumin and 0.02% Triton X-100. The 2 primary antibodies, antimannose receptor antibody (ab-64693; ABCAM) and antipodocyte antibody (sc-22296, Santa Cruz Biotechnology), were incubated overnight at 4°C. After a similar incubation with the secondary antibodies bearing Alexa Fluor 488 or Alexa Fluor 647, the slides were washed, dried, mounted, and stored in the dark at −20°C.
The histologic sections were examined under a fluorescence microscope (Nikon E600). Three filter sets were used: excitation, 470 nm, and emission, 525 nm, which represented the podocyte stain; excitation, 620 nm, and emission, 700 nm, which represented the CD206 stain; and excitation, 747 nm; emission, 776 nm, for IRDye800-tilmanocept or IRDye800-DTPA-galactosyl-dextran.
γ-Imaging of Mice: Demonstration of Sensitivity to Chronic Renal Disease
Male diabetic db/db mice were imaged at 4.9 (n = 6), 7.3 (n = 5), and 13.3 (n = 6) weeks of age. Additionally, 4.1-wk-old male nondiabetic db/m mice (n = 6) were imaged. After weighing, each animal was anesthetized (2% isoflurane, 200 mL/min flow of O2) and positioned (ventral view) atop a high-resolution γ-imager (γ Imager; BioSpace) fitted with a high-resolution low-energy collimator. After a 25-min dynamic imaging study (99mTc-labeled Cy5-tilmanocept, ∼18.5 MBq, 2.6 nmol), both kidneys and the urinary bladder were excised, weighed, and assayed for radioactivity (100–200 keV) with a known dilution of the injectate. Regions of interest were drawn around a portion of the left kidney. Decay-corrected time–activity curves were generated and normalized to the %ID/g.
Statistical Analysis
We used the Student t test (JMP, version 9, 2010; SAS Institute) to calculate a 2-tailed test of statistical significance assuming equal variances. We considered a 2-sided P value of less than 0.05 to be statistically significant.
RESULTS
PET Imaging of Healthy Rats: Demonstration of Glomerular CD206 Accumulation
The biodistribution studies of the CD206-specific molecule IRDye800-tilmanocept and the negative control, IRDye800-DPTA-galactosyl-dextran, demonstrated receptor-mediated binding of tilmanocept within the kidney. Figure 2 summarizes these studies graphically. The low scaled molar dose studies demonstrated a statistically significant (P < 0.001) difference in renal uptake between tilmanocept and 68Ga-IRDye800-DTPA-galactosyl-dextran (FL-gal-Dextran). The liver accumulation at 40 min after injection of the low-dose (0.02 nmol/g) tilmanocept and 68Ga-IRDye800-DTPA-galactosyl-dextran doses (FL-gal-Dextran, 0.02 nmol/g) was significantly (P < 0.001) higher than the hepatic accumulation (2.94 ± 0.67 nmol/g) of the high-dose (0.10 nmol/g) FL-tilmanocept studies. Saturation of the hepatic CD206 permitted more fluorescent-tilmanocept to reach the kidneys. The %ID of urinary bladder and urine was significantly (P = 0.042) higher for the low-dose fluorescent-tilmanocept studies (14.2% ± 7.8%) than for the low-dose fluorescent-galactosyl-dextran studies (5.57% ± 1.81%). Neither of the low-dose studies exhibited a statistically different urinary bladder accumulation compared with the high-dose tilmanocept (8.16% ± 4.42%).
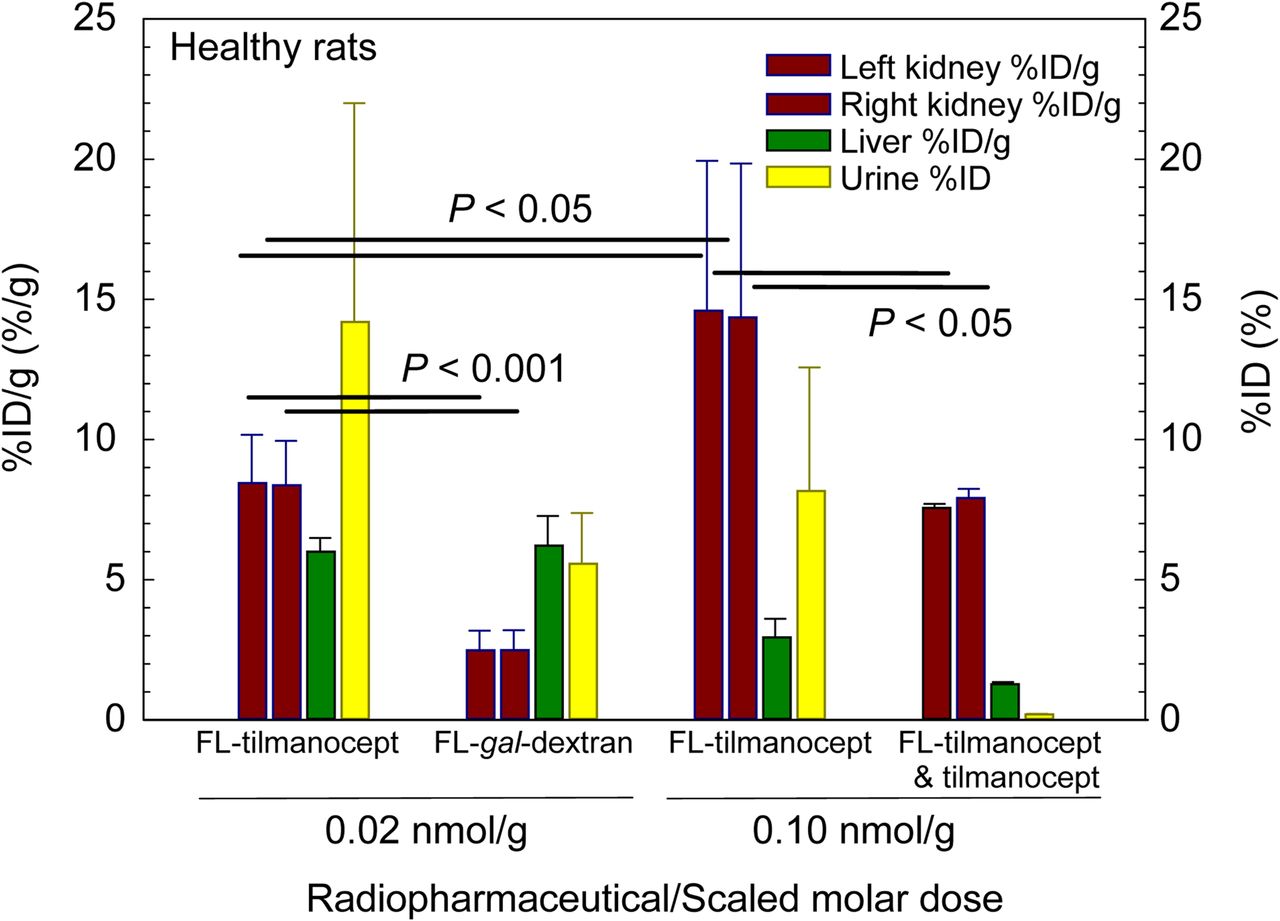
In vivo demonstration of receptor-mediated binding by tilmanocept. Kidneys, liver, and urine were harvested 40 min after injection of a low scaled molar dose of 68Ga-labeled IRDye800-tilmanocept (FL-tilmanocept) or 68Ga-labeled DTPA-IRDye800-galactosyl-dextran (FL-gal-dextran); injection of a high scaled dose of FL-tilmanocept; or coinjection of FL-tilmanocept and 5.0 nmol/g tilmanocept.
PET dynamic imaging demonstrated receptor-mediated renal accumulation by 68Ga-IRDye800-tilmanocept. Four examples of renal time–activity curves are displayed in Figure 3. Renal accumulation by a high scaled molar dose (FL-tilmanocept) of 68Ga-fluorescent-tilmanocept exhibited a longer time to peak (8.8 min) and higher accumulation than an imaging study that used a low scaled molar dose (FL-tilmanocept) of fluorescent-tilmanocept. The liver accumulation for the same high scaled molar dose (Supplemental Fig. 1; supplemental materials are available at http://jnm.snmjournals.org) FL-tilmanocept studies exhibited a nearly flat curve with a very low peak value (31%). This permitted the kidneys to bind a greater fraction of the injectate. A negative control study (FL-gal-Dextran) exhibited negligible renal accumulation and high (81 %ID) liver uptake (Supplemental Fig. 1); the highest kidney values occurred early after injection (∼3.2 min) and most probably were produced by activity within the renal blood pool. A coinjection (blocking) study (Fig. 3) exhibited low renal accumulation, which plateaued (∼7.5 %ID/g) within 3 min of injection. The liver time–activity curve from this study also exhibited saturated binding (Supplemental Fig. 1). The shape of the kidney blocking curves differed significantly from the nonblocked 0.10-nmol/g injections that did not contain a 5.0 nmol/g blocking dose of cold tilmanocept. The nonblocked curves exhibited a sustained renal accumulation for 10 min and achieved a %ID/g within each kidney that was double the plateau value of the blocked dose.

Renal cortex time–activity curves demonstrated receptor-mediated accumulation of tilmanocept. Left (upper triangles) and right (lower triangles) kidney time–activity curves displayed significantly different shapes after administration of low scaled molar dose of 68Ga-labeled IRDye800-tilmanocept (FL-tilmanocept) or 68Ga-labeled DTPA-IRDye800-galactosyl-dextran (FL-gal-dextran); injection of high scaled dose of FL-tilmanocept; or coinjection of FL-tilmanocept and 5.0 nmol/g tilmanocept.
PET imaging demonstrated receptor-mediated accumulation of 68Ga-IRDye800-tilmanocept in the renal cortex. Figure 4A is a ventral projection whole-body maximum-intensity-projection image (20–40 min after injection) and is representative of a high molar dose (0.1 nmol/g) 68Ga-labeled-fluorescent-tilmanocept study, which exhibited diminished liver accumulation (3.1 %ID/g) compared with the kidneys (12 %ID/g); the urinary bladder accumulated 14 %ID. A PET maximum-intensity-projection whole-body image (Fig. 4B) from a low molar dose (0.02 nmol/g) study demonstrated a higher liver accumulation (5.6 %ID/g) than the high scaled dose study. The kidneys accumulated 9.2 %ID/g (Fig. 4B); the urinary bladder accumulated 8.3 %ID. The renal images of all 10 68Ga-fluorescent-tilmanocept studies exhibited increased activity at the rim of the cortex. Figure 4C (the sum of 10 contiguous coronal cross-sections) clearly delineates activity within the renal cortex. Activity in the right and left cortex dominates the renal image. The dorsal aspect of the right and left lobes of the liver can be seen. A negative control study (Fig. 4D, maximum-intensity projection, whole-body, 20–40 min after injection) using 68Ga-IRDye800-galactosyl-dextran (0.02 nmol/g) exhibited significantly less radioactivity in the kidneys (3.1 %ID/g).

PET images demonstrated receptor-mediated accumulation of 68Ga-IRDye800-tilmanocept in renal cortex (red arrows). (A) Scaled high molar dose study demonstrated low liver accumulation (green arrow) compared with kidneys and urinary bladder (yellow arrow). (B) Low molar dose study demonstrated higher liver accumulation and lower kidney accumulation. (C) Coronal cross-sections more clearly delineate activity in renal cortex. (D) Negative control study (maximum-intensity projection) exhibited significantly less radioactivity in kidneys. All images were acquired 20–40 min after injection.
Immunohistochemistry: Demonstration of CD206 Targeting
Histomicrographs of all 10 rat kidneys from the high dose 68Ga-IRDye800-tilmancoept studies demonstrated tilmanocept binding to the CD206 receptor within the glomerulus. Figure 5 displays 4 histomicrographs from the same section using ×60 magnification. Figure 5A is a single channel (AlexaFluor647) demonstrating the distribution of CD206. Figure 5B is a single-channel (IRDye800CW, ×60) composite representing the distribution of IRDye800-tilmanocept. Figure 5C is a 2-channel (AlexaFluor488, IRDye800CW) overlay composite, which demonstrates CD206 distribution within the glomerular compartment defined by podocytes stained with Alexa-488. Lastly, Figure 5D is another 2-channel (AlexaFluor647, IRDye800CW) overlay composite that demonstrates tilmanocept and CD206 colocalization within 1 glomerulus.
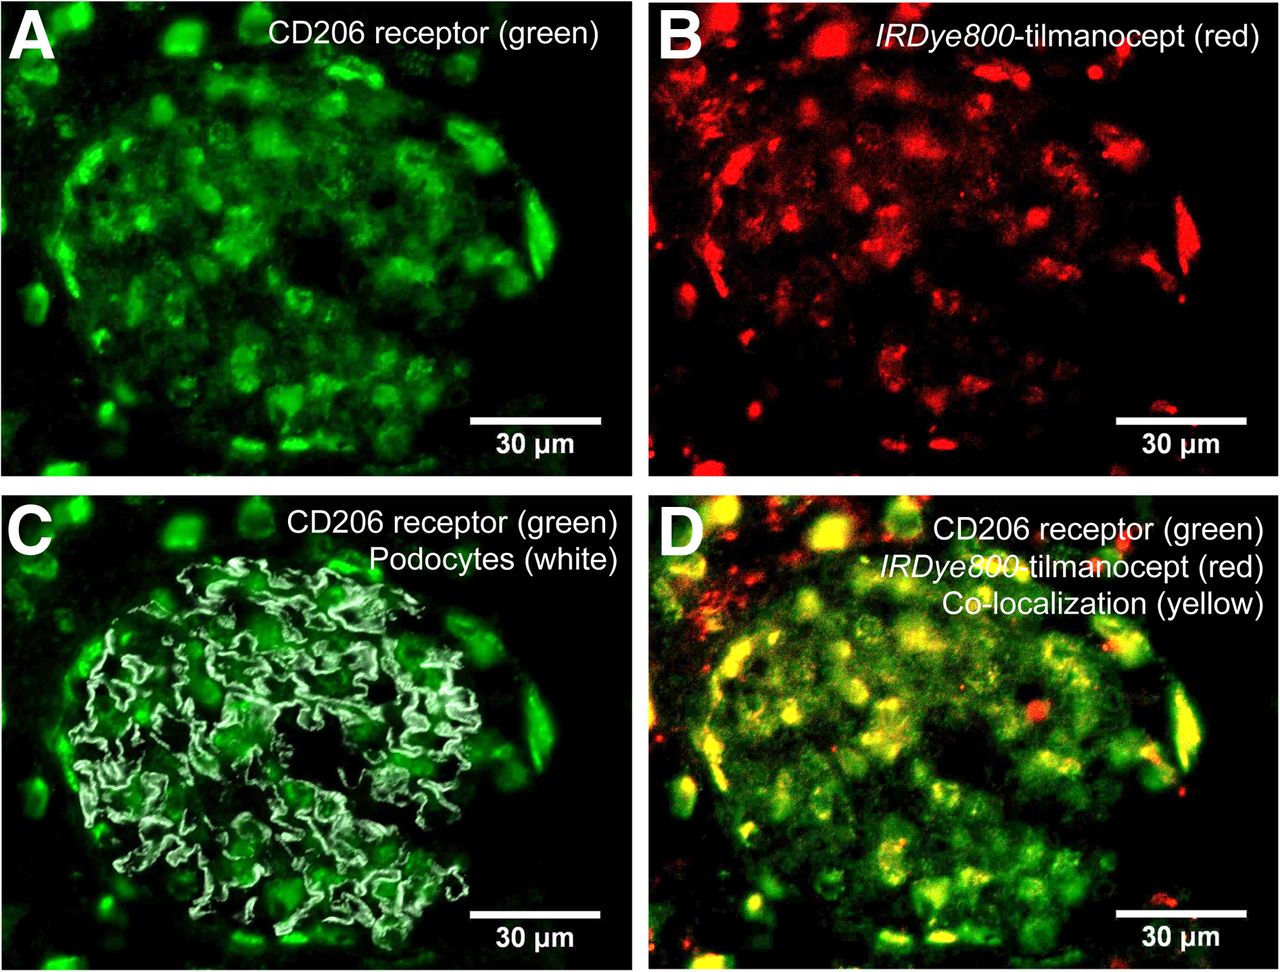
Histologic demonstration of tilmanocept binding to CD206 receptor within the mesangium. Four histomicrographs are shown from same section of healthy rat kidney excised 40 min after injection of IRDye800CW-tilmanocept. (A) Single channel representing distribution of CD206. (B) Single channel representing distribution of IRDye800-tilmanocept. (C) 2-channel composite, which demonstrates CD206 (green) distribution within glomerular compartment, which is defined by podocytes (gray). (D) 2-channel composite of CD206 (green) and IRDye800-tilmanocept (red) distributions (overlapping stains result in yellow).
Histomicrographs from the negative control studies demonstrated the specificity of tilmanocept for mesangial CD206 (Supplemental Fig. 2; supplemental materials are available at http://jnm.snmjournals.org). Histomicrographs from healthy rat kidneys excised 40 min after injection of 68Ga-IRDye800-DTPA-galactosyl-dextran exhibited a very low presence of IRDye800. Histomicrographs using ×20 magnification (Supplemental Fig. 3) also demonstrated colocalization of tilmanocept and CD206. These wider-field views displayed extraglomerular regions of IRDye800, which are consistent with filtered IRDye800-tilmanocept within the renal tubules.
γ-Imaging of Mice: Demonstration of Sensitivity to Chronic Renal Disease
Dynamic imaging of db/m and db/db mice demonstrated kinetic sensitivity to chronic kidney disease. These experiments are summarized in Figure 6. The average time at which the nondiabetic db/m renal curves peaked was significantly (P < 0.005) longer than the average time-to-peak value of the curves from the 4.9-wk-old db/db diabetic mice, the 7.3-wk-old db/db mice, and the 13.3-wk-old db/db mice. The renal %ID/g of 99mTc-labeled Cy5-tilmanocept by nondiabetic db/m mice far exceeded the renal accumulation of the diabetic db/db mice at all 3 ages. The %ID in the urine of the db/m mice was significantly lower (P < 0.03) than all age groups of the db/db mice.

Studies in nondiabetic and diabetic mice demonstrated sensitivity to renal disease. Nondiabetic mice exhibited higher kidney %ID/g (red bars) and lower urine %ID than diabetic mice at 4.9, 7.3, and 13.3 wk of age. Time–activity curves peaked later in nondiabetic mice (blue bars) than diabetic mice.
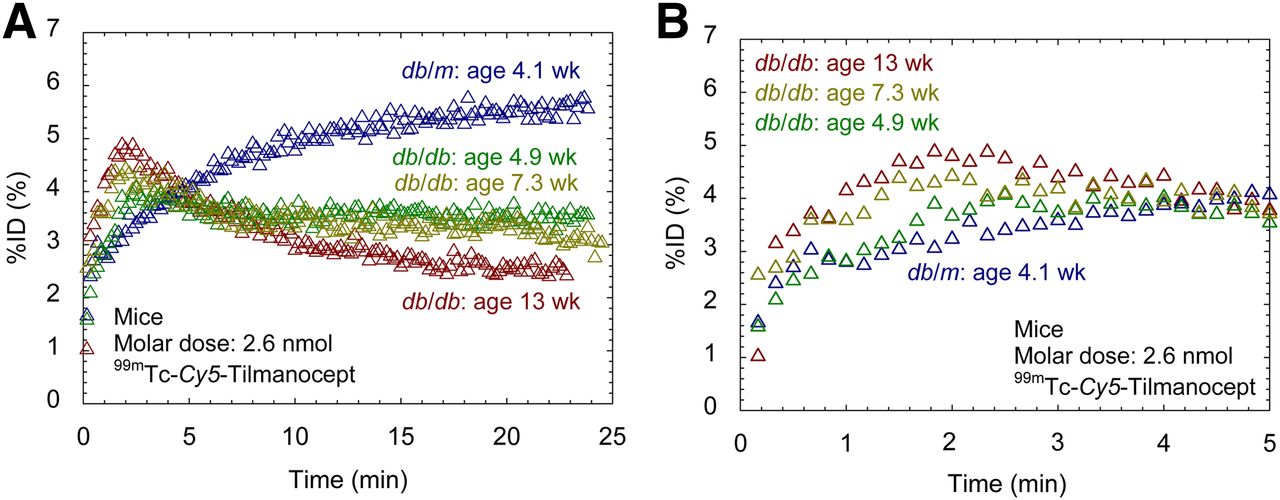
Figure 7A displays representative 99mTc-labeled Cy5-tilmanocept scaled time–activity curves from the left kidneys of diabetic and nondiabetic mice. The 4 curves illustrate the profound difference in shape between the time–activity curves of the nondiabetic and 3 diabetic mice. The nondiabetic db/m mouse exhibited a renal uptake curve dominated by a single phase during the 25-min dynamic imaging study. The left kidney curve of the nondiabetic mouse peaked 22 min after injection at 5.5% of the injected dose. The urinary bladder with contents of the nondiabetic db/m mice at 30 min after injection contained 1.1 %ID. Figure 7B is an expanded view of Figure 7A that demonstrates increased renal accumulation of tilmanocept with increasing age. The curves from the 4.9-, 7.3-, and 13.3-wk-old diabetic kidneys peaked at 4.0 %ID (at 2.5 min), 4.4 %ID (at 2.0 min), and 4.9 %ID at 1.8 min, respectively.

(A) 99mTc-labeled tilmanocept time–activity curves exhibited kinetic sensitivity to chronic kidney disease. Diabetic db/db mice (green, 4.9 wk; yellow, 7.3 wk; red, 13.3 wk) peaked within 2 min after injection. Nondiabetic db/m mouse (blue) peaked 18 min after injection. (B) Expanded view shows progressively faster accumulation with increasing age.
DISCUSSION
PET Imaging of Healthy Rat: Demonstration of Glomerular CD206 Accumulation
This work provided in vivo demonstration that CD206 is the molecular target when imaging the kidney with radiolabeled tilmanocept. We demonstrated a statistically significant loss of renal accumulation by the galactosyl-conjugate of dextran (21), which binds to the asialoglycoprotein receptor in the liver and does not bind to CD206 in the kidney. Using time–activity curves at 2 different scaled molar doses, we demonstrated that the renal accumulation of 68Ga-labeled fluorescent-tilmanocept can be saturated, which is the hallmark of a receptor-mediated process (22). The standard method for demonstrating receptor-specific binding (23), a receptor blocking study, substantially diminished the renal accumulation of 68Ga-labeled tilmanocept.
Immunohistochemistry: Demonstration of CD206 Targeting
We demonstrated the histologic colocalization of IRDye800-tilmanocept with a fluorescent marker for CD206. A substantial majority of the IRDye800CW fluorescence was localized within the confines of the glomerulus, as defined by podocyte staining.
γ-Imaging of Mice: Demonstration of Sensitivity to Chronic Renal Disease
The db/db and db/m mouse imaging studies (Figs. 6 and 7) demonstrated kinetic sensitivity of tilmanocept to renal function in chronic renal disease. The db/db mouse (24,25) is a rodent model of genetic diabetes, which mirrors the progression of glomerular changes found in human diabetes (4,26). At 8 wk of age, diabetic db/db mice have the same serum creatinine levels and same mesangial matrix fraction as nondiabetic db/m mice of the same age (27). At 12 and 16 wk of age, the mesangial matrix fraction of db/db mice expands 2- and 3.5-fold, respectively. This expansion was statistically significant when compared with the db/db mice at 4 wk and the db/m mice of the same age (27). The elevated 99mTc-tilmanocept renal and urine accumulation (Fig. 6) of the diabetic mice is consistent with hyperfiltration observed in db/db mice and human diabetic nephropathy (26).
The Mesangial Cell as an Alternative Molecular Imaging Target
Intraglomerular mesangial cells offer a new cellular target for molecular imaging of the kidney. After delivery to the kidney by renal plasma flow (Fig. 8), an imaging agent can be passively ultrafiltered into the proximal tubule depending on its size and charge or extracted from the plasma by the mesangial cells. Both routes require passage through a highly porous and negatively charged (28) fenestrated capillary endothelium. Molecules that are passively filtered into the Bowman capsule traverse a dense network of glycoprotein and collagen known as the glomerular basement membrane, which is also negatively charged (29), followed by a negatively charged slit diaphragm between the podocytes. Molecules that approach the mesangial cells must traverse a fibrillary matrix, also known as the mesangial cell matrix.

After delivery to capillary lumen by renal plasma flow (arrow 1), a molecule of radiolabeled IRDye800-tilmanocept can exit glomerulus via renal plasma flow, passively be ultrafiltered into Bowman capsule (inset B, arrow 2), or passively be ultrafiltered into transverse mesangial cell matrix (inset A, arrow 3) and bind to CD206 receptor.
An important physiologic function of mesangial cells is their active participation in the formation and maintenance of the mesangial cell matrix and the glomerular basement membrane (30). Thickening of the glomerular basement membrane and expansion of the mesangium are the major lesions of diabetic nephropathy leading to renal dysfunction in diabetes patients (31). These lesions occur early in the progression of the disease. Both the cellular and the matrix components of the mesangium increase in relative volume during diabetes (32), with a 57% increase in cellular volume and 185% increase in matrix volume. Other significant mesangial cell functions are the regulation of glomerular plasma flow, by their smooth muscle properties; the immunologic recognition and clearance of cellular debris within the mesangium; and the monitoring of mesangial glucose concentration.
Clinical Significance
Tilmanocept may offer a noninvasive alternative to renal biopsy for diagnosis of early glomerular disease. Many potential drug targets have emerged from this research, including the vasopressin V1α receptor (33), the NF-κB receptor (34), and αVβ3 (35). Agents that target these receptors are most effective during the early phases of inflammation, where they block the inflammatory response that leads to fibrosis. This strategy necessitates early recognition of disease. This has led to calls for universal renal biopsies in newly diagnosed diabetic patients to identify early treatable disease (36). Percutaneous biopsy is invasive, and the procedure alone carries a 7%–10% risk of minor complication such as bleeding or pain and a 0.1%–0.5% risk of a major complication requiring a nephrectomy or iatrogenic arteriovenous malformation (37). Given 1.7 million new cases of type 2 diabetes in 2012 (38), this would lead to 119,000–170,000 patients with bleeding and pain after biopsy, and 1,700 to 7,500 patients with major complications such as arteriovenous fistula or bleeding requiring partial nephrectomy (37). Finally, biopsy suffers from undersampling, as only 10 of 617,000 glomeruli per kidney are actually evaluated in the course of a renal biopsy (39).
Optimization of the Molecular Imaging Agent
Our next step toward the development of radiolabeled tilmanocept as a renal molecular imaging agent will be the design of a protocol that matches the clinical setting. Knowing that the cellular target within the kidney is responsible for mesangial matrix expansion, our design strategy will maximize the sensitivity of tilmanocept imaging to changes in both mesangial matrix permeability (Fig. 8), and receptor density. The following chemical features would make CD206-targeted molecular imaging highly sensitive to tilmanocept mesangial matrix permeability and receptor density: a molar dose of tilmanocept that does not saturate the receptor sites in healthy kidneys, a neutral charge distribution of the molecular imaging agent, and an imaging agent of moderately high molecular diameter. The last property will be used to eliminate ultrafiltration through the Bowman capsule, which will increase mesangial cell accumulation. A CD206-specific dextran with a molecular radius equal to albumin will not be filtered by the glomerular basement membrane but will still retain easy access through the mesangial matrix. The rat glomerulus has been studied by electron microscopy (40,41), revealing an average mesangial matrix pore size that is 10-fold larger than that of the glomerular basement membrane.
Our design hypothesis is that early mesangial matrix expansion will increase the permeability of tilmanocept through the mesangial matrix, which in turn will increase delivery of the molecular imaging agent to mesangial cells. This is consistent with the series of time–activity curves (Fig. 7A) from diabetic mice, where early time-points displayed (Fig. 7B) fast renal accumulation with increasing age. This hypothesis is based on measurements of collagen VI density, which decreases during mesangial matrix expansion (42). The increased delivery to the mesangial cell surface will expose more tilmanocept to the limited number of CD206 receptors. The result will be a time–activity curve with a shape different from that of a healthy kidney (Fig. 3). This study used a high scaled molar dose, which produced a curve that exhibits receptor saturation distinguished by a slower and linear portion of the curve (5–10 min after injection) as it approaches its peak value.
For routine clinical applications, 99mTc is the nuclide of choice. The typical imaging protocol could consist of a 370-MBq dose of 99mTc-tilmanocept administered intravenously followed by a 20-min dynamic imaging study; the patient would lie supine with both kidneys within the field of view of an anterior-facing camera head, with the second camera head acquiring a posterior view. The dynamic study would provide a quantitative basis to assess the glomerular function of each kidney.
Clinical research could use PET/MRI or PET/CT with 68Ga. PET imaging with motion correction via simultaneous MRI acquisition could provide regional estimates of mesangial cell function. Although it has been demonstrated (5) that mesangial expansion is characterized by a 3-fold increase in mesangial matrix over mesangial cell volume, dynamic PET/MRI using higher scaled molar doses of 68Ga-tilmanocept could provide independent measurements of permeability-surface area of the mesangial matrix, as well as receptor density. The latter measurement should be directly proportional to mesangial cell density. An example of this approach is hepatocellular imaging of 99mTc-galactosyl-neoglycoalbumin (43,44), where kinetic modeling demonstrated a linear relationship between receptor amount and viable hepatocellular mass within the entire liver (44).
Imaging of specific molecular targets, such as CD206 within the glomerulus and the organic anion transporter 1 of proximal tubules (45,46), represents a complementary strategy for the noninvasive measurement of renal function. Both targets are energy-dependent transporters of physiologically significant molecules at 2 critical cell types that serve different functions within the kidney. The radiopharmaceuticals 99mTc-DTPA and 99mTc-mercaptoacetyltriglycine have specific roles but are not accepted (47) as the primary indication for glomerular filtration rate or renal blood flow. Most importantly, the detection of blood flow, filtration, and structural abnormalities, such as cortical atrophy and tumors, is unable to determine the early stages of chronic kidney disease, such as diabetes, or immune complex diseases, such as lupus or IgA nephropathy. Currently, there are no biomarkers for the early detection of diabetic nephropathy (48) and immune complex diseases of the kidney (49). Consequently, these diseases are screened by GFR estimates from serum creatinine measurements and urine microalbumin concentrations (50), both of which are insensitive in the first decade of type 1 and type 2 diabetes (31,51,52).
CONCLUSION
This study demonstrated receptor-mediated binding to the glomerular mesangial cells and kinetic sensitivity of tilmanocept to chronic renal disease. Given the early role of mesangial cells during the progression of chronic kidney disease, PET or SPECT renal imaging of CD206 may provide a noninvasive and highly sensitive quantitative assessment of glomerular function based on specific physiologic and cellular components that are central to the healthy kidney. A SPECT/CT or PET/CT protocol that accurately staged early diabetic kidney disease may help to establish a precise baseline for frequent surveillance by a serum or urine biomarker.
DISCLOSURE
David Vera is the inventor of tilmanocept. No other potential conflict of interest relevant to this article was reported.
KEY POINTS
QUESTION: The objective of this study was to demonstrate receptor-mediated binding of tilmanocept to CD206 within the kidney and provide evidence of kinetic sensitivity of kidney time–activity data to chronic renal function.
PERTINENT FINDINGS: This study demonstrated receptor-mediated binding of tilmanocept to rodent glomerular mesangial cells and kinetic sensitivity of tilmanocept to a murine model of diabetic nephropathy.
IMPLICATIONS FOR PATIENT CARE: Renal imaging of radiolabeled tilmanocept may provide the unmet need for a predictive tool of kidney function during the first decade of disease, when there is silent loss of glomerular function.
Acknowledgments
We thank Dr. William C. Eckelman and Dr. Sushrut Waikar for their helpful discussions. We also thank the staffs of the In Vivo Imaging Shared Resource and the Microscope Shared Resource at the University of California, San Diego, Moores Cancer Center. This work was funded in part by the NCI In Vivo Cancer and Molecular Imaging Program (P50 CA128346). Dr. Jahromi was supported by NIH T32-4T32EB005970. This work was presented to the NIDDK Renal Imaging Workshop, July 12–13, 2018, Bethesda, MD; we acknowledge the many helpful comments from the workshop participants.
Footnotes
Published online Feb. 22, 2019.
- © 2019 by the Society of Nuclear Medicine and Molecular Imaging.
REFERENCES
- Received for publication November 26, 2018.
- Accepted for publication January 24, 2019.


Jump to section
Related Articles
Cited By...
- No citing articles found.