


Abstract
The aim was to compare the prostate-specific membrane antigen (PSMA)–targeting characteristics of PSMA-11, radiolabeled on the basis of chelation of 18F-AlF, with those of 68Ga-PSMA-11 to image PSMA-expressing xenografts. Methods: Labeling of 18F-AlF-PSMA-11 via 18F-AlF-complexation was performed as described by Boschi et al. and Malik et al. with minor modifications. Several conditions for the quality control of the labeling of 18F-AlF-PSMA-11 via 18F-AlF-complexation were evaluated to characterize the influence of ethanol, acetonitrile, and trifluoroacetic acid on the stability of the labeled product. Internalization kinetics of 18F-AlF-PSMA-11 were compared with those of 68Ga-PSMA-11 using PSMA-expressing LNCaP tumor cells. Biodistribution of 18F-AlF-PSMA-11 (0.26 nmol/mouse, 8–9 MBq/mouse) in male BALB/c nude mice with PSMA-expressing subcutaneous LS174T-PSMA tumors was compared with that of 68Ga-PSMA-11 at 1 and 2 h after injection. In addition, 18F-AlF-PSMA-11 PET/CT and 68Ga-PSMA-11 PET/CT imaging were performed at 1 and 2 h after injection. Results: In contrast to 68Ga-PSMA-11, 18F-AlF-PSMA-11 was not stable in water (radiochemical purity was 64.5% immediately after purification and 52.7% at 120 min after purification). 18F-AlF-PSMA-11 remained relatively stable in 25 mM NH4OAc, pH 6.9, and radiochemical purity decreased from 98.5% at purification to 96.3%, 94.7%, and 92.5% at 60, 120, and 180 min after purification. In vitro, the 18F- and 68Ga-labeled compounds showed rapid internalization in LS174T-PSMA cells. The highest tumor uptake (percentage injected dose [%ID]) was observed at 2 h after injection (10.8 ± 2.3 %ID/g and 7.9 ± 1.3 %ID/g for 18F-AlF-PSMA-11 and 68Ga-PSMA-11, respectively [P > 0.05]). Renal tracer uptake peaked at 2 h after injection (43.5 ± 5.7 %ID/g and 105.8 ± 13.8 %ID/g for 18F-AlF-PSMA-11 and 68Ga-PSMA-11, respectively, P < 0.05). Bone uptake of 18F-AlF-PSMA-11 was 3.3 ± 0.6 at 1 h after injection and 5.0 ± 0.6 %ID/g at 2 h after injection and was dependent on the radiochemical purity at the time of injection. Bone uptake of 68Ga-PSMA-11 reached 0.1 ± 0.0 %ID/g at 1 and 2 h after injection. PSMA-expressing xenografts could be visualized using both 68Ga-PSMA-11- and 18F-AlF-PSMA-11 PET/CT. Conclusion: 18F-AlF-PSMA-11 using direct labeling with aluminum fluoride can be produced in NH4OAc, pH 6.9; shows a high internalization rate; and visualizes PSMA-expressing tumors with similar tumor uptake. Lower kidney uptake than with 68Ga-PSMA-11 may be advantageous for tumor detection. However, the limited instability and consequent Al18F uptake in bone might hamper the visualization of small PCa bone metastases.
Prostate cancer (PCa) represents a major health problem causing significant morbidity and mortality worldwide. As PCa treatment depends largely on the stage of the disease, early diagnosis of primary PCa and of disease recurrence is crucial. Since digital-rectal examination, transrectal ultrasound-guided biopsy, and CT have limited sensitivity and specificity for diagnosing PCa, imaging techniques such as MRI have attracted attention not only by allowing anatomic assessment of regions of interest but also by adding functional information from diffusion-weighted imaging or dynamic contrast enhancement. Recently, radionuclide imaging with PET/CT has become the center of attention. So far, various targets for PCa imaging and therapy have been identified, of which the prostate-specific membrane antigen (PSMA), a transmembrane glycoprotein that is overexpressed in most local PCa lesions and in malignant lymph nodes and bone metastases, has been demonstrated to be an excellent target (1–3). With the development of highly specific radiolabeled ligands for PSMA, this target has been used successfully for imaging and therapy of PCa. Among these, 68Ga-labeled ligands have been extensively studied and introduced into the clinic (4–8). However, the use of 68Ga-labeled compounds is restricted by the short half-life and need for a generator, which allows preparation of no more than 1–4 patient doses per elution. In contrast, 18F is cyclotron-produced, and much larger doses can be obtained in a single production cycle. This capability also allows centralized off-site production and commercial distribution over longer distances, and the need for on-site labeling would be eliminated. In addition, because of the short positron range, imaging with 18F may result in higher image resolution and thus improved detection of small tumor lesions. So far, several 18F-labeled PSMA ligands have been developed (9–11). However, either the available compounds are patented and not commonly accessible or synthesis involves multiple steps (9). Therefore, direct labeling of PSMA ligands via aluminum fluoride 18F-AlF-complexation has been developed recently, providing a simple and freely accessible method for synthesis of 18F-labeled agents for PET imaging (12). In the present study, we aimed to establish this method for PSMA ligands and characterize 18F-AlF-PSMA-11, radiolabeled on the basis of chelation of 18F-AlF, in vitro and in vivo and directly compare it with 68Ga-PSMA-11 regarding stability, internalization capacity, and biodistribution profile, together with potential to image PCa.
MATERIALS AND METHODS
Synthesis
PSMA Ligand
Glu-urea-Lys (Ahx)-HBED-CC (PSMA-11) was purchased from ABX GmbH. All reagents and solutions were produced metal-free. AlCl3⋅6H2O was dissolved in metal-free water. The high-performance liquid chromatography (HPLC) eluents used (water, acetonitrile, trifluoroacetic acid [TFA], ethanol, and NH4OAc) were of high-grade purity. Sep-Pak Accell Plus QMA and Sep-Pak C18-Light cartridges were purchased from Waters Chromatography. No-carrier-added 18F-fluoride was received from RTM, at 5–11 GBq in 2.5-mL aqueous solution.
Preparation of 18F-Fluoride
All buffers and solutions were metal-free. The QMA cartridge was conditioned with 5 mL of 0.5 M sodium acetate, followed by 10 mL of water (MilliQ). 18F-fluoride solution was loaded onto the cartridge and, after washing with 5 mL of water, Na18F was eluted by 300 μL of 0.05 M NaOAc buffer, pH 4.5, in 3 fractions of 100 μL (0.08–6.05 GBq). The most concentrated Na18F fraction was used for radiolabeling.
Synthesis of 18F-AlF-PSMA-11
A 100-μL volume of Na18F (0.62–2.4 GBq) in 100 μL of 0.05 M NaOAc solution was added to 3 μL of 0.5 M AlCl3⋅6H2O in 0.5 M NaOAc, pH 5, and 12.5 μL (25 μg) of PSMA-11. Subsequently, 100% ethanol (180 μL) was added to a final reaction volume of 300 μL, and the mixture was heated at 50°C for 15 min and heated for 5 min under a N2 flow to evaporate ethanol in the reaction mixture. The labeling efficiency was determined using HPLC.
Solid-Phase Extraction Purification of 18F-AlF-PSMA-11
Directly after synthesis, a 100-μL volume of 1.0 M NH4OAc, pH 6.9, was added and the volume adjusted to 1,000 μL with water. A Sep Pak C18 Plus cartridge was activated using 10 mL of 100% ethanol and 10 mL of water. The reaction mixture was loaded on the activated Sep Pak C18 Plus cartridge and washed with 3 mL of water. 18F-AlF-PSMA-11 was eluted with 0.5–1 mL of 20% ethanol in 0.1 M NH4OAc, pH 6.9. Directly after elution, the volume was diluted with 0.1 M NH4OAc, pH 6.9, to decrease the ethanol concentration, and quality control was performed using HPLC.
Quality Control of 18F-AlF-PSMA-11
Quality control was performed by HPLC analysis, using a 4.6 × 250 mm, 5-μm Alltima C18 reversed-phase column (HiCHROM). For the isocratic elution of the radiolabeled product, free 18F-AlF, and other impurities, different elution buffers were tested. HPLC buffer set 1, also used to analyze the purity of the 68Ga-PSMA-11, consisted of water with 0.1% TFA as buffer A and acetonitrile with 0.1% TFA as buffer B. HPLC buffer set 2 consisted of 25 mM NH4OAc, pH 6.9, as buffer A and 100% ethanol as buffer B. All HPLC analyses were performed with a flow rate of 1 mL/min.
In Vitro Characterization
In Vitro Stability
18F-AlF-HBED-CC-PSMA and 68Ga-PSMA-11 (radiochemical purity > 95%) were incubated in 0.1 M NH4OAc, pH 6.9, buffer for 2 h at room temperature. After 0, 30, 60, 90, and 120 min, a sample was analyzed on HPLC. Samples were analyzed using both HPLC elution buffer sets. Results were quantified using GINA star software (Raytest GmbH).
Internalization Assay
LS174T-PSMA cells were cultured in 6-well plates and incubated with 1.9 kBq of 18F-AlF-PSMA-11 or 68Ga-PSMA-11 (radiochemical purity > 95%) for 30, 60, and 120 h in 2 mL of binding buffer (RPMI medium containing 0.5% BSA) at 37°C in a humidified atmosphere with 5% CO2. Nonspecific binding and internalization were determined by coincubation with 100 nmol of the PSMA blocking agent 2-(phosphonomethyl)pentane-1,5-dioic acid (PMPA, 100 nmol). After incubation, acid wash buffer (0.1 M HAc, 0.15 M NaCl, pH 2.6), in which 68Ga-PSMA-11 is stable (data not shown), was added for 10 min to remove the membrane-bound fraction of the cell-associated 18F-AlF-PSMA-11/68Ga-PSMA-11. Subsequently, cells were harvested from 6-well plates, and the amount of membrane bound (acid wash) and internalized activity (harvested cells) was measured in a γ-counter.
Animal Models
Animal experiments were conducted in accordance with the principles laid out by the revised Dutch Act on Animal Experimentation (2014) and approved by the institutional Animal Welfare Committee of the Radboud University Nijmegen and the central authority for scientific procedures on animals. Male BALB/c nude mice (Janvier), 7–8 wk old, were housed in individually ventilated filter-topped cages (5 mice per cage) under nonsterile standard conditions with free access to standard animal chow and water. After 1 wk of adaptation to laboratory conditions, 3 × 10⁶ PSMA-transfected LS174T cells (13) were suspended in 200 μL of complete RPMI 1640 medium and injected subcutaneously (right flank). LS174T-PSMA cells were grown in RPMI 1640 medium supplemented with 10% fetal calf serum (Life Technologies), 2 mM glutamine, and a 0.3 mg/mL concentration of G481.
Small-Animal PET/CT Imaging and Ex Vivo Biodistribution
18F-AlF-PSMA-11 (0.26 nmol, 6.6 ± 1.1 MBq/mouse) or 68Ga-PSMA-11 (0.26 nmol, 6.2 ± 0.3 MBq/mouse) was injected intravenously into mice with subcutaneous LS174T-PSMA tumors. One additional group of 5 mice received an additional intravenous injection of 10% free 18F-AlF together with 18F-AlF-PSMA-11 to evaluate the role of free 18F-AlF on the biodistribution profile of 18F-AlF-PSMA-11. The mice were euthanized by CO2/O2 asphyxiation, and the biodistribution of 18F-AlF-PSMA-11 and 68Ga-PSMA-11 was determined 1 and 2 h after injection. Blood samples were obtained by cardiac puncture, tissues of interest (tumors, lung, muscle, spleen, pancreas, kidney, liver, stomach, duodenum, prostate, glandula parotis, bone, and bone marrow) were dissected and weighed, and the radioactivity was measured in a γ-counter. For calculation of the uptake of radioactivity in each tissue as a fraction of the injected dose, an aliquot of the injection dose was counted simultaneously. Before euthanasia and dissection, the mice underwent microPET/CT imaging (Siemens Preclinical Solutions). Small-animal PET images were acquired for 20 min, followed by a CT scan (113 μm, 80 kV, 500 μA) for anatomic reference. The small-animal PET/CT scans were reconstructed with Inveon Acquisition Workplace software (version 1.5; Siemens Preclinical Solutions), using iterative 3-dimensional ordered-subset expectation maximization and maximum a priori with shifted Poisson distribution, with the following parameters: matrix, 256 × 256; pixel size, 0.4 × 0.4 × 0.8 mm; β-value of 1.5-mm resolution; and Feldkamp algorithm for CT reconstruction.
Statistical Analysis
Differences in uptake between 68Ga-PSMA-11 and 18F-AlF-PSMA-11 were tested for significance via 1-way ANOVA and Bonferroni multiple comparison after analysis using GraphPad Prism, version 5.03. A P value below 0.05 was considered significant.
RESULTS
Radioligand Synthesis
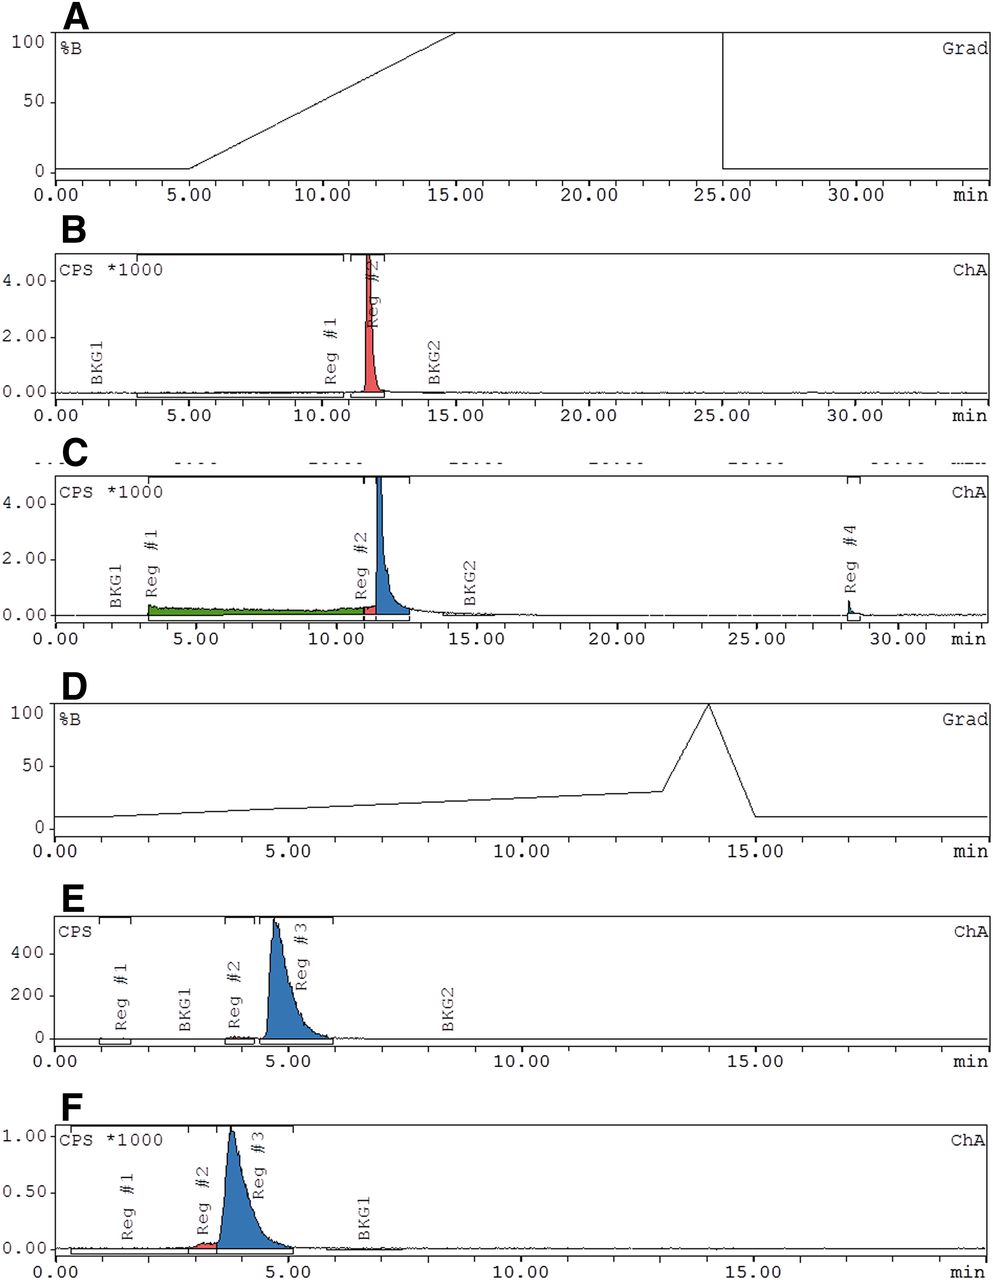
Stability of the reference compound 68Ga-PSMA-11 in 0.1 M NH4OAc, pH 6.9, was shown by HPLC by both elution buffer sets (Fig. 1). Radiochemical purity was 99.97% ± 0.03% directly after purification and remained stable at 30 min (>99%), 60 min (>99%), 120 min (>99%), and 180 min (>99%) after purification. In contrast, the stability of 18F-AlF-PSMA-11 was reduced directly after purification (64.5%) and decreased further at 30 min (61.1%), 60 min (61.3%), and 120 min (52.7%) after purification using HPLC buffer set 1. Using buffer set 2, stability results were more comparable with the reference compound, showing 98.5% purity directly after purification and slowly decreasing over time at 30 min (96.8%), 60 min (96.3%), 120 min (94.7%), and 180 min (92.5%) after purification (Fig. 2). These results indicate increased instability during analysis because of the composition of the elution buffers.

(A) HPLC buffer set 1: gradient of buffer A (water with 0.1% TFA) and buffer B (acetonitrile with 0.1% TFA), starting with 3% buffer B at 5 min up to 100% buffer B at 15 min. (B) Elution of 68Ga-PSMA-11 with retention time of 11.73 min (radiochemical purity 100%). (C) Elution of 18F-AlF-PSMA-11 with retention time of 11.52 min (radiochemical purity 64.5%). (D) HPLC buffer set 2: buffer A (25 mM NH4OAc pH 6.9) and buffer B (100% ethanol), starting with 10% buffer B at 1 min to 30% buffer B at 13 min up to 100% at 14 min. (E) Elution of 68Ga-PSMA-11 with retention time of 4.72 min (radiochemical purity 99.0%). (F) Elution of 18F-AlF-PSMA-11 with retention time of 3.78 min (radiochemical purity 98.5%).
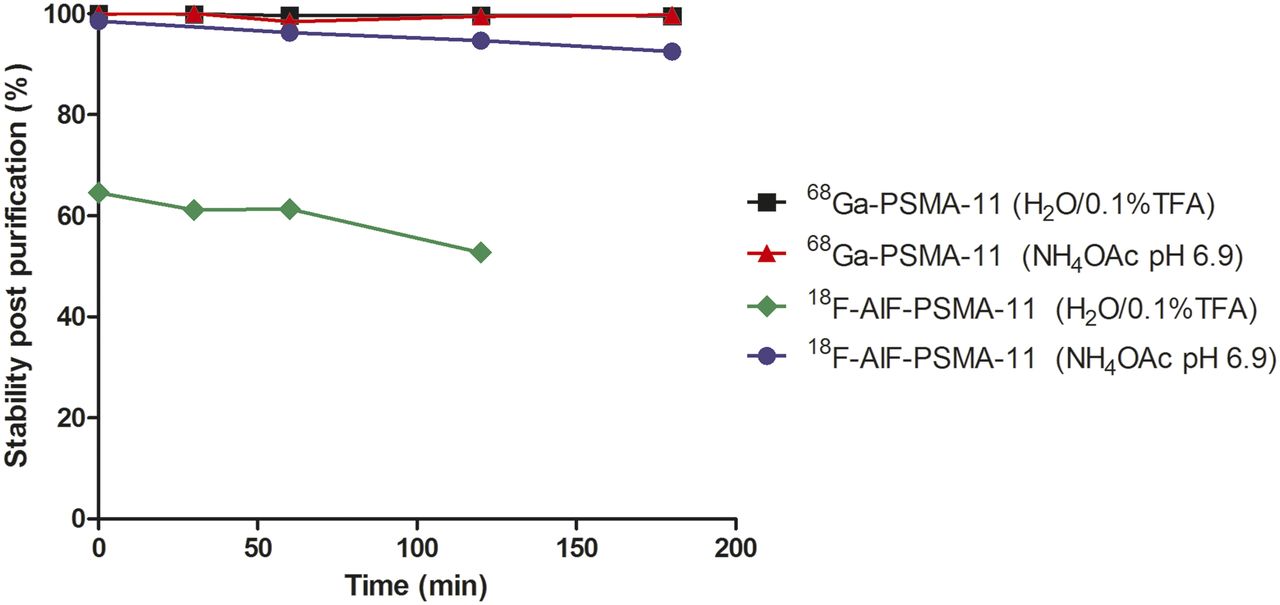
Stability of 68Ga-PSMA-11 and 18F-AlF-PSMA-11 in NH4OAc, pH 6.9, as shown by HPLC analysis using different elution buffers.
Internalization
The radiochemical purity of 18F-AlF-PSMA-11 and 68Ga-PSMA-11 used in this experiment was more than 95%. The internalization capacity of 18F-AlF-PSMA-11 into PSMA-expressing LS174T-PSMA cells was evaluated and compared with that of the reference compound, 68Ga-PSMA-11 (Fig. 3). Tracer binding and internalization into LS174T-PSMA cells was PSMA-specific and could be blocked with PMPA. 18F-AlF-PSMA-11 and the reference compound, 68Ga-PSMA-11, showed a similar internalization rate at 30 min and 60 min. Internalization of 18F-AlF-PSMA-11 occurred slowly and plateaued at 60 min. During the first hour, 18F-AlF-PSMA-11 was mainly membrane-bound. Internalization of 18F-AlF-PSMA-11 only slightly increased between 60 and 120 min. At 120 h, internalization of 68Ga-PSMA-11 was significantly higher than that of 18F-AlF-PSMA-11 (13.8% ± 0.7% and 10.8% ± 0.4%, respectively, P < 0.0001).

Internalization kinetics of 18F-AlF-PSMA-11 (A) and 68Ga-PSMA-11 (B) in PSMA-expressing LS174T-PSMA cells. Binding and internalization are presented as percentage of added activity (mean ± SD).
Biodistribution
The radiochemical purity of 18F-AlF-PSMA-11 used in this experiment was more than 95%. 18F-AlF-PSMA-11 and 68Ga-PSMA-11 efficiently accumulated in the PSMA-expressing LS174T-PSMA tumors. Tumor uptake (percentage injected dose [%ID]) of 18F-AlF-PSMA-11 was not significantly different from that of the reference compound, 68Ga-PSMA-11, at 1 h (14.6 ± 7.6 %ID/g and 10.4 ± 2.3 %ID/g, respectively) and 2 h (10.8 ± 2.3 %ID/g and 7.9 ± 1.3 %ID/g, respectively, P > 0.05) after injection (Table 1). No differences in blood levels were observed. The 18F-AlF-PSMA-11 concentration in the blood decreased from 0.3 ± 0.2 %ID/g at 1 h after injection to 0.1 ± 0.0 %ID/g at 2 h after injection, and blood levels of 68Ga-PSMA-11 decreased from 0.4 ± 0.4 %ID/g at 1 h after injection to 0.3 ± 0.2 %ID/g at 2 h after injection.
Biodistribution at 1 and 2 Hours After Injection
Significant differences were observed in kidneys and bone. Accumulation of the reference compound, 68Ga-PSMA-11, in the kidneys was 105.8 ± 13.8 %ID/g at 2 h after injection, compared with 43.5 ± 5.7 %ID/g at 2 h after injection for 18F-AlF-PSMA-11 (P < 0.0001). Furthermore, 68Ga-PSMA-11 did not show accumulation in the bones at either time point (0.1 ± 0.0 %ID/g at both 1 and 2 h after injection), whereas 18F-AlF-PSMA-11 showed considerable bone uptake, which increased over time (3.3 ± 0.6 %ID/g at 1 h after injection and 5.0 ± 0.6 %ID/g at 2 h, P < 0.0001).
Since the radiochemical purity of 18F-AlF-PSMA-11 used in this experiment exceeded 95%, we included an additional group of mice that received 18F-AlF-PSMA-11 together with 10% free 18F-AlF to evaluate the role of free 18F-AlF on the biodistribution profile of 18F-AlF-PSMA-11. Administration of 10% free 18F-AlF together with more than 95% radiochemically pure 18F-AlF-PSMA-11 did not significantly change the tumor uptake of 18F-AlF-PSMA-11. However, the addition of 10% 18F-AlF resulted in significantly increased accumulation in bone (femur containing bone marrow) (7.1 ± 1.3 %ID/g at 1 h and 7.0 ± 0.8 %ID/g at 2 h for free 18F-AlF + 18F-AlF-PSMA-11 vs. 3.3 ± 0.6 %ID/g at 1 h and 5.0 ± 0.6 %ID/g at 2 h for 18F-AlF-PSMA-11 alone, P < 0.05). Bone marrow uptake reached 7.3 ± 0.6 %ID/g at 1 h and 7.4 ± 2.0 %ID/g at 2 h for free 18F-AlF + 18F-AlF-PSMA-11, whereas bone marrow uptake was significantly lower for 18F-AlF-PSMA-11 alone (2.5 ± 1.6 %ID/g at 1 h and 0.6 ± 0.2 %ID/g at 2 h, P < 0.0001). Bone uptake of 68Ga-PSMA-11 reached 0.1 ± 0.0 %ID/g at 1 and 2 h after injection.
Small-Animal PET/CT Imaging
Representative 3-dimensionally rendered PET/CT images of mice that received 18F-AlF-PSMA-11 and 68Ga-PSMA-11 were obtained at 1 and 2 h after injection and are displayed in Figure 4. As early as 1 h, uptake of 18F-AlF-PSMA-11 was observed in PSMA-expressing tumors. Tumors were visualized clearly with both 18F-AlF-PSMA-11 and 68Ga-PSMA-11. On the basis of visual, nonquantitative analysis, the clearest visualization of PSMA-expressing tumors was obtained with 18F-AlF-PSMA-11 at 1 h, with only marginal interference from bone uptake. This observation was strengthened by quantitative analysis of PET/CT images obtained from mice scanned at 1 and 2 h (Fig. 5). Tumor uptake was significantly higher at 1 h than at 2 h for both maximal tumor uptake and mean tumor uptake (Bq/mL). Maximal tumor uptake ranged from 6.5 × 10⁵ ± 1.1 × 10⁵ Bq/mL at 1 h to 3.5 × 10⁵ ± 1.3 × 10⁵ at 2 h (P = 0.0018). Mean tumor uptake of 18F-AlF-PSMA-11 ranged from 3.8 × 10⁵ ± 0.7 × 10⁵ at 1 h to 2.1 × 10⁵ ± 1.0 × 10⁵ at 2 h (P = 0.001).

Representative PET/CT images of BALB/c nude mice with subcutaneous PSMA-expressing LS174T-PSMA tumors on right flank (arrows) obtained at 1 and 2 h after injection of 68Ga-PSMA-11 (0.26 nmol) and 18F-AlF-PSMA-11 (0.26 nmol). PET/CT images for 18F-AlF-PSMA-11 were obtained from 1 mouse that was scanned at 1 and 2 h after injection. CT was recorded separately from PET because of technical issues; therefore, PET/CT alignment is slightly off. PET/CT images for 68Ga-PSMA-11 were obtained from 2 mice, one scanned at 1 h after injection and other at 2 h after injection because of short half-life of 68Ga. p.i. = after injection.
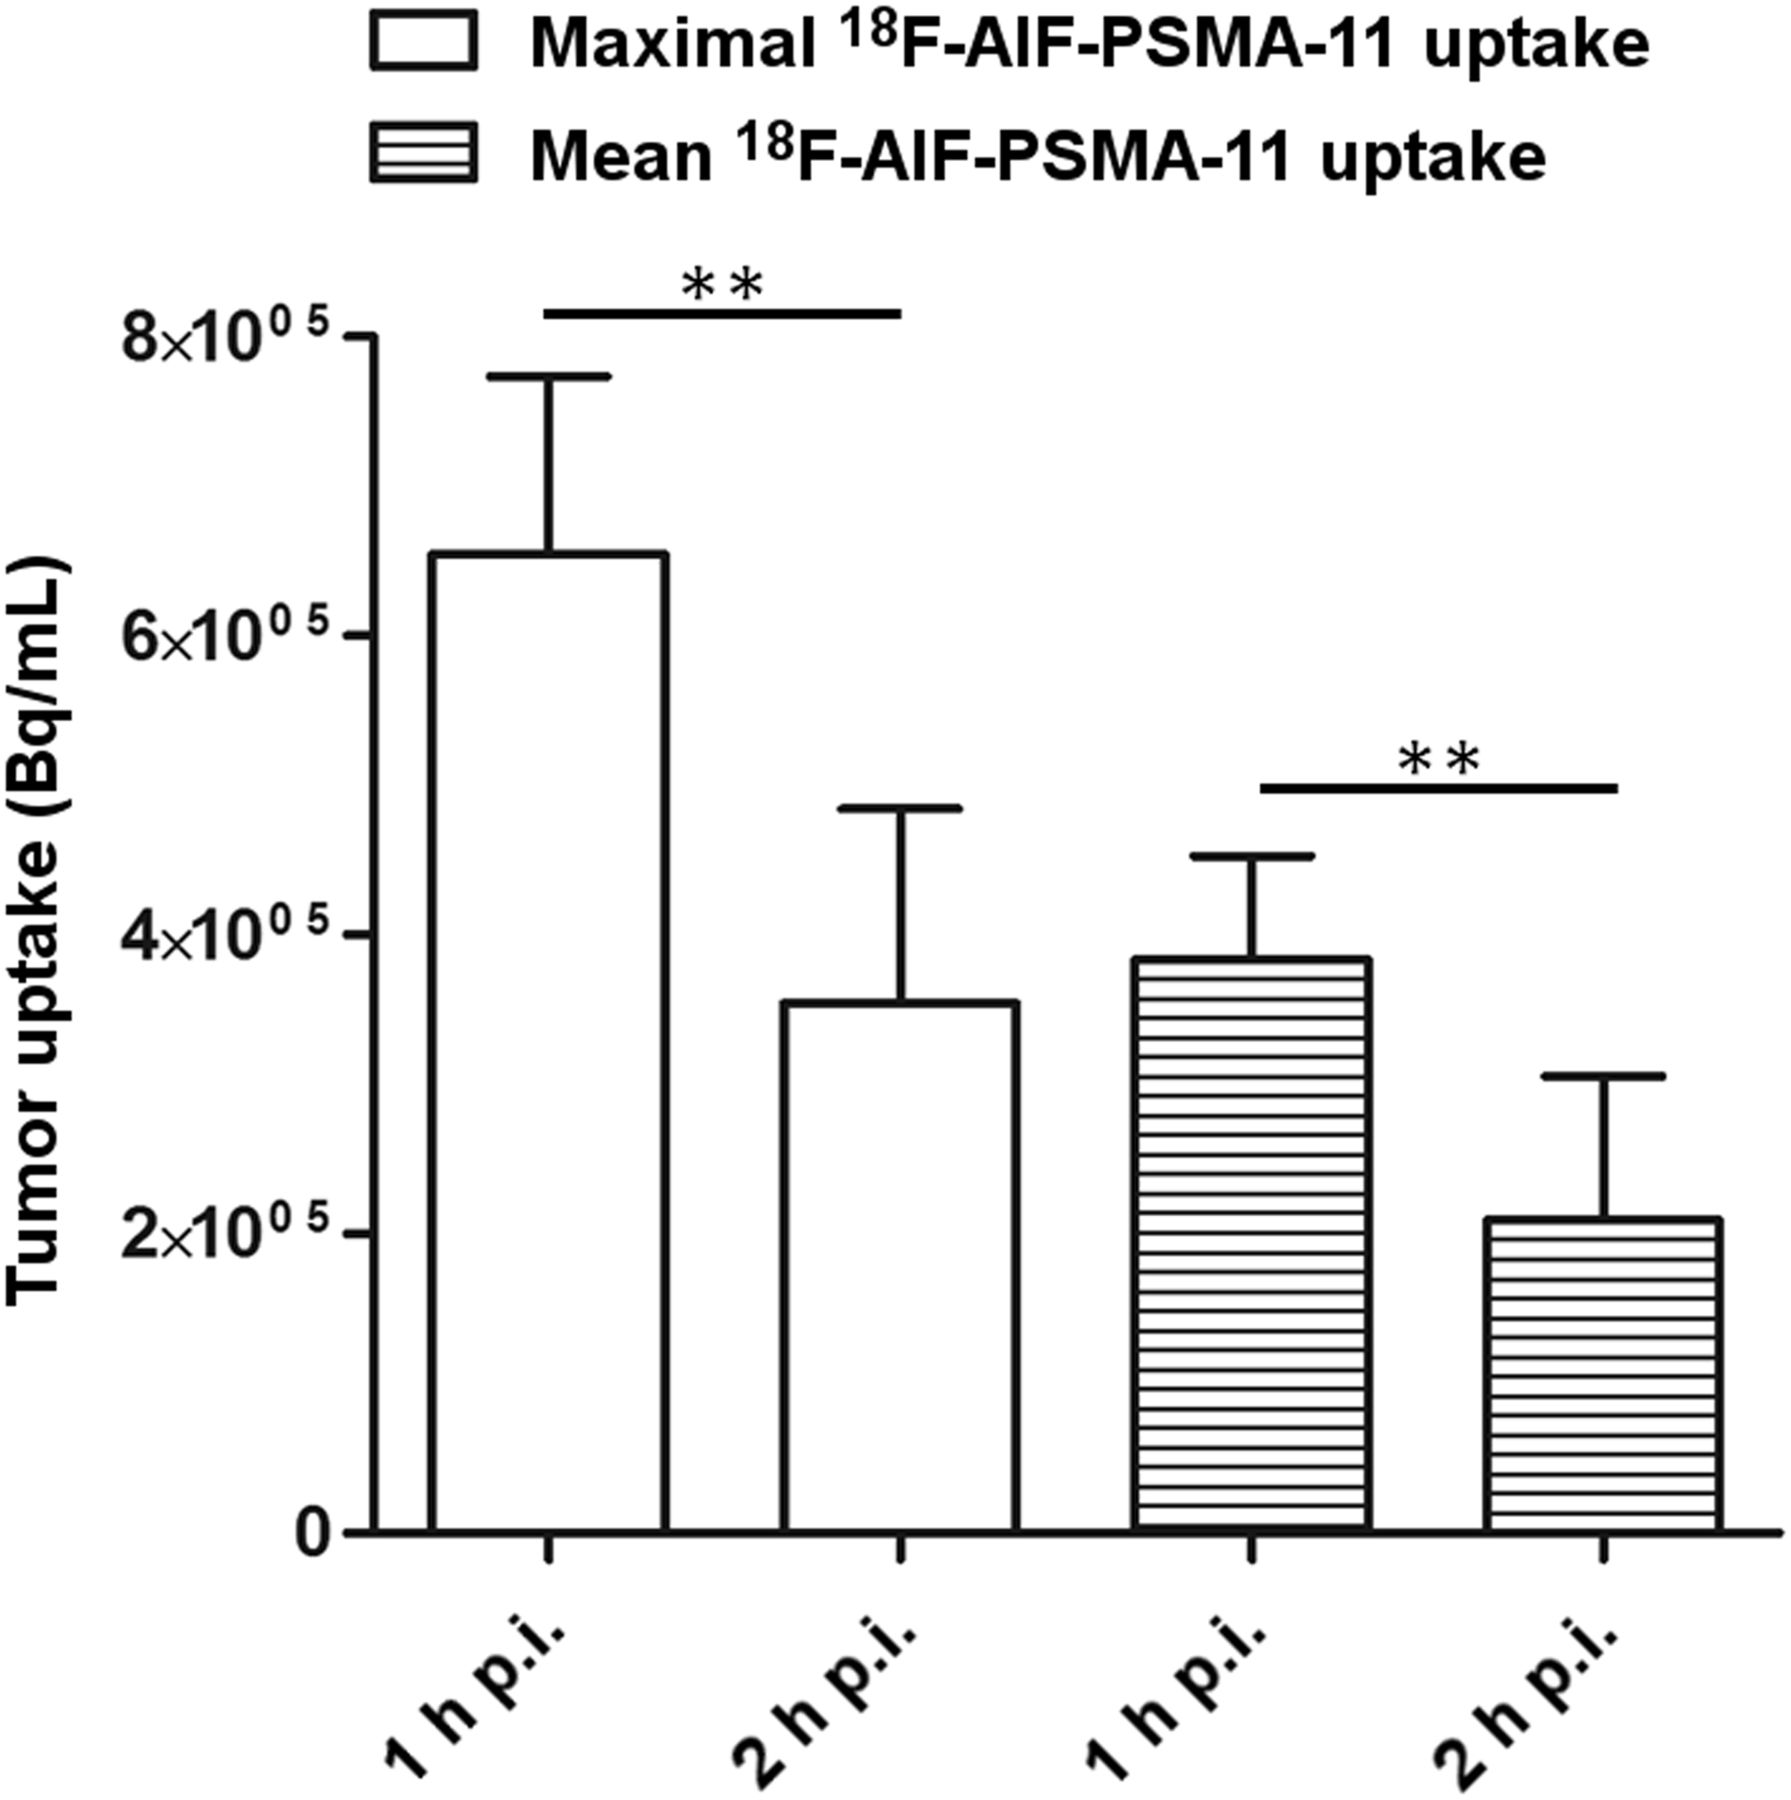
Maximal and mean tumor uptake of 18F-AlF-PSMA-11 determined from PET/CT images of 4 mice scanned at 1 and 2 h after injection. Data are mean ± SD. **Statistically significant difference. p.i. = after injection.
DISCUSSION
In the present study, we report both the synthesis and the in vitro and in vivo characterization of 18F-AlF-PSMA-11 based on chelation of 18F-AlF to visualize PCa, and we compare 18F-AlF-PSMA-11 with the clinically used 68Ga-PSMA-11.
So far, 68Ga-labeled ligands have been extensively studied and successfully introduced for PCa imaging in the clinical setting (4–8). However, differential pharmacokinetics and pharmacodynamics of 18F-labeled PSMA ligands may lead to improved primary tumor detection in patients at the cost of poor specificity for bone lesions, especially in the scenario of low-level PSA or initial biochemical residual disease.
So far, several 18F-labeled PSMA ligands have been clinically tested. Pomper’s group developed the 18F-labeled PSMA ligand 18F-DCFPyL which has shown promising characteristics in visualization of PCa preclinically (9) and in first clinical studies (14–16). Cardinale et al. set out to synthesize the 18F-labeled PSMA ligand 18F-PSMA-1007, which mimics the biodistribution profile of radiolabeled PSMA-617. The PSMA ligand PSMA-617 is chelated with DOTA instead of HBED-CC and allows stable complexes with β-particle–emitting radionuclides such as 177Lu or 90Y (17). In that study, 18F-PSMA-1007 was produced by a 2-step procedure with the prosthetic group 6-18F-fluoronicotinic acid 2,3,5,6-tetrafluorophenyl ester. Biodistribution in mice with PSMA-expressing xenografts revealed high and specific tumor uptake (17).
Recently, Boschi et al. labeled PSMA-11 via aluminum fluoride 18F-AlF-complexation as an analog to the established 68Ga-PSMA-11 and reported high radiochemical purity and product yields together with high tumor-to-background ratios in mice with PSMA-expressing xenografts (18). Still, a minimal amount of defluorination was observed, which did not hamper visualization of tumors in preclinical models; however, the impact of defluorination on visualization of bone metastases in patients with PCa is not known. In the present study, we further investigated the stability of 18F-AlF-PSMA-11, which was labeled via 18F-AlF-complexation, and evaluated the impact of defluorination on the biodistribution profile of 18F-AlF-PSMA-11 in mice with PSMA-expressing tumors.
Boschi et al. reported a more than 97% radiochemical purity in buffered solution at pH 6.8 in comparison with unbuffered saline solution, with which a 20% decrease in radiochemical purity after 3 h was observed (18). Al-Momani et al. recently set out to validate 18F-AlF-PSMA-11 labeled via 18F-AlF-complexation for clinical applications and reported facile and high-yielding radiosynthesis (19). In that study, the radiochemical stability of 18F-AlF-PSMA-11 was tested in different solutions, including phosphate-buffered saline, pH 7.0; 1% ethanol in acetate buffer; 10% ethanol in acetate buffer; and 1% ethanol in saline. The authors reported radiochemical purities of more than 98% in ethanol/saline after 4 h, whereas radiochemical purity decreased to 90% in acetate containing 10% ethanol after 4 h (19). Formulation with 1% ethanol in acetate buffer resulted in a radiochemical purity of 86% and 37% after 1 and 4 h, respectively (19).
In the present study, the internalization profiles of 18F-AlF-PSMA-11 and the reference compound, 68Ga-PSMA-11, were compared to evaluate whether lack of stability impairs the internalization capacity of 18F-AlF-PSMA-11. However, the internalization profiles of 18F-AlF-PSMA-11 and 68Ga-PSMA-11 after 30 and 60 min were similar, whereas internalization of 68Ga-PSMA-11 was significantly higher than that of 18F-AlF-PSMA-11 after 120 min. Biodistribution revealed comparable tumor uptake in PSMA-expressing tumors with both compounds at 1 and 2 h after injection. Biodistribution also demonstrated fast renal uptake of both compounds; however, renal uptake of 18F-AlF-PSMA-11 was significantly lower than that of the reference compound, 68Ga-PSMA-11, which might be advantageous because high renal accumulation of 68Ga-PSMA-11 could hamper visualization of small tumor lesions near the urinary tract. In comparison, for their product, Boschi et al. reported renal accumulation reaching 119.3 ± 16.5 %ID/g at 1 h after injection in mice (18).
Although 68Ga-PSMA-11 does not show accumulation in bone, a significant PET signal was observed in the bones after injection of 18F-AlF-PSMA-11 and increased over time, suggesting relevant defluorination of the tracer in vivo, which is in line with our in vitro stability results and previous studies (18). To evaluate whether defluorination is indeed responsible for accumulation in bone, an additional group of mice received 18F-AlF-PSMA-11 supplemented with 10% free 18F-AlF. Although the addition of free 18F-AlF did not significantly affect tumor uptake compared with 18F-AlF-PSMA-11 alone, significantly increased bone accumulation was observed. However, on small-animal PET/CT imaging, PSMA-expressing tumors were clearly visualized, with only minor interference originating from tracer accumulation in the bones. However, in this tumor model, subcutaneous xenografts were used that were not near the bones, and in the clinical setting a significant number of patients with PCa present with bone metastases. In these cases, bone accumulation of the tracer might hamper visualization of lesions, particularly those that are small or have low PSMA expression.
CONCLUSION
Taken together, 18F-AlF-PSMA-11 using direct labeling with aluminum fluoride can be produced in high yield in a 1-step procedure in NH4OAc, pH 6.9, for in vivo use; shows comparable internalization capacity; and visualizes PSMA-expressing tumors with comparable tumor uptake and blood clearance to that of 68Ga-PSMA-11. However, in the clinical setting, the amount of defluorination observed might hamper visualization of bone metastases. In addition, central production and commercial distribution over longer distances might be limited because the labeled product loses its stability over time. Future studies are warranted to evaluate whether the observed defluorination of 18F-AlF-PSMA-11 can be prevented and to compare 18F-AlF-PSMA-11 with other 18F-labeled PSMA ligands such as 18F-DCFPyL, an 18F-PSMA-1007.
DISCLOSURE
No potential conflict of interest relevant to this article was reported.
Acknowledgments
We thank Bianca Lemmers-van de Weem, Iris Lamers-Elemans, Mike Peters, and Kitty Lemmens-Hermans for technical assistance with the animal experiments.
Footnotes
Published online Jan. 17, 2019.
- © 2019 by the Society of Nuclear Medicine and Molecular Imaging.
REFERENCES
- Received for publication August 31, 2018.
- Accepted for publication November 26, 2018.


Jump to section
Related Articles
Cited By...
- No citing articles found.