


Abstract
Radiolabeled prostate-specific membrane antigen (PSMA) PET has demonstrated promising results for prostate cancer (PCa) imaging. Quantification of PSMA radiotracer uptake is desired as it enables reliable interpretation of PET images, use of PSMA uptake as an imaging biomarker for tumor characterization, and evaluation of treatment effects. The aim of this study was to perform a full pharmacokinetic analysis of 2-(3-(1-carboxy-5-[(6-18F-fluoro-pyridine-3-carbonyl)-amino]-pentyl)-ureido)-pentanedioic acid (18F-DCFPyL), a second-generation 18F-labeled PSMA ligand. On the basis of the pharmacokinetic analysis (reference method), simplified methods for quantification of 18F-DCFPyL uptake were validated. Methods: Eight patients with metastasized PCa were included. Dynamic PET acquisitions were performed at 0–60 and 90–120 min after injection of a median dose of 313 MBq of 18F-DCFPyL (range, 292–314 MBq). Continuous and manual arterial blood sampling provided calibrated plasma tracer input functions. Time–activity curves were derived for each PCa metastasis, and 18F-DCFPyL kinetics were described using standard plasma input tissue-compartment models. Simplified methods for quantification of 18F-DCFPyL uptake (SUVs; tumor-to-blood ratios [TBRs]) were correlated with kinetic parameter estimates obtained from full pharmacokinetic analysis. Results: In total, 46 metastases were evaluated. A reversible 2-tissue-compartment model was preferred for 18F-DCFPyL kinetics in 59% of the metastases. The observed k4 was small, however, resulting in nearly irreversible kinetics during the course of the PET study. Hence, k4 was fixated (0.015) and net influx rate, Ki, was preferred as the reference kinetic parameter. Whole-blood TBR provided an excellent correlation with Ki from full kinetic analysis (R2 = 0.97). This TBR could be simplified further by replacing the blood samples with an image-based, single measurement of blood activity in the ascending aorta (image-based TBR, R2 = 0.96). SUV correlated poorly with Ki (R2 = 0.47 and R2 = 0.60 for SUV normalized to body weight and lean body mass, respectively), most likely because of deviant blood activity concentrations (i.e., tumor tracer input) in patients with higher tumor volumes. Conclusion: 18F-DCFPyL kinetics in PCa metastases are best described by a reversible 2-tissue-compartment model. Image-based TBRs were validated as a simplified method to quantify 18F-DCFPyL uptake and might be applied to clinical, whole-body PET scans. SUV does not provide reliable quantification of 18F-DCFPyL uptake.
Prostate cancer (PCa) is the most common cancer in men in the Western world (1,2). PET is increasingly used for PCa diagnostics, as it enables early detection of metastases and molecular characterization in vivo. For PCa diagnostics, prostate-specific membrane antigen (PSMA)–binding radiotracers have shown promising results (3). PSMA is a class II transmembrane glycoprotein that provides a valuable target for radiolabeled imaging because its expression is upregulated in malignant prostate cells and is associated with higher tumor grades and risk of disease progression (4).
At present, 68Ga-labeled PSMA tracers (half-life, 68 min) have been studied most extensively (3,5). Alternatively, 18F-labeled tracers have been developed—for example, 2-(3-(1-carboxy-5-[(6-18F-fluoro-pyridine-3-carbonyl)-amino]-pentyl)-ureido)-pentanedioic acid (18F-DCFPyL), a second-generation small-molecule ligand with strong PSMA binding characteristics (6,7). The 18F-radionuclide provides a higher PET image resolution than 68Ga because of a shorter positron range and higher positron yield (3). This may improve detection of PCa metastases, as was demonstrated in a head-to-head comparison between 18F-DCFPyL and 68Ga-PSMA PET/CT (8). Additionally, the longer half-life of 18F (110 min) allows centralized, large-scale production of the PSMA tracer.
In clinical practice, PET scans are assessed mostly visually or using semiquantitative measurements of tracer accumulation (SUV). However, visual assessment is intrinsically observer-dependent, and semiquantitative measures should be carefully validated first because they do not always reflect the tracer’s pharmacokinetics (9). To ensure reliable evaluation of 18F-DCFPyL PET images, accurate quantification of 18F-DCFPyL uptake is thus desired. Moreover, quantification of 18F-DCFPyL uptake may serve as an imaging biomarker for tumor characterization (e.g., histologic grade or prognostic outcome) and allow evaluation of treatment response.
The most elaborate and accurate method for quantification of tracer uptake is pharmacokinetic modeling based on dynamic PET acquisitions and plasma input functions, requiring metabolite-corrected arterial blood sampling (10). The complexity of these procedures and the related patient discomfort make full pharmacokinetic modeling unsuited for daily clinical practice. Hence, simplified methods are needed to approximate full quantitative analysis. In this study, we aimed to validate simplified methods for quantification of 18F-DCFPyL uptake against results from pharmacokinetic analysis, in patients with PCa.
MATERIALS AND METHODS
Patients
Eight patients were included in this study at the Amsterdam University Medical Center between February and August 2018. Inclusion criteria were histologically proven PCa, 2 or more thoracic metastases (detected by routine clinical imaging studies, performed maximally 3 mo before the study), and at least 1 metastasis 1.5 cm or larger (to minimize partial-volume effects). Thoracic metastases were required, to allow PET imaging of both tumor tissue and the ascending aorta (blood activity) within a single field of view. Patients with multiple malignancies or claustrophobia were excluded.
The study was approved by the ethical review board of the Amsterdam University Medical Center, and all subjects signed an informed consent form. This trial was registered under EudraCT number 2017-000344-18 and NTR 6477.
Synthesis of 18F-DCFPyL
18F-DCFPyL was synthesized under good-manufacturing-practice conditions at the Radionuclide Center of Amsterdam University Medical Center, using the precursor of ABX GmbH (11,12). Cyclotron-produced 18F-fluoride was extracted from the enriched water on a 3-PS-HCO3 cartridge (ABX), which was prewashed with 1 mL of ethanol (96%) and 2 mL of water. The 18F-fluoride was eluted from this cartridge into the synthesis unit with 0.6 mL of a 7.5 mM tetrabutylammonium hydrogen carbonate solution (ABX). After evaporation of the solvent, 500 μL of acetonitrile were added and the solvent was evaporated again. This procedure was repeated once. After completion of the evaporation, 3.0 mg (6.8 µmol) of 5-((S)-6-(tert-butoxy-5-(3-((S)-1,5-di-tert-utoxy-1,5-dioxopentan-2-yl)ureido)-6-oxohexyl)carbamoyl)-N,N,N-trimethylpyridin-2-aminium trifluoromethanesulfonate (custom-synthesized) in 250 μL of acetonitrile were added, and this mixture was heated at 55°C for 5 min. The reaction mixture was cooled to 50°C, and 250 μL of 85% H3PO4 (Merck) were added and allowed to react for 3 min at 50°C. After dilution of the reaction mixture with 2 mL of water solution, the 18F-DCFPyL was purified by high-performance liquid chromatography using an Atlantis T3 OBD 5-μm 100-Å, 250 × 10 mm column (Waters) using 90/10/0.1 v/v acetonitrile/water/trifluoroacetic acid as eluent at 4 mL/min, with on-line radioactivity detection and ultraviolet monitoring at 254 nm. The fraction containing the product (retention time, 39 min) was isolated and mixed with 40 mL of water for injection. The product was trapped by passing this mixture over an Oasis HLB Plus cartridge (Waters), which was pretreated with 5 mL of ethanol and 10 mL of water for injection. After the cartridge had been washed with 10 mL of water for injection, the product was eluted with 1.5 mL of sterile ethanol followed by 15 mL of a sterile 0.9% NaCl (aqueous) solution. The resulting clear, colorless solution was filtrated over a sterile 0.22-μm Millex-GV filter into a 20-mL sterilized vial, yielding a ready-for-injection solution of 2,000–7,000 MBq of 18F-DCFPyL at the end of synthesis, with a radiochemical purity of at least 95%, molar activity of 29–101 GBq/μmol at the end of synthesis, and a decay-corrected radiochemical yield of 10%–15%. Analytic high-performance liquid chromatography: Acquity UPLC (Waters) high-strength silica T3 1.8 μm; 2.1 × 75 mm with 0.1% trifluoroacetic acid in water/0.1% trifluoroacetic acid in acetonitrile 87/13 as eluent on a Dionex LPG-3400RS UPLC (Thermo Fisher).
Imaging Protocol
Patients were not required to fast before the scan. Images were acquired using an EANM Research Ltd.–calibrated Ingenuity TF PET/CT scanner (Philips Healthcare). The axial field of view was positioned over the thoracic metastases and ascending aorta (to evaluate image-based blood activity concentrations). The protocol started with a low-dose CT scan (50 mAs, 120 kV) followed by a dynamic PET scan from 0 to 60 min after injection of 18F-DCFPyL (median dose, 313 MBq; range, 292–314 MBq). We intended to perform a full pharmacokinetic analysis until 120 min after injection, since previous studies demonstrated improved visual interpretation and higher tumor SUVs at later time points (13,14). Performing dynamic acquisitions continuously for 120 min did not seem feasible because of patient discomfort, however. Hence, a 30-min break was implemented after the first 60-min dynamic scan. The protocol continued with another low-dose CT scan and 30-min dynamic scan at 90–120 min after injection.
Dynamic PET data were binned into 19 frames for the first dynamic 18F-DCFPyL scan (6 × 5, 3 × 10, 4 × 60, 2 × 150, and 4 × 300 s) and 6 frames for the second dynamic scan (6 × 300 s). Data were corrected for decay, dead time, scatter, and random coincidences; photon-attenuation correction was performed using the low-dose CT scans. PET data were reconstructed using the default blob ordered-subsets time-of-flight reconstruction algorithm, providing images with a matrix of 144 by 144 by 45 voxels and with an isotropic voxel size of 4 mm.
Continuous arterial blood sampling was performed during the first 18F-DCFPyL PET scan (0–60 min after injection) using an automated blood sampler (Veenstra Instruments) (15). Manual arterial blood samples were taken at 5, 10, 20, 30, 40, 60, 100, 110, and 120 min; manual venous samples were taken at 10, 30, and 60 min. Whole-blood and plasma activity concentrations were measured, as well as parent and metabolite fractions of 18F-DCFPyL. Metabolites were analyzed using high-performance liquid chromatography.
Data Analysis
The PCa metastases were delineated on the summed image frames from the last 15 min of the first 18F-DCFPyL scan (45–60 min after injection). A 50% isocontour of SUVpeak (sphere of 1.2-cm diameter, positioned to maximize its mean value) with correction for local background uptake was used to obtain volumes of interest (16). The obtained volumes of interest were imported to the second 18F-DCFPyL scan and manually repositioned over the metastases. Time courses of radioactivity concentrations (time–activity curves) were produced for each volume of interest for the entire length of the dynamic 18F-DCFPyL scan. In addition, image-based blood activity concentrations (blood pool time–activity curve) were assessed using a 3 by 3 voxel volume of interest placed in the ascending aorta in 5 consecutive slides (17).
Pharmacokinetic Modeling
Pharmacokinetic properties of radiotracers are explained using kinetic models, typically including 1 or 2 tissue compartments that are linked to the arterial blood compartment (tracer input) by kinetic rate constants (k). Examples include the irreversible 2-tissue-compartment model, which is applicable to tracers being trapped in the target tissues (e.g., 18F-FDG), and the reversible 2-tissue-compartment model, often applicable to receptor-binding radiotracers (18,19).
Continuous arterial sampling data were used to provide tracer input functions. The continuous sampling curves were both calibrated (2.5–60 min) and extrapolated using a multiexponential fit (60–120 min) based on whole-blood activity concentrations from the manual arterial samples. The curves were corrected for plasma–to–whole-blood ratios. The final blood input functions were corrected for delay to compensate for differences in tracer arrival time in the tumor and at the online detector.
Pharmacokinetic modeling was performed with in-house–developed software in MATLAB (The MathWorks Inc.), using nonlinear regression analysis (19). 18F-DCFPyL data were described using several standard pharmacokinetic models (reversible single-tissue-compartment model; reversible and irreversible 2-tissue-compartment models), all with a blood volume fraction parameter (Vb, consisting of whole-blood activity) (10). Net influx rate (Ki) and volume of distribution (VT) were calculated from the derived kinetic rate constants, as follows:

Lastly, several simplified uptake measures were produced: Patlak Ki (t* = 30 min after injection), Logan VT (t* = 30 min after injection), SUV normalized to both body weight (SUVBW) and lean body mass (SUVLBM), SUV normalized to the area under the whole-blood input curve (SUVAUC), and tumor-to-blood ratio (TBR). Several SUV intervals were analyzed (30–60 min, 100–120 min, and 110–120 min). TBR was derived by normalizing the mean tumor uptake (Bq/cm3) by the time-matched arterial blood activity concentration (Bq/mL). To further simply the TBR, we assessed whether the blood samples could be replaced by an image-based, whole-blood activity measurement from the ascending aorta (i.e., an image-based TBR). Image-based TBRs were derived by normalizing mean tumor uptake (either Bq/cm3 or SUV) by the mean activity in the arterial blood pool (Bq/mL or SUV) (Fig. 1). In clinical whole-body PET acquisitions, the ascending aorta is within the field of view around half-way during the scan. To reflect this scenario, we used the uptake in the aorta as measured during the middle frame of the last dynamic scan (105–110 min after injection) for our analysis of an image-based TBR.

Fused images of PET and CT (radiotracer uptake in Bq/cc or SUV). Image-based TBR are derived by normalizing tumor uptake (green volume of interest) by activity in ascending aorta (red volume of interest).
Statistical Analysis
Normality of the data was assessed visually using histograms. The Akaike criterion was applied to select the preferred pharmacokinetic model for 18F-DCFPyL (20). Each simplified measure was compared with the parameters derived from full kinetic modeling by linear regression analysis (R2). The significance level was set a P value of less than 0.05. Statistical analyses were performed with SPSS, version 22.0 (IBM).
RESULTS
Eight patients were enrolled, with a median PSA of 473 ng/mL (range, 1.7–2,792 ng/mL) at the time of the scan (Table 1). Seven patients had metastatic castration-resistant PCa and received androgen deprivation therapy at the time of the scan. All these patients had received prior treatment with docetaxel, and 5 patients had also received enzalutamide or abiraterone. One patient was recently diagnosed with metastatic recurrent PCa after radical prostatectomy and had not received any systemic treatment yet.
Patient Characteristics
Pharmacokinetic Analysis
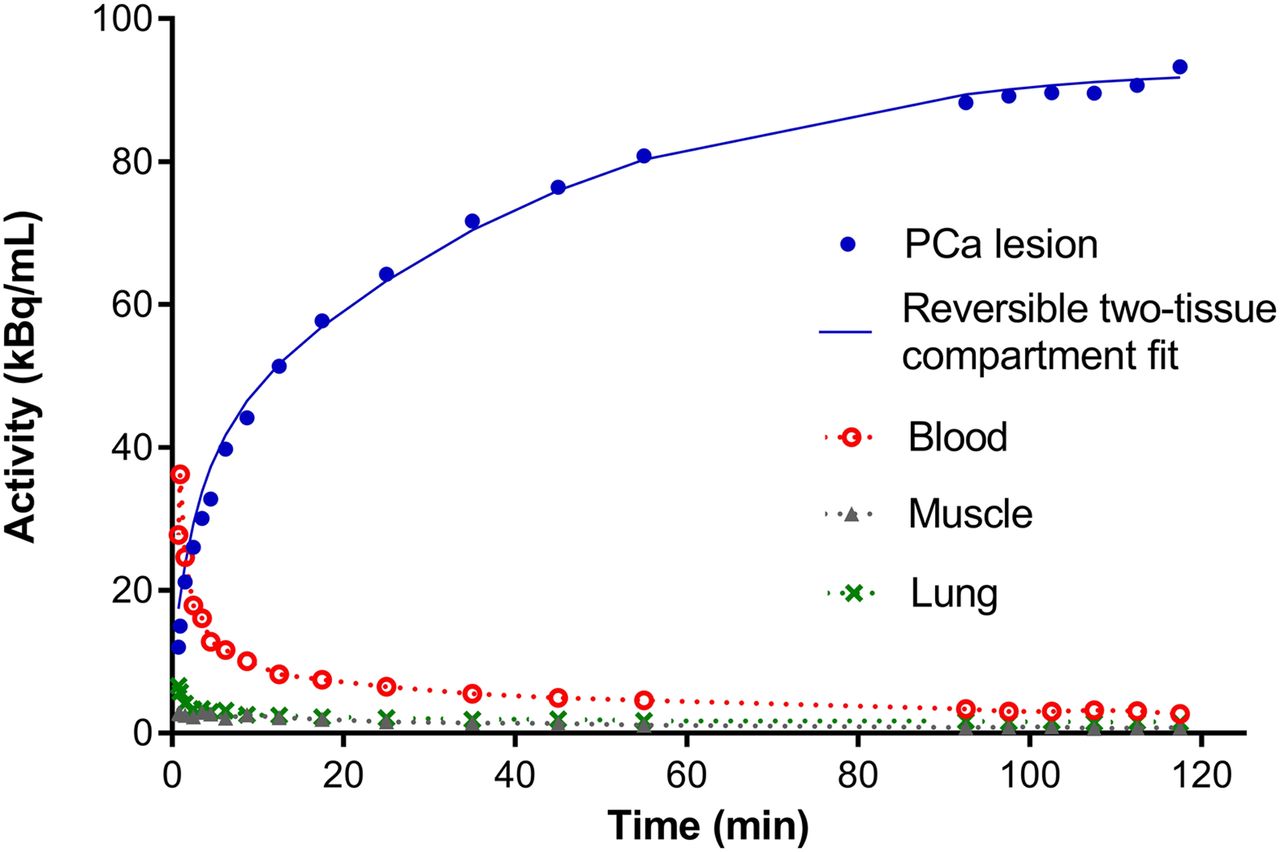
Plasma–to–whole-blood activity ratios were stable over time in all patients, and no metabolites of 18F-DCFPyL were detected in the blood samples (Supplemental Figs. 1–3; supplemental materials are available at http://jnm.snmjournals.org); hence, no metabolite correction of the tracer input functions was needed. In total, 46 metastases were evaluated (41 bone metastasis and 5 lymph node metastases). On the basis of the Akaike criterion, the reversible 2-tissue-compartment model was preferred to describe tracer kinetics in 27 metastases (59% of total), followed by the reversible single-tissue model in 16 metastases (35%) and the irreversible 2-tissue model in 3 metastases (7%). A typical example of 18F-DCFPyL uptake in a PCa metastasis and normal tissues is given in Figure 2. Although the reversible 2-tissue-compartment model best described the tracer’s kinetics, the detected k4 values were small (<0.05), resulting in unstable fits (i.e., relative SD of VT > 100%). Multiple rounds of kinetic modeling were performed with increasingly stringent kinetic boundaries. Ultimately, k4 was fixed at 0.015, which led to stable kinetic parameters in all but 1 metastasis (which was censored). Given the small and fixed k4 value, Ki derived from the reversible 2-tissue-compartment model was preferred as the macrokinetic parameter for further evaluation of 18F-DCFPyL uptake quantification (instead of VT). The derived kinetic parameter estimates and simplified methods are shown in Table 2.

Typical example of 18F-DCFPyL uptake in a PCa metastasis (including fit from reversible 2-tissue-compartment model with fixed k4), blood, muscle, and lung.
Quantitative Uptake Metrics of 18F-DCFPyL from Full Kinetic Modeling and Simplified Methods
Validation of Simplified Methods
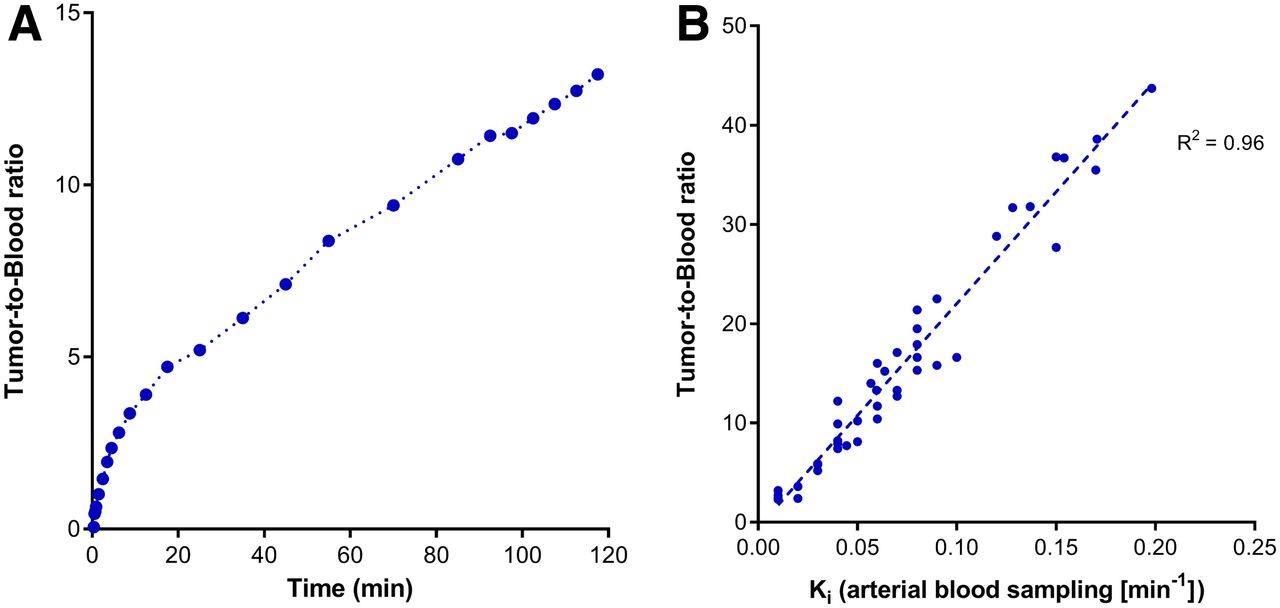
TBR based on arterial whole-blood sampling provided the best correlation of the simplified methods with Ki from the reversible 2-tissue-compartment model (Table 3). The correlation between the even more simplified image-based TBR and Ki was high and similar to that between the TBR based on arterial blood samples and Ki (R2 = 0.96 vs. R2 = 0.97, respectively) (Table 3; Fig. 3).
Correlation of Ki Derived from Pharmacokinetic Modeling (2-Tissue-Compartment Reversible Model) with VT and Simplified Methods

(A) Example of typical TBR over time. (B) Correlation of image-based TBRs and Ki derived from pharmacokinetic modeling (reversible 2-tissue-compartment model).
In our cohort, SUV and Ki correlated poorly (both SUVBW and SUVLBM, Table 3). On an individual-patient level, apparent relations between SUV and Ki were observed, yet the slope of these individual relations clearly differed between subjects (resulting in a poor correlation of SUV with Ki overall) (Fig. 4).
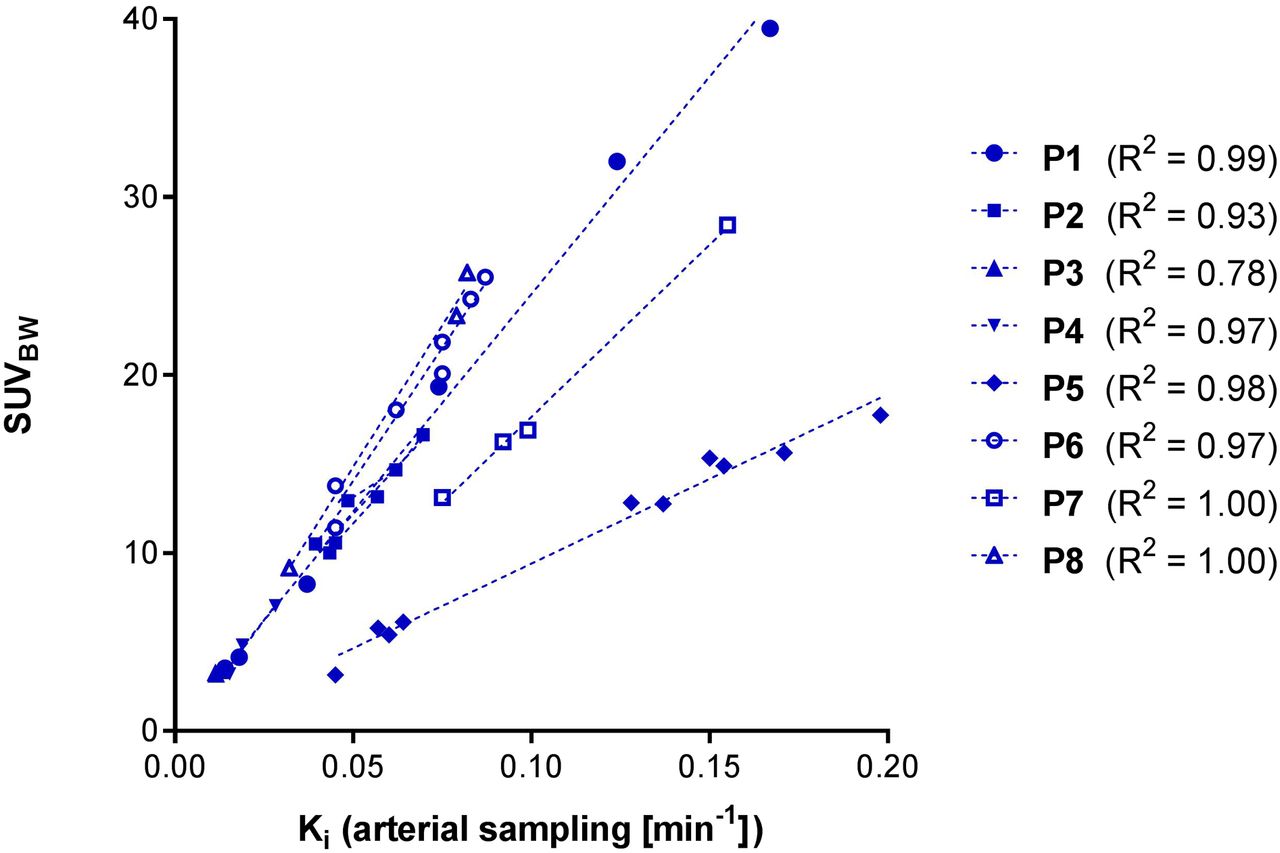
Varying individual relation of SUVs (normalized to body weight) and Ki derived from pharmacokinetic modeling (reversible 2-tissue-compartment model).
DISCUSSION
In this study, we performed a pharmacokinetic analysis of 18F-DCFPyL uptake in PCa metastases, based on dynamic scan acquisitions and arterial blood activity input. A reversible 2-tissue-compartment model (with a fixed, small k4) was found to best describe the kinetic behavior of 18F-DCFPyL. In this model, K1 and k2 may explain the transport and binding/unbinding of 18F-DCFPyL from the bloodstream to the PCa cells. On binding to the extracellular part of the target, PSMA ligands are known to be internalized into the cell (6), a reversible process that may be described by the observed k3 and k4.
Full pharmacokinetic analysis is considered the reference method for tracer uptake quantification, but is not feasible in daily clinical practice. Hence, validation of simplified methods for accurate quantification of 18F-DCFPyL is needed for use in standard whole-body PET acquisitions. Of the simplified metrics, we found the image-based TBR to provide an optimal trade-off between accurate representation of the underlying tracer kinetics and the simplicity of the required scan procedure.
An image-based TBR can easily be obtained from static whole-body acquisitions without the need for additional blood sampling. A single blood activity measurement in the ascending aorta suffices to normalize the uptake of detected PCa metastases (Fig. 1). The image-based TBR provides a practical way to quantify tumor tracer uptake and compare the uptake of metastases in different patients, which may ultimately allow standardization of PET scan interpretation. Moreover, this simplified quantitative analysis may serve as an imaging biomarker, as PSMA expression is found to correlate with histologic grade and disease progression. Lastly, the TBR may provide a means to monitor treatment response, as changes in TBR could imply therapeutic response or failure. Further research is needed to establish the validity of TBRs for these possible applications.
18F-DCFPyL uptake in PCa metastases rises continuously during the first 2 h after injection, whereas background activity decreases (Fig. 2). Hence, the contrast between tumor and background will increase over time, facilitating detection of additional metastases. These findings support the observations by Wondergem et al. (13), who demonstrated that the detectability of metastases was higher at an uptake interval of 120 min after injection than at 60 min after injection. In fact, tumor contrast is likely to rise even after 120 min after injection; the visual benefit of starting PET acquisitions at even later time points might be offset by decreasing image quality due to a loss of radioactivity through decay, however.
Compared with TBR, SUV would provide an even more simplified method for quantification of 18F-DCFPyL uptake, as no assessment of the blood activity is needed. However, our results clearly indicate that no reproducible relation between SUV and Ki exists (Table 3; Fig. 3). The varying relation between SUV and Ki that we observed between patients may be explained by differences in the blood-pool activity concentration (i.e., the tracer input function). Patient 5 demonstrated the most divergent relation between SUV and Ki (Fig. 3.) and this patient’s blood activity concentration was noticeably below average (both from arterial sampling and from image-based measurements; Supplemental Fig. 3). The low blood activity in this patient may in turn be explained by a vast total tumor burden, as metastases were identified in nearly all imaged bone structures. Patient 7 appeared to be a similar case (extensive tumor volume, lower blood activity concentration, and divergent relation between SUV and Ki). Overall, these findings imply that SUV is an inaccurate method of quantifying 18F-DCFPyL uptake and explain why a method that normalizes for blood activity concentration (i.e., TBR) provides the best correlation to full kinetic analysis.
TBRs were found to continuously rise over time (Fig. 1) and thus are affected by differences in the duration of the applied scanning protocol between and within centers. To reliably compare TBRs between institutes and at different time points (e.g., before and after therapy), it is pivotal that the time between tracer injection and image acquisition be strictly standardized. Hence, we strongly recommend harmonization of the uptake interval (e.g., 120 min after injection), direction of scanning (e.g., “feet-first”), and overall whole-body scan duration between centers and strict adherence to the imaging protocol.
Our study has some limitations. First, the complexity of full kinetic analysis and the associated patient discomfort did not allow inclusion of many patients, which precluded subgroup analysis (e.g., primary metastatic patients versus metastatic castration-resistant PCa patients). Second, a heterogeneous population of patients with metastasized PCa was included (e.g., PSA ranged from 1.7 to 2,792 ng/mL), with therefore potentially varying levels of PSMA expression on the examined metastases. Furthermore, almost all patients were treated with androgen deprivation therapy, which is known to influence PSMA expression (21). Although absolute tumor tracer uptake may be subject to differences in PSMA expression, it is unclear if this has a strong effect on the kinetic behavior of 18F-DCFPyL. In our study, tumor time–activity curves and kinetic outcomes showed a fairly consistent pattern across all subjects, despite their heterogeneous disease. Lastly, TBR is the preferred simplified method, yet its daily variation within patients remains unknown. Further research is desired to establish the repeatability of TBR and allow reliable assessment of treatment response.
CONCLUSION
The pharmacokinetics of 18F-DCFPyL in patients with metastasized PCa are best described with an irreversible 2-tissue-compartment model with a fixed k4. TBRs based on a single blood activity measurement in the ascending aorta (image-based TBR) provide an accurate, simplified method to assess 18F-DCFPyL uptake in PCa metastases. Image-based TBRs can quantify 18F-DCFPyL uptake in clinical, whole-body PET/CT scans and be used as an imaging biomarker for tumor characterization or to evaluate treatment response. SUV should not be used to quantify 18F-DCFPyL uptake because this metric cannot account for variations in the blood input function across patients. Tumor tracer activity concentration increased over time, whereas background activity decreased. Although these findings are based on only 8 patients, they are consistent with previous research suggesting diagnostic benefit from performing 18F-DCFPyL PET at later time points after tracer administration (e.g., 120 min).
DISCLOSURE
The Cancer Center Amsterdam provided a research grant that funded this study (CCA2016-5-30). Ronald Boellaard reports having a scientific collaboration with Philips Healthcare. No other potential conflict of interest relevant to this article was reported.
KEY POINTS
QUESTION: What are accurate simplified methods to perform quantitative evaluation of 18F-DCFPyL PET/CT in clinical practice?
PERTINENT FINDINGS: Full pharmacokinetic analysis of 18F-DCFPyL (reference method) was performed on 8 patients with metastatic PCa, revealing a reversible 2-tissue-compartment model to be the preferred kinetic model. This full quantitative analysis could be simplified using image-based TBRs, but not SUVs.
IMPLICATIONS FOR PATIENT CARE: TBR (and not SUV) can be used as a simplified method to perform quantitative evaluation of 18F-DCFPyL PET/CT, enabling reliable interpretation of PET images and the use of tracer uptake as an imaging biomarker.
Footnotes
Published online Apr. 18, 2019.
- © 2019 by the Society of Nuclear Medicine and Molecular Imaging.
REFERENCES
- Received for publication February 20, 2019.
- Accepted for publication April 8, 2019.


Jump to section
Related Articles
Cited By...
- Principles of Tracer Kinetic Analysis in Oncology, Part II: Examples and Future Directions
- SUVs Are Adequate Measures of Lesional 18F-DCFPyL Uptake in Patients with Low Prostate Cancer Disease Burden
- Measurement of PET Quantitative Bias In Vivo
- Repeatability of Quantitative 18F-DCFPyL PET/CT Measurements in Metastatic Prostate Cancer