


Abstract
Assessing therapy response of breast cancer bone metastases is challenging. In retrospective studies, serial 18F-FDG PET was predictive of time to skeletal-related events (tSRE) and time to progression (TTP). 18F-NaF PET improves bone metastasis detection compared with bone scanning. We prospectively tested 18F-FDG PET and 18F-NaF PET to predict tSRE, TTP, and overall survival (OS) in patients with bone-dominant metastatic breast cancer (MBC). Methods: Patients with bone-dominant MBC were imaged with 18F-FDG PET and 18F-NaF PET before starting new therapy (scan1) and again at a range of times centered around approximately 4 mo later (scan2). Maximum standardized uptake value (SUVmax) and lean body mass adjusted standardized uptake (SULpeak) were recorded for a single index lesion and up to 5 most dominant lesions for each scan. tSRE, TTP, and OS were assessed exclusive of the PET images. Univariate Cox regression was performed to test the association between clinical endpoints and 18F-FDG PET and 18F-NaF PET measures. mPERCIST (Modified PET Response Criteria in Solid Tumors) were also applied. Survival curves for mPERCIST compared response categories of complete response+partial response+stable disease versus progressive disease for tSRE, TTP, and OS. Results: Twenty-eight patients were evaluated. Higher 18F-FDG SULpeak at scan2 predicted shorter time to tSRE (P = <0.001) and TTP (P = 0.044). Higher 18F-FDG SUVmax at scan2 predicted a shorter time to tSRE (P = <0.001). A multivariable model using 18F-FDG SUVmax of the index lesion at scan1 plus the difference in SUVmax of up to 5 lesions between scans was predictive for tSRE and TTP. Among 24 patients evaluable by 18F-FDG PET mPERCIST, tSRE and TTP were longer in responders (complete response, partial response, or stable disease) than in nonresponders (progressive disease) (P = 0.007, 0.028, respectively), with a trend toward improved survival (P = 0.1). An increase in the uptake between scans of up to 5 lesions by 18F-NaF PET was associated with longer OS (P = 0.027). Conclusion: Changes in 18F-FDG PET parameters during therapy are predictive of tSRE and TTP, but not OS. mPERCIST evaluation in bone lesions may be useful in assessing response to therapy and is worthy of evaluation in multicenter, prospective trials. Serial 18F-NaF PET was associated with OS but was not useful for predicting TTP or tSRE in bone-dominant MBC.
Bone is the most common site of breast cancer metastases (1–3) and is associated with significant morbidity (4). Patients with bone-dominant (BD) disease (involving exclusively bone or bone and soft tissue without visceral organ involvement) experience longer survival than those patients with predominantly visceral metastases (5–10). Bone metastases are detected using a variety of imaging modalities (11). However, assessing response to therapy in patients with BD metastatic breast cancer (MBC) remains challenging. Bone scans visualize the response of surrounding bone to cancer and may be slow to show response, and may even show a “flare” related to bone healing with effective therapy. Similar findings may occur with other modalities including CT (12–15). RECIST 1.1 specifically excludes bone metastasis as a measurable site for response, and BD MBC patients are often excluded from clinical trials that measure response (4,16–19). This represents a large patient population that could benefit from improved use of systemic therapy, making accurate assessment of BD MBC response an imperative need.
18F-FDG PET depicts aspects of breast cancer bone metastases distinct from bone scans, 18F-NaF PET, and other modalities and may therefore offer a superior approach for assessing response for BD MBC patients (11). 18F-FDG PET is hypothesized to visualize tumor metabolism (11). Compared with bone scans and 18F-NaF PET, 18F-FDG has higher uptake in more lytic bone metastases, making 18F-FDG PET more sensitive for these lesions, whereas bone scanning and 18F-NaF PET perform better in identifying more blastic metastases (20–22). Although cases of flare in response to therapy have been reported on 18F-FDG PET (23), this appears to be a rare event (24), and largely related to the known impact of agonist endocrine agents (25). Previously reported retrospective data show that serial 18F-FDG PET can be used to measure bone metastasis response to therapy and to predict outcome (26–29). Higher 18F-FDG uptake predicted the time to skeletal-related event (tSRE) and changes in 18F-FDG uptake with treatment predicted time-to-progression (TTP). Alternatively, 18F-NaF PET offers improved resolution and quantitative capability compared with bone scanning and bone SPECT (22,30–33) and might therefore offer benefit for assessing response and progression, as reported for prostate cancer (34). We therefore evaluated both serial 18F-NaF PET and 18F-FDG PET to predict tSRE, TTP, and overall survival (OS) in a prospective study of patients with BD MBC starting new systemic therapy.
MATERIALS AND METHODS
Patient Eligibility
Eligible patients had histologically confirmed breast cancer, imaging findings of bone metastases, and no contraindications to PET imaging. The institutional review board approved this study, and all patients signed a written informed consent form and agreed to undergo 4 PET scans (2 18F-FDG PET and 2 18F-NaF PET), as well as standard pretherapy and clinical follow-up to determine response to therapy. Baseline 18F-FDG PET and 18F-NaF PET scans (scan1) were completed before initiation of new systemic therapy. Follow-up 18F-FDG PET and 18F-NaF PET scans (scan2) were completed at the discretion of the treating physician. The date of the 18F-NaF PET scan1 was used to indicate the date of study entry. Full selection criteria are provided in Supplemental Table 1 (supplemental materials are available at http://jnm.snmjournals.org).
PET Imaging
18F-FDG and 18F-NaF were produced at the University of Washington Cyclotron facility or purchased from commercial suppliers (Cardinal Health) in accord with manufacturing requirements for both tracer (35,36). 18F-FDG imaging was performed according to routine clinical protocol (37) on 1 of 3 institutional tomographs (Advance PET and 2 DSTE PET/CT scanners; GE Healthcare). Fasting was not required for 18F-NaF PET studies, and patients underwent a 60-min dynamic scan before the torso survey. Scanners were calibrated using the manufacturer’s recommended procedures and cross-calibrated regularly for quantitative comparisons (38,39). Most patients were imaged on the same scanner in serial studies for each tracer; however, because of the addition of a second GE Discovery STE PET/CT at our center, some patients underwent scan2 on the alternate scanner. We have shown that our calibration and cross-calibration procedures and identical acquisition and reconstruction protocols provide test–retest accuracy comparable to a well-calibrated single scanner (40).
Image Analysis
Experienced nuclear medicine physicians reviewed the 18F-FDG PET and 18F-NaF PET scans (as well as corresponding CTs) to identify the same bone lesions on both scans (up to 10 lesions), including the 5 most dominant, not previously irradiated, for each scan. Dominant lesions were selected on the basis of tracer uptake, not lesion size. The index lesion was defined as the lesion with the largest amount of tracer uptake in each scan, and was not necessarily the same lesion in both scans. In the 18F-NaF PET scan, for each identified lesion and corresponding normal bone, square (3 × 3 pixel, ∼1 cm) regions-of-interest (ROIs) were drawn on 3 adjacent planes where the pixel of maximum value was included in each lesion ROI. For the 18F-FDG PET scans, ROIs for tumor and liver were drawn according to PERCIST (41,42).
Cancer Therapy and Determination of Response Endpoints
Systemic therapy for MBC was selected by the treating physician before baseline scans. Outcome data were ascertained from prospectively collected clinical data. tSRE was defined as time from study entry to pathologic fracture, need for radiation to stabilize bone lesion, or hypercalcemia of malignancy. TTP and OS were defined as time from study entry to disease progression or death. tSRE and TTP were adjudicated by medical oncology review of clinical data independent of PET scan results obtained during trial participation. Supplemental Table 2 details the PET imaging metrics, including standardized uptake value (SUV) and lean body mass adjusted standardized uptake (SUL), and their formulation.
mPERCIST Evaluation
On the basis of our preliminary analysis, bone lesions have lower average SULpeak values than soft-tissue lesions previously studied using PERCIST (41,42). Thus, our mPERCIST (Modified PET Response Criteria in Solid Tumors) lesion inclusion criteria included bone lesions with an SULpeak greater than 1.5× mean liver SUL, instead of 1.5× mean liver SUL + 2 SDs of the mean liver SUL. For the patients meeting this requirement, we followed the published PERCIST metabolic response criteria and classified patients as mPERCIST responders (complete response [CR], partial response [PR], or stable disease) or nonresponders (progressive disease [PD]).
Statistical Analysis
Univariate Cox proportional hazards regression models for each of the clinical endpoints (tSRE, TTP, OS) were performed for each of the SUV measures of interest. 18F-FDG PET variables showing promise in the univariate analysis were included in a multivariable Cox model (43). Hazard ratios, P values for the regression coefficients, R2, and index of concordance are reported. The primary objective (and preplanned analysis) was to determine whether SUVmax from bone metastases were useful prognostic indicators for progression and SREs. We considered multiple tests that included SUVmax at both scan1 and scan2, along with a mean of all available sites at scan1 and scan2. Other tests were considered for several other prognostic factors and secondary endpoints, as well as for other definitions of SUV. If this were a definitive clinical trial, the Bonferroni procedure (or other multiple testing procedure) should be applied in all instances in which multiple testing occurs. However, the scope of this study is more limited. The results presented provide an indication of directions for future validation in a rigorously conducted prospective clinical trial. We report standard P values but include a clear caveat detailing limitations of the study and its exploratory nature.
To test the association between mPERCIST response criteria (discrete variables) and clinical endpoints, Kaplan–Meier curves for patients in mPERCIST response profiles (CR+PR+stable disease vs. PD) were evaluated for each endpoint and quantitatively assessed using the log-rank test.
RESULTS
Twenty-eight patients are included in this study. Twenty-four patients completed all scans (2 18F-NaF PET and 2 18F-FDG PET) and an additional 4 patients completed paired 18F-FDG PET, but not paired 18F-NaF PET scans. Trial accrual fell short of goal, but was stopped due to financial and logistical challenges, and not based on interim data analysis. Ten patients had their second scan obtained on a different scanner within the same institution (6 on the same model DSTE). Table 1 summarizes the patient and tumor characteristics, which were taken from metastatic biopsy (if available) or from breast primary. Most had hormone receptor–positive, human epidermal growth factor receptor 2–negative disease. The average number of prior therapies for MBC was 2.7 (range, 0–8). Most patients (61%) started a new endocrine therapy after scan1. Twenty patients received bisphosphonates, and 2 patients received an anti-RANK ligand agent. No patient changed bone-stabilizing agents while on the study. Although more than 100 lesions were identified among the patients, the focus of this analysis was on the index lesion and 5 most dominant lesions in each scan. Disease burden assessed by number of lesions per patient is shown in Table 1.
Selected Patient and Tumor Characteristics
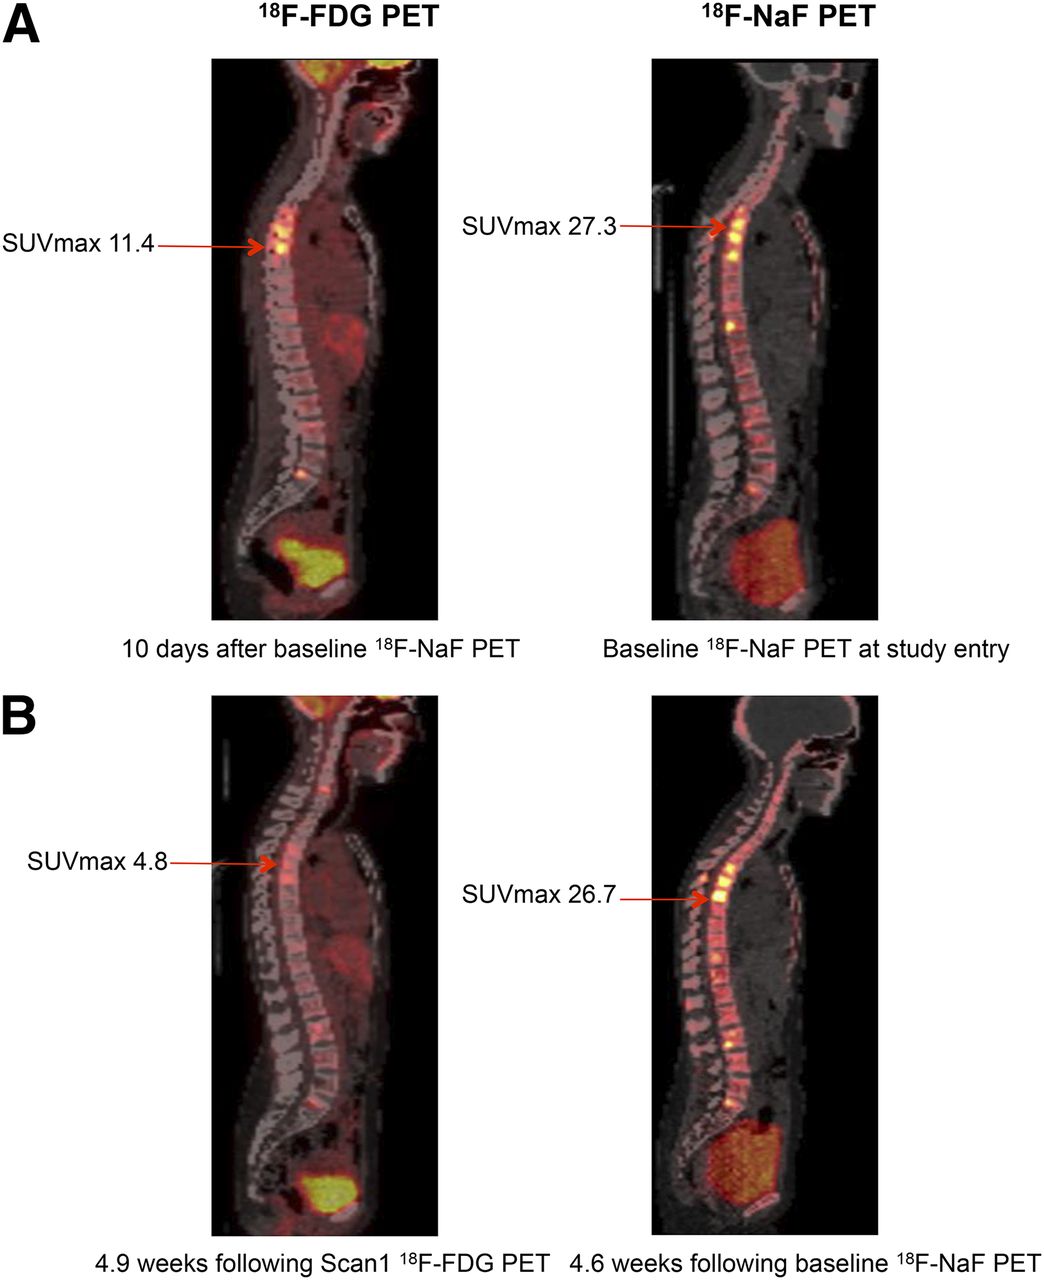
Response measures for all patients are included in Supplemental Table 3. Figure 1 illustrates an example of PR by 18F-FDG PET with stable NaF uptake in bone metastases. Over half of the patients had an SRE, with the median time of 8.3 mo (0.0–86.5 mo). Median TTP was 5.8 mo (2.2–29.5 mo). All but 3 patients died, with a median survival of 35.0 mo by Kaplan–Meier estimate, (6.06–87.29 mo).

Sagittal images of a 43-y-old woman: scan1 (A) and scan2 (B). Index lesions (not same lesions) decreased 58% by 18F-FDG PET and 2% by 18F-NaF PET. Response was considered partial by mPERCIST. Bone metastases were considered stable by 18F-NaF PET.
Supplemental Table 4 summarizes the interval between initial (scan1) and follow-up (scan2), which was determined by the treating physician and therefore varied (mean, 4.3 mo). Descriptive statistics for the index lesion and multiple lesion uptake measures are shown in Table 2, and univariate analysis of 18F-FDG PET and 18F-NaF PET measures to clinical endpoints (tSRE, TTP, and OS) are shown in Table 3. Persistence of 18F-FDG uptake (SUVmax) in the index lesion at scan2 was associated with shorter tSRE (hazard ratio [HR], 2.27; P < 0.001). Persistence of 18F-FDG–avid disease at scan2 by SULpeak was associated with shorter time to SRE (HR, 2.41; P < 0.001) and shorter TTP (HR, 1.58; P = 0.044). SULpeak unit difference for up to 5 lesions between scan1 and 2 was also associated with shorter time to SRE (HR, 2.21; P = 0.038). 18F-FDG SUVmax at scan1 was not predictive of tSRE, TTP, or OS. Persistence of 18F-FDG at scan2 by SUVmax or SULpeak of index lesion or lesser change in mean SULpeak of up to 5 lesions were predictive of shorter time to SRE or TTP, but none was associated with OS.
Uptake Characteristics
Univariate Analysis of 18F-FDG PET and 18F-NaF PET Parameters and Clinical Endpoints
For 18F-NaF PET, an increase in the percentage change of the mean SUVmax of up to 5 lesions was associated with longer OS (P = 0.027). This association did not persist when SUV uptake was corrected for normal bone uptake (P = 0.237) (Supplemental Table 5). No other associations between NaF PET parameters at scan1 or scan2 or change between scans and clinical outcomes were observed. Analyses of 18F-FDG PET and 18F-NaF PET measures by type of therapy (endocrine or chemotherapy), time between scans, and primary lesion type (lytic or sclerotic) are shown in Supplemental Table 6. We found no significant difference in performance of 18F-FDG PET or 18F-NaF PET in these subgroups.
Univariate analysis failed to support 18F-NaF PET imaging as a useful predictor of tSRE and TTP; therefore, subsequent multivariable analysis included 18F-FDG PET parameters (Table 4). A model incorporating SUVmax of the index lesion at scan1 and unit difference in SUVmax in up to 5 lesions led to stronger predictive capability for tSRE and TTP than single parameters or other multivariable models. Patients with greater reductions in uptake on scan2 versus scan1 were found to have improved prognosis. Specifically, patients in whom the difference between scan2 and scan1 was 1 SD lower (greater decline with therapy) saw a 75% decrease (HR, 4.14) in risk of tSRE (P < 0.01) and a decrease of 50% (HR, 1.98) in risk of progression (P = 0.02), suggesting that the combination of 18F-FDG uptake measures from both scans identifies patients at risk for skeletal-related events or disease progression. Results were similar using SULpeak in this model. Kaplan–Meier curves for the multivariable analysis are shown in Supplemental Figure 1.
Multivariable Analysis (18F-FDG Only)
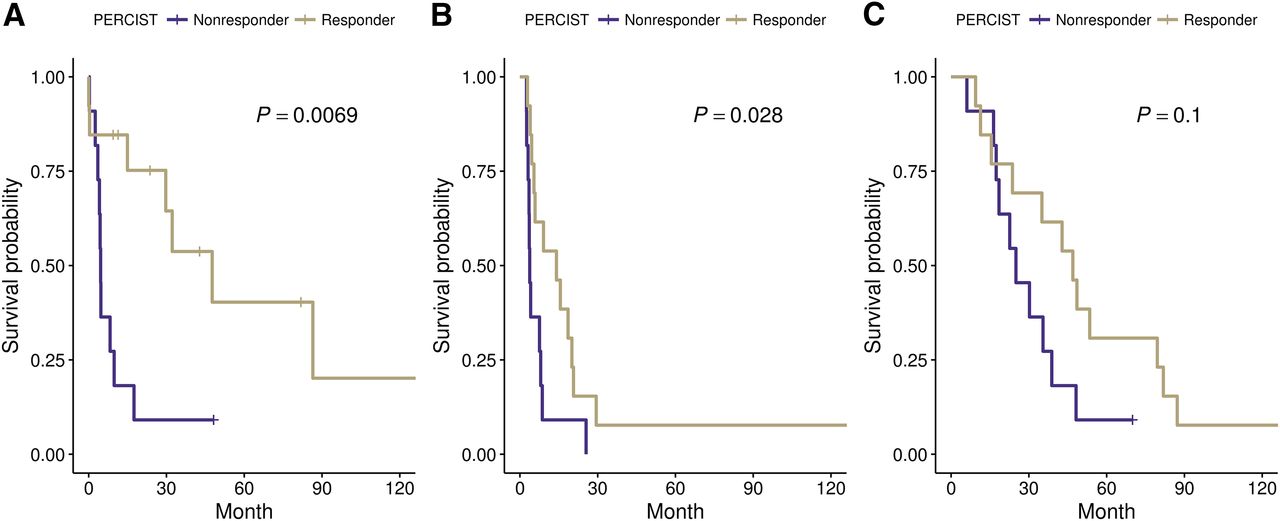
Table 5 and Figure 2 show response by mPERCIST. Eleven patients had PD by mPERCIST, whereas 1 patient had CR, 6 patients had PR, and 6 had stable disease. Four patients were unevaluable, either because none of the lesions was above the liver SULpeak threshold (n = 3) or there was liver disease present and an alternative aorta ROI was not available. Supplemental Table 7 details the tumor response parameters. Responding patients (mPERCIST CR+PR+ stable disease) (n = 13) had significant prolongation of tSRE, TTP, and a trend toward improved OS (not statistically significant) compared with nonresponders (PD). The median tSRE of patients in the response group was 47.6 mo (95% confidence interval [CI]: 29.7 to NA mo) compared with 4.6 mo (95% CI: 4.1 to NA mo) in patients with PD (P = 0.007). The median TTP of patients in response group was 14.1 mo (95% CI: 5.4 to NA mo) compared with 3.8 mo (95% CI: 3.5 to NA mo) in patients with PD (P = 0.028). Similarly, the median OS of patients in response group was 47.0 mo (95% CI: 23.7 to NA mo) compared with 25 mo (95% CI: 18.5 to NA mo) in patients with PD, but was not statistically significant (P = 0.10).
Response by mPERCIST

Kaplan–Meier plots for 18F-FDG mPERCIST response criteria. Responders by mPERCIST (CR, PR, or stable disease) (n = 13) and nonresponders (n = 11). (A) tSRE. (B) TTP. (C) OS.
PERCIST have not been evaluated for 18F-NaF PET, however, we note that in 8 patients who underwent both 18F-FDG PET and 18F-NaF PET scans with PD by 18F-FDG PET mPERCIST, 5 of 8 (63%) were considered PD because of new 18F-FDG–avid lesions, but only 3 of 8 (38%) had new lesions noted in their 18F-NaF PET scans. No scans that were not considered PD by 18F-FDG PET were considered PD by 18F-NaF PET.
DISCUSSION
The ability to accurately detect metastases in breast and prostate cancers has improved significantly in recent years with hybrid imaging methods. Nevertheless, no consensus has been reached on the best imaging modality for treatment response assessment of breast cancer bone metastases (44). We hypothesized that serial 18F-FDG PET and 18F-NaF PET would provide complementary measures of activity of breast cancer bone metastases and that each might predict response to therapy.
Our 18F-FDG PET results were consistent with previously reported retrospective data for breast cancer (26–29) and similar to studies in castrate-resistant prostate cancer, which tends to have higher 18F-FDG uptake than hormone-sensitive disease (45). Neither 18F-NaF PET measures at scan1 or scan2 nor change in NaF SUV uptake over the course of treatment were predictive of tSRE or TTP. However, the percentage difference (but not the unit difference) of the average SUVmax of up to 5 lesions was associated with OS. The direction of the hazard ratio (HR) suggests that an increase in uptake was predictive, but the association does not persist when SUV uptake is corrected for normal bone uptake. This may be related to the flare effect, artifactual, or related to effects not specific to the metastases, as seen in a similar study in prostate cancer (46). Additional analyses evaluating performance of serial NaF by lesion type (lytic vs. sclerotic vs. mixed) also failed to demonstrate predictive value of NaF (Supplemental Table 6). The difference between our results for 18F-NaF PET and the promising results in prostate cancer (46–49), particularly when quantitative assessment of NaF uptake is incorporated (34), may relate to biologic differences in breast cancer bone metastases. Breast cancer lesions, although phenotypically both blastic and lytic, tend to be more driven by primarily lytic molecular process compared with prostate cancer metastases (50). Our 18F-NaF PET results are consistent with other studies showing confounding responses for breast cancer bone metastases by bone scanning and 18F-NaF PET (14,51). Although useful as a mode of detection of osteoblastic bone lesions, our results do not support use of serial 18F-NaF PET as a response measure or predictor of clinical outcomes in BD MBC.
There are several limitations to this study including small sample size (n = 28). We found a wide range of SUVs in bony lesions by both 18F-FDG PET and 18F-NaF PET, likely due to heterogeneity in lytic versus sclerotic lesions, which may be related to both underlying tumor biologic differences and prior therapy (20,22,52). Treatment while on the study incorporated standard endocrine agents or chemotherapy prescribed at physician discretion and the timing of PET posttherapy scanning was not uniform, influenced by clinical practice. Results of the multivariable analysis should be considered exploratory and parameters from the model validated in larger studies.
Some patients were imaged on different scanners, all in the same institution with similar patient preparation and where machine calibrations were done quarterly using the same calibration procedures and daily quality control to keep them as closely aligned as possible. Recent work demonstrated that 18F-FDG PET scanner qualification and calibration can yield highly reproducible SUV measurements with a percentage test–retest difference in tumor SUVmax for bone of 7% and for soft tissue 10% (data not shown).
We found that mPERCIST criteria may be valuable to assess response to therapy and are associated with differences in clinical endpoints (41,53). Lower average 18F-FDG uptake in bone versus soft-tissue metastases prompted our modification to include bone lesions with an SULpeak greater than 1.5× the value of normal liver. We found that patients with metabolic response (CR, PR, and stable disease) experienced significant prolongation in tSRE (47.6 vs. 4.6 mo) and TTP (14.1 vs. 3.8 mo). 18F-FDG PET uptake changes assessed by mPERCIST were strongly associated with clinical outcomes of interest. Our results support the use of 18F-FDG PET and a modified PERCIST approach to monitor response to therapy in BD MBC and indicate a need for validation in larger prospective, multicenter trials.
CONCLUSION
This prospective study of serial and 18F-FDG PET and 18F-NaF PET in patients with BD MBC confirmed prior retrospective studies showing that 18F-FDG uptake measures predict key clinical outcomes (tSRE and TTP) and supported the use mPERCIST. Our results do not support a clear role for serial 18F-NaF PET in this patient population. These results endorse a larger prospective trial of 18F-FDG PET/CT as a response endpoint for BD MBC and suggest that 18F-FDG PET/CT could be used as a response endpoint that would increase access of this patient population to clinical trials and promising new therapies.
DISCLOSURE
This study was sponsored by R01CA124573, Komen SAC130060, P30CA015704, and SFI 11/PI/1027. No other potential conflict of interest relevant to this article was reported.
Acknowledgments
We thank the patients who participated in the study. We also thank Finbarr O’Sullivan, Lisa Dunnwald, Erin Schubert, William Barlow, Robert Doot, and Larry MacDonald and all of the radiochemistry staff, technologists, physicists, and physicians who helped with this study.
Footnotes
Published online May 10, 2018.
- © 2018 by the Society of Nuclear Medicine and Molecular Imaging.
References
- Received for publication March 14, 2018.
- Accepted for publication April 30, 2018.


Jump to section
Related Articles
Cited By...
- No citing articles found.