


Abstract
Noninvasive imaging technologies are increasingly used in preclinical drug research for the pharmacokinetic analysis of therapeutic compounds in living animals over time. The different preclinical imaging modalities available differ intrinsically in their detection principle and thus might exhibit limitations for a specific application. Here, we systematically investigated the performance of advanced fluorescence-mediated tomography (FMT)/CT in comparison to PET/MRI for quantitative analysis of the biodistribution of different antibody formats and dependence on the required imaging label in squamous cell carcinoma xenografts. Methods: Different formats of an antibody (monoclonal antibody and the antigen binding fragments F(ab′)2 and Fab) targeting epidermal growth factor receptor were labeled with Alexa750 or 64Cu-NODAGA and injected intravenously into separate cohorts of nude mice bearing subcutaneous A-431 tumors. Two and 24 h after injection, the mice were measured by FMT/CT and PET/MRI. Probe accumulation was quantitatively assessed in organs and tumors. In vivo data were compared between modalities and correlated with ex vivo fluorescence, γ-counting, and electrochemiluminescence immunoassay. Results: Both imaging methods faithfully monitored the biodistribution and elimination routes of the compounds, and organ accumulation measured by FMT/CT and PET/MRI correlated significantly with ex vivo measurements. In addition, the accumulation in kidney, muscle, and tumor tissue correlated between FMT/CT and PET/MRI. However, the pharmacokinetics of the Alexa750-labeled antibody formats showed shorter blood half-times and higher liver uptake than the radiolabeled counterparts. Conclusion: FMT/CT imaging allows quantifying the biodistribution of antibodies in nude mice and provides an alternative to PET analysis in preclinical drug research. However, even for large molecules, such as monoclonal antibodies, Alexa750 labeling can change pharmacokinetics and trigger liver uptake.
The investigation of the biodistribution of therapeutic compounds is an integral part of preclinical drug research. The in vivo behavior of a biotherapeutic is dependent on many factors, such as size and charge of the molecules (1). To investigate the biodistribution over time, animals typically must be humanely killed for organ explantation at different time points, which requires many animals. The clearance rate of a therapeutic compound is usually assessed by blood analysis.
With the advent of in vivo imaging technologies, noninvasive tracking of therapeutic compounds throughout the body became feasible (2). Among such, PET and SPECT have become established as tools of choice for monitoring biodistribution. These technologies are based on detection of γ-radiation, and they yield high sensitivity and allow longitudinal measurements with absolute quantification (3). The combination of PET with CT or MRI allows whole-body biodistribution imaging with anatomic information (4,5). However, PET imaging has the disadvantage of requiring the use of radioisotopes, which requires high technical skills and appropriate safety measures.
In contrast, optical imaging is based on light in the visible or near-infrared range and frequently uses fluorescent dyes to obtain tissue-specific information (6). Fluorescence-mediated tomography (FMT) is a laser-based 3-dimensional (3D) optical imaging technique using multiple diffuse transilluminations to determine the fluorescence signals noninvasively in small animals. This technique requires fluorescence labeling, which needs to be considered during pharmacokinetic analyses. Fluorescence measurements for multiple laser injection points are used to reconstruct the 3D biodistribution in the living animal by using complex numeric algorithms (7). In this context, absorption and scattering parameters must be considered for a correct reconstruction.
Since its introduction in 2002, FMT has been characterized by an extensive application in drug development (8,9). However, unlike PET measurements, optical imaging is strongly affected by tissue depth and tissue-specific optical properties, such as absorption and scattering. Combination with an anatomic high-resolution imaging modality such as CT enables improved optical modeling (10). A 3D scattering map can be derived from an automated segmentation in combination with tissue-dependent scattering coefficients (11). Like attenuation correction in PET, an optical absorption map, derived from the FMT transillumination data, is used to correct for strongly absorbing organs (11). Fusion with 3D anatomic CT datasets enables accurate positioning of the fluorescence information as described in previous work (12,13).
Despite increasing interest in optical imaging methods for preclinical drug research, there are, to our knowledge, no comprehensive data available that investigate the performance of advanced FMT/CT against PET/MRI for the quantitative assessment of drug biodistribution. Therefore, these modalities were compared using Alexa750 dye as the fluorescent label and 64Cu-NODAGA as the radiolabel. Our goal was to investigate whether FMT/CT is capable of reliably quantifying the spatial and temporal biodistribution of therapeutics and to compare its performance with that of PET/MRI and electrochemiluminescence immunoassay (ECLIA) analyses in distinguishing imaging- and labeling-based effects on the FMT/CT measurements.
MATERIALS AND METHODS
Animal Experiments and Study Design
All animal studies were approved by the local government, and mice were handled according to the guidelines of the Federation for Laboratory Animal Science Associations. Eight-week-old female athymic nude mice (Charles River) with a body weight of 22–25 g were used. Two equally designed studies were performed, one for FMT/CT and the other for PET/MRI. A-431 cells expressing epidermal growth factor receptor (EGFR) (7.5 × 10⁶ cells in 100 μL of phosphate-buffered saline) were injected subcutaneously into the right flank. When the tumors had grown to about 100 mm3, the mice were separated into 2 cohorts, one for FMT/CT and the other for PET/MRI. Both cohorts were randomized into 3 groups (n = 5) for the anti-EGFR formats monoclonal antibody (mAb) and antigen binding fragments F(ab′)2 and Fab. Labeled compounds were administered by tail vein injection in equimolar amounts, that is, a 2 mg/kg dose of anti-EGFR-mAb, 1.33 mg/kg of anti-EGFR-F(ab′)2, and 0.67 mg/kg of anti-EGFR-Fab.
Labeling of Antibody Formats
For FMT/CT, antibody formats were labeled with Alexa750 (SAIVI rapid antibody labeling kit; Invitrogen). For PET/MRI, antibody formats were conjugated with a chelator via N-hydroxysuccinimide ester chemistry and radiolabeled with 64Cu as described previously (14). More information is provided in the supplemental materials (available at http://jnm.snmjournals.org).
FMT/CT Imaging
FMT/CT imaging was performed as described previously (12). Briefly, 2 and 24 h after compound injection, mice were imaged in a small-animal CT scanner (TomoScope Synergy Twin; CT Imaging GmbH) and an FMT scanner (FMT 2500; Perkin Elmer). Before imaging, the animals were anesthetized with 2% isoflurane at a rate of 2 L of oxygen per minute and placed on a multimodal imaging cassette. For CT scans, a high-resolution protocol with 1,440 projections and a scan time of 180 s was used. Both tubes were operated at 50 kV and 0.8 mA. Image reconstruction was performed using a cone-beam Feldkamp algorithm with an isotropic voxel size of 35 μm and a T50 reconstruction kernel. For FMT, around 100 laser injection points were applied with a 3-mm distance using the 745-nm channel. FMT and CT datasets were fused, and fluorescence was reconstructed using heterogeneous absorption and scattering maps (11). On the basis of CT data, various regions (liver, kidneys, leg muscle, and tumor) were interactively segmented using the Imalytics preclinical software, resulting in a binary mask for each region (15). The fluorescence amount of each region was computed by summing the intensities of all segmented voxels. Concentrations were computed by dividing the sum by the volume of the region. The required scale factors were determined using FMT/CT phantom scans with known amounts of probe for mAb, F(ab′)2, and Fab (supplemental materials).
PET/MRI
For PET/MRI, mice were anesthetized (2% isoflurane at a rate of 2 L of oxygen per minute) and scanned for 10 min on a small-animal PET scanner (Inveon; Siemens Preclinical Solutions) at 2 and 24 h. Subsequently, the mice were transferred to a 7-T BioSpec MRI scanner (Bruker BioSpin MRI). MRI was performed using a whole-body coil and a T2-weighted 3D turbo-RARE (rapid imaging with refocused echoes) sequence (repetition time, 1,800 ms; echo time, 66.7 ms; resolution, 0.3 mm; averages, 2). PET data were reconstructed with a 2-dimensional (2D) ordered-subsets expectation maximization algorithm (matrix, 128 × 128; voxel size, 0.79 × 0.79 mm) in an Inveon Acquisition Workplace (version 1.5.0.28; Siemens). PET and MRI scans were coregistered, and all PET scans were normalized according to the residual activity at the beginning of the respective scan. Different regions (tumor, liver, kidney, and leg muscle tissue) were segmented.
Blood Sampling and Necropsy
Blood samples were taken from the retroorbital sinus of the left eye. The mice were humanely killed, and tissues (liver, kidneys, muscle, and tumor) were harvested.
2D Fluorescence Reflectance Imaging
The fluorescence signal of the explanted tissues from the FMT/CT study was measured by a 2D fluorescence reflectance imaging system (Maestro; Perkin Elmer). Whole-organ and tumor samples were measured, and mean fluorescence signals were shown as counts per second.
γ-Counting
Harvested tissues from the PET/MRI study were measured in a γ-counter (Perkin Elmer). The samples were weighed to calculate the percentage injected dose (%ID) per gram of tissue.
ECLIA Analysis
ECLIA was performed to quantify the antibody amounts in tissue homogenates and blood. A chemiluminescent emission signal was induced by a voltage in the measuring cell of the Elecsys (Cobas, E411; Roche), and signal was detected by a photomultiplier at 620 nm. Further information about tissue homogenization and ECLIA is provided in the supplemental materials.
Statistical Analysis
For statistical analysis, GraphPad Prism 6 was used. Results were expressed as mean values ± SD. Differences between groups were tested for significance using the 1-way ANOVA followed by a Tukey multiple-comparison test. A P value of less than 0.05 was assumed to indicate significant differences. For correlation analysis, Pearson correlation analysis was performed. Scatterplots were generated, and the coefficient of correlation, R2, was determined for the mean values of each treatment group.
RESULTS
Evaluation of Pharmacokinetics
For side-by-side comparison of FMT/CT and PET/MRI, 2 equally designed in vivo imaging studies were performed and analyzed, measuring the drug uptake in several organs and the tumor of each mouse. Before the in vivo biodistribution study of anti-EGFR drug uptake, preliminary experiments confirming anti-EGFR antibody binding were performed, as well as FMT phantom experiments as proof of concept (Supplemental Figs. 1 and 2).
In Vivo Biodistribution at 2 Hours
FMT/CT imaging at 2 h (Fig. 1A) showed a strong signal (>35 %ID/cm3) from all 3 Alexa750-labeled antibody formats in the liver of the mice, and no significant differences were found between mAb, F(ab′)2, and Fab. In contrast, accumulation in the kidneys was strongly dependent on the size of the different antibody formats. At 2 h, only 7.9 %ID/cm3 of the intact mAb was found in the kidneys, whereas a compound level of 22.9 %ID/cm3 was detected for F(ab′)2 and 52.7 %ID/cm3 for Fab. The segmented muscle tissue showed only weak uptake of anti-EGFR compounds. In the tumor, accumulation was observed for all antibody formats, but no significant differences were found between the formats at 2 h.
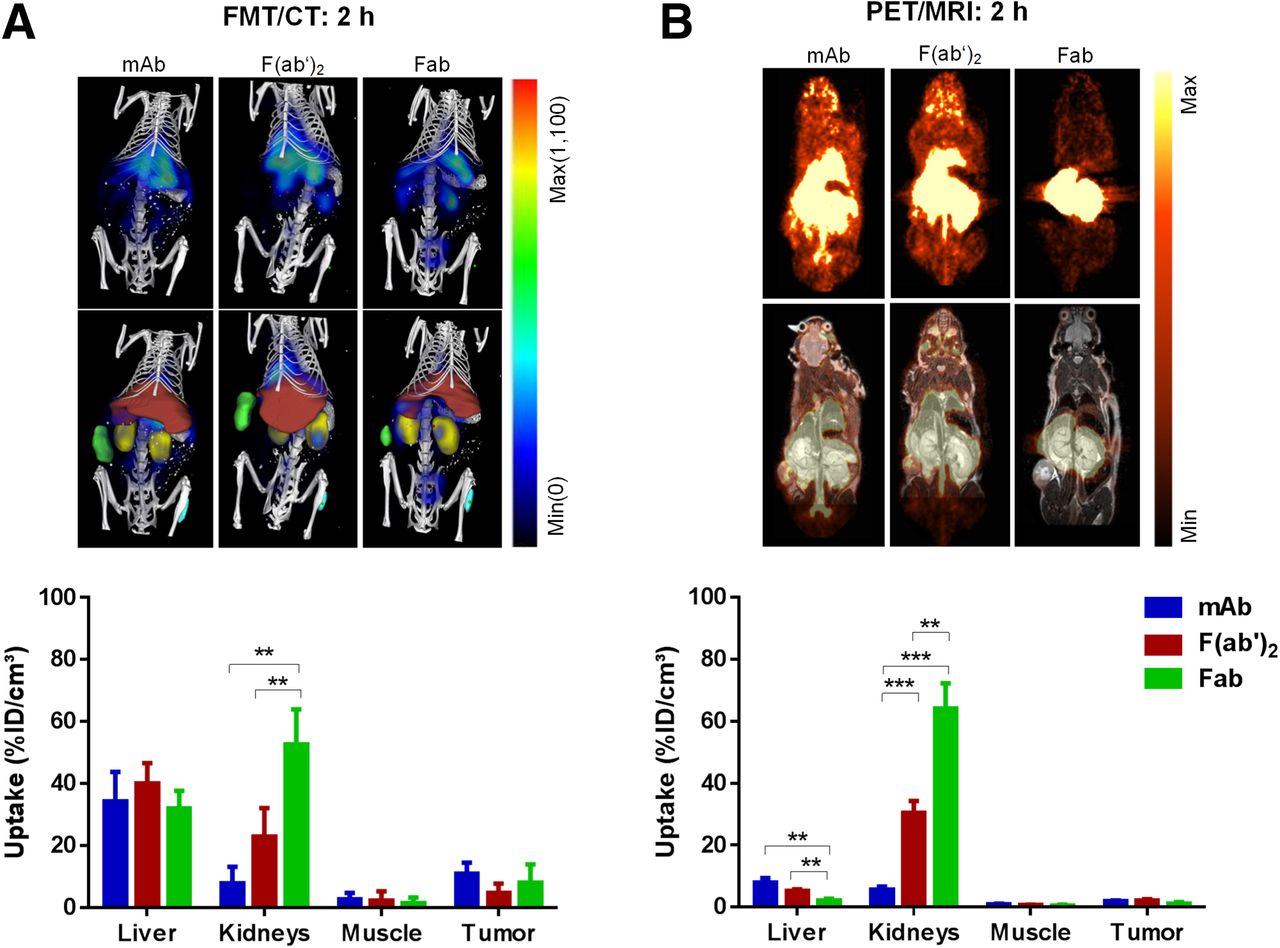
FMT/CT and PET/MRI analysis 2 h after injection of anti-EGFR compounds (mAb, F(ab′)2, Fab). (A) Exemplary FMT images overlaid with CT bone structure (first row) and with segmented organs (second row) illustrate biodistribution of anti-EGFR constructs at 2 h. Segmented liver is shown in red, kidneys in yellow, muscle in cyan, and tumor in green. Quantitative results of compound accumulation determined by FMT/CT are shown in bar chart. (B) Anatomically corresponding sections of PET scans (first row) and overlay with MRI scans (second row). Quantitative results of compound accumulation determined by PET/MRI are shown in bar chart. **P < 0.01. ***P < 0.001.
PET/MRI measurements were performed analogously to the FMT/CT study to compare the biodistribution patterns monitored by 2 different technologies. As observed in the FMT/CT study, the quantitative analysis by PET/MRI 2 h after injection showed a size-dependent clearance of the antibodies by the kidneys (mAb:F(ab′)2:Fab = 5.6:30.4:64.2 %ID/cm3) (Fig. 1B). However, compared with the fluorescence-labeled compounds used in the FMT/CT study, the level of radiolabeled anti-EGFR-F(ab′)2 and -Fab in the kidneys was higher (F(ab′)2-Alexa750:F(ab′)2-64Cu-NODAGA = 22.9:30.4 %ID/cm3 and Fab-Alexa750:Fab-64Cu-NODAGA = 52.7:64.2 %ID/cm3). In contrast, the 64Cu-NODAGA–labeled constructs showed a substantially lower accumulation in the liver tissue (Fig. 1B) than did the Alexa750-labeled compounds (Fig. 1A). Only low compound levels were detected in the segmented muscle tissues by PET/MRI. The tumor uptake of 64Cu-NODAGA–labeled compounds was low at 2 h (Fig. 1B). A direct comparison of the quantitative mean values of %ID/cm3 of tissue with SD measured by both technologies at 2 h is shown in Supplemental Table 1.
In Vivo Biodistribution at 24 Hours
The drug distribution determined by FMT/CT 24 h after injection (Fig. 2A) showed a decreased level of mAb-Alexa750, F(ab′)2-Alexa750, and Fab-Alexa750 in the liver compared with the values at 2 h (Fig. 1A). The decreased level of F(ab′)2-Alexa750 and Fab-Alexa750 in the kidneys at 24 h indicated renal excretion of these constructs. The strongest accumulation in the tumor was detected for mAb, at 13.1 %ID/cm3. The %ID/cm3 was significantly lower for the fragments in the tumor tissue than for the intact mAb (3.6 %ID/cm3 for F(ab′)2 [P < 0.01] and 1.9 %ID/cm3 for Fab [P < 0.001]).
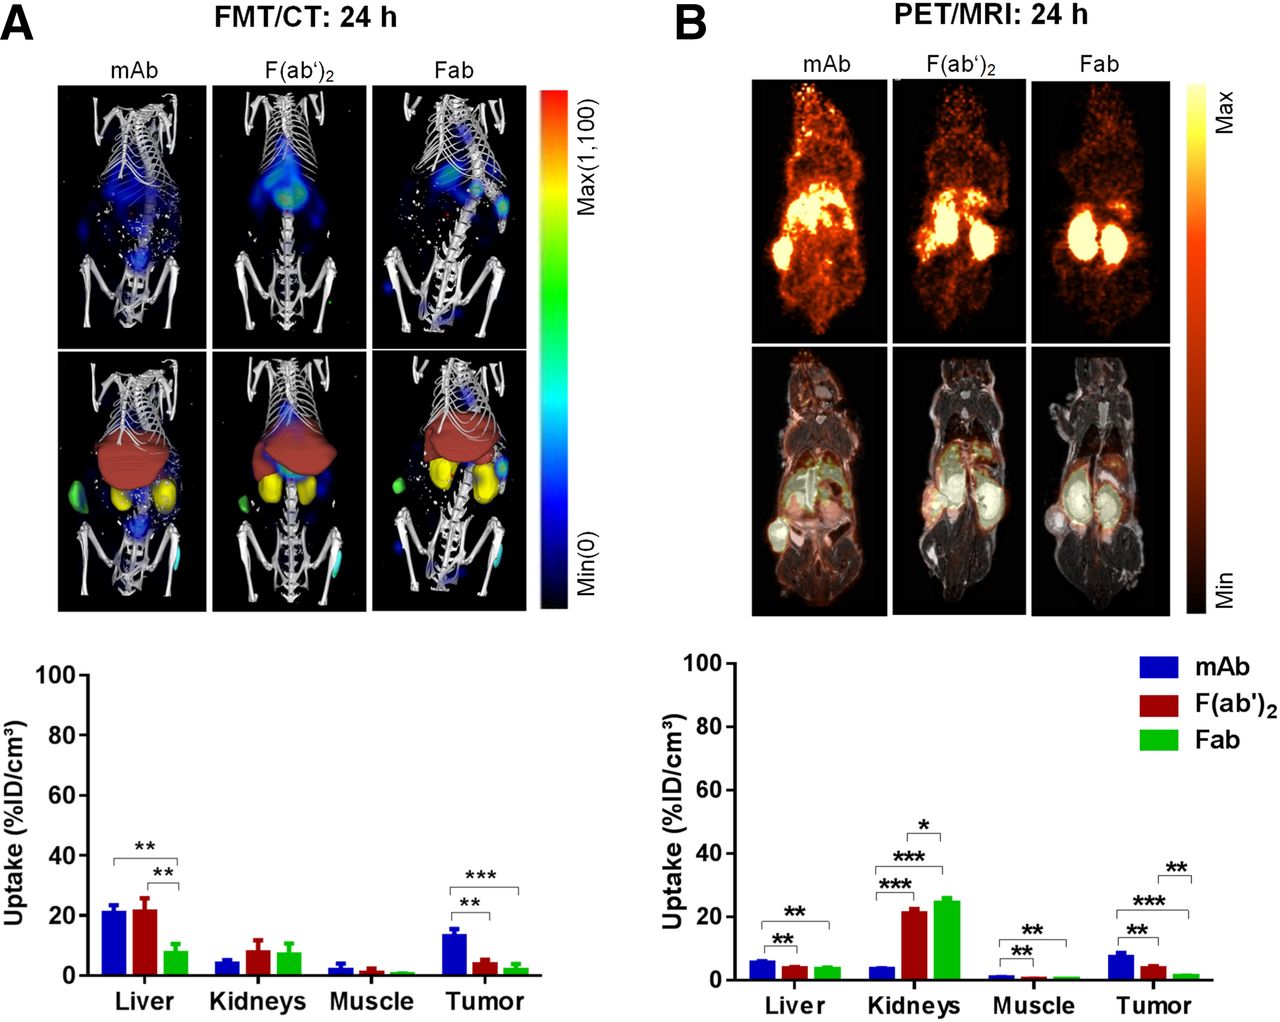
FMT/CT and PET/MRI analysis 24 h after injection of anti-EGFR compounds (mAb, F(ab′)2, Fab). (A) Exemplary FMT images overlaid with CT bone structure (first row) and with segmented organs (second row) illustrate biodistribution of anti-EGFR constructs at 24 h. Segmented liver is shown in red, kidneys in yellow, muscle in cyan, and tumor in green. Quantitative results of compound accumulation determined by FMT/CT is shown in bar chart. (B) Anatomically corresponding sections of PET scans (first row) and overlay with MRI scans (second row). Quantitative results of compound accumulation determined by PET/MRI are shown in bar chart. *P < 0.05. **P < 0.01. ***P < 0.001.
The 64Cu-NODAGA–labeled compounds showed a substantially decreased accumulation in the liver tissue (Fig. 2B) compared with the Alexa750-labeled compounds (Fig. 2A). Only low compound levels were detected in the segmented muscle tissues by PET/MRI, which is in line with FMT/CT measurement data. The tumor uptake of 64Cu-NODAGA–labeled compounds increased over time, indicating the highest uptake of mAb to be 7.3 %ID/cm3 at 24 h (Fig. 2B). The format-dependent tumor uptake at 24 h agreed well with the uptake of Alexa750-labeled constructs measured by FMT/CT (Fig. 2A). A direct comparison of the quantitative values of %ID/cm3 of tissue (mean ± SD) measured by both technologies at 24 h is shown in Supplemental Table 2. To report the signal-to-noise ratio of the in vivo measurements, the tumor-to-muscle ratio was calculated. This is shown for both in vivo imaging technologies (Supplemental Fig. 3).
Correlation Analysis of FMT/CT with PET/MRI
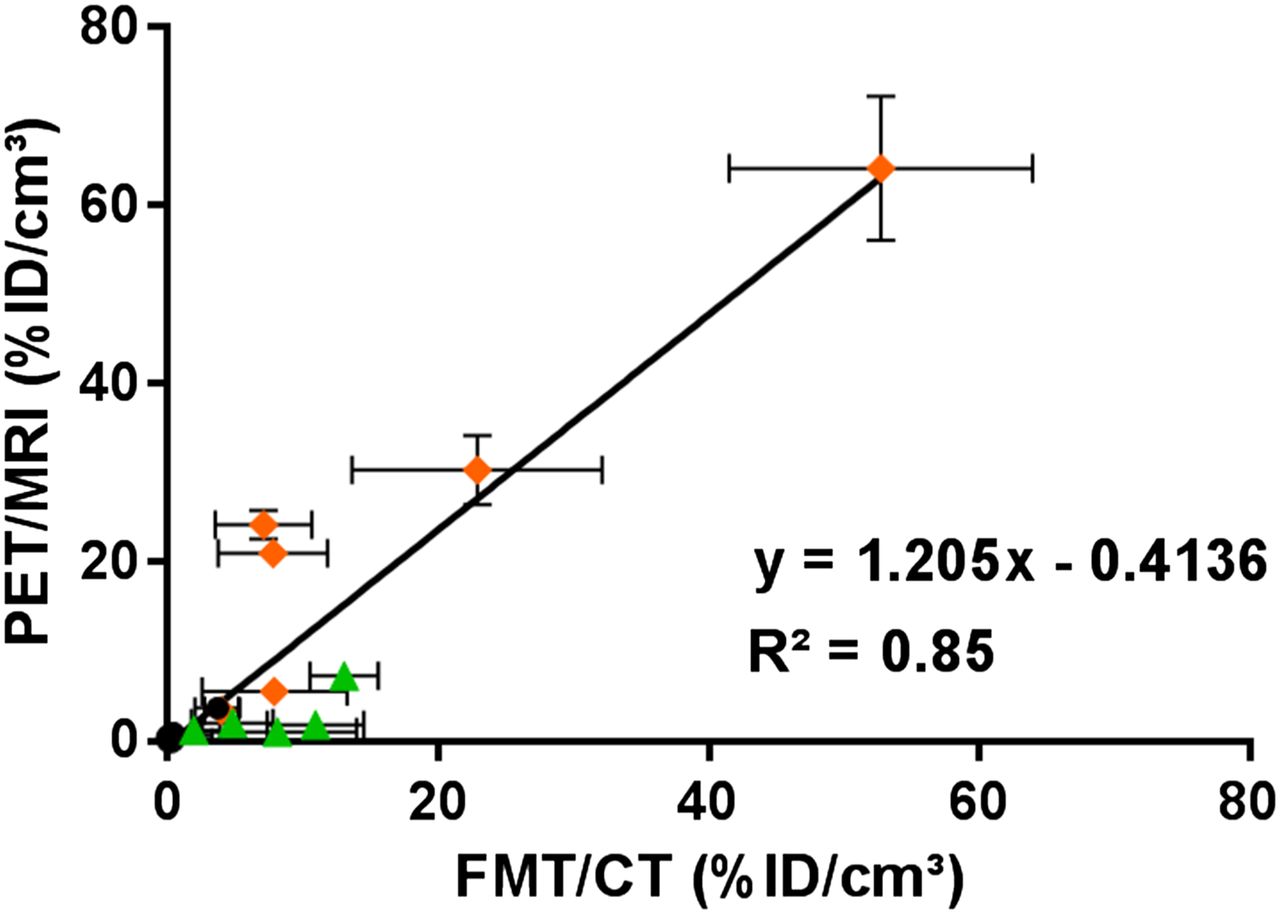
To compare the results generated by PET/MRI with the FMT/CT technology, a correlation analysis was performed. An overall good correlation between FMT/CT and PET/MRI data for tumor, kidney, and muscle tissues 2 and 24 h after injection of antibody formats was observed (R2 = 0.85) (Fig. 3). The mean values of the livers at the 2 time points were not included because of label-dependent differences in liver uptake between Alexa750 and 64Cu-NODAGA.

Correlation between mean values over all animals of each group between FMT/CT and PET/MRI in different tissues (kidneys, muscles, tumors) at 2 and 24 h (P < 0.0001). Mean values of liver tissues were excluded because of differences in uptake of the 2 labels.
Ex Vivo Quantification of Compound Accumulation in Whole Organs and Tumors
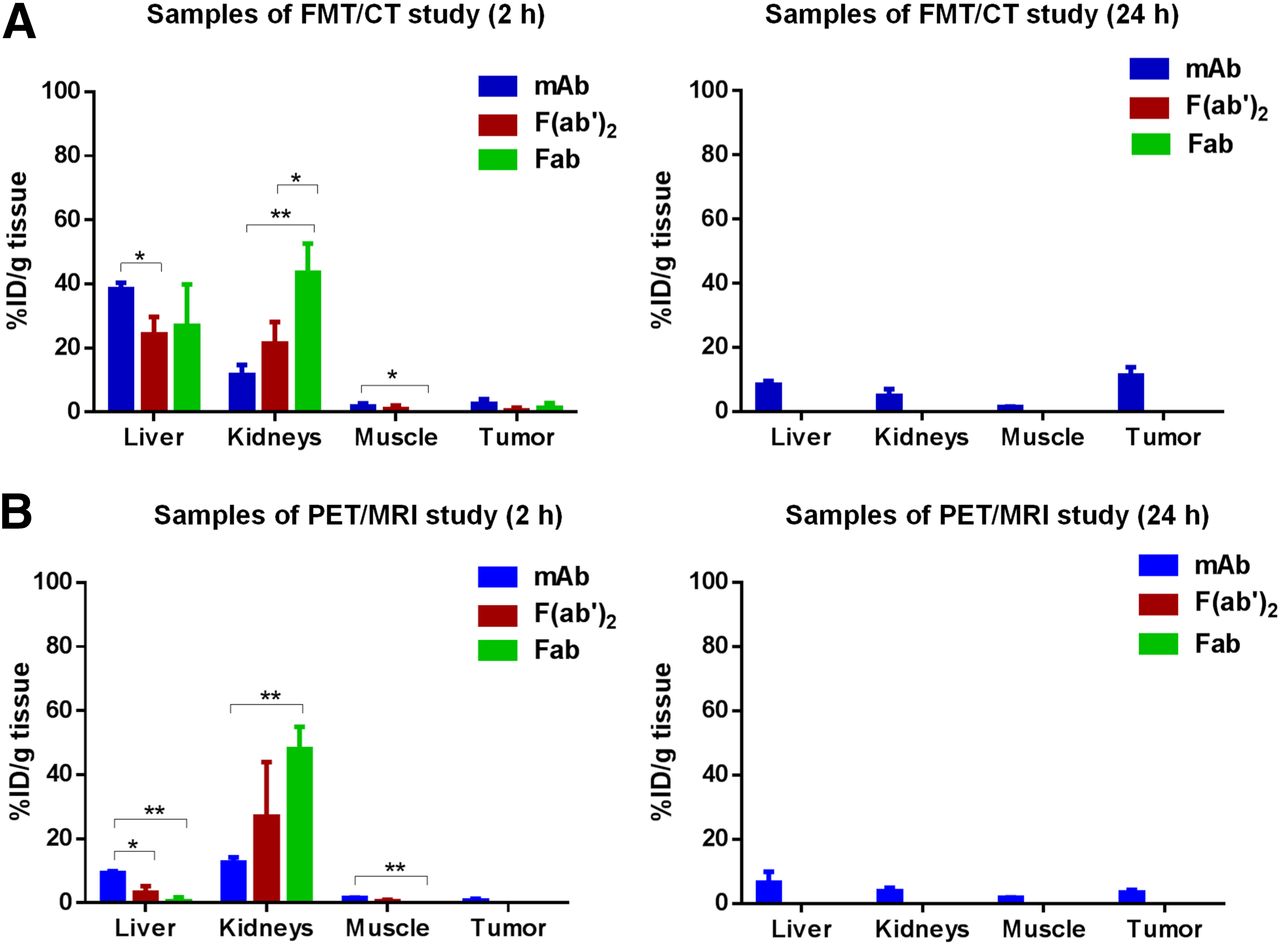
For validation of in vivo FMT/CT and PET/MRI, 2D fluorescence reflectance imaging and γ-counting measurements of explanted tissues (liver, kidneys, muscle, tumor) were performed. Overall, the ex vivo fluorescence measurements and γ-counting showed good agreement with FMT/CT and PET/MRI data, respectively, at 2 h and 24 h (Fig. 4). In line with the in vivo experiments, Alexa750-labeled compounds measured by 2D fluorescence reflectance imaging indicated a substantially increased relative accumulation in the liver as compared with radiolabeled compounds quantified by γ-counting, which also appeared to be independent of the antibody format. In contrast, signal levels obtained from the kidneys showed clear size-dependent compound elimination for both 2D fluorescence reflectance imaging and γ-counting measurements, because higher levels of smaller fragments than of the full antibody mAb were detected in the kidneys at 2 h. Both ex vivo modalities confirmed a significantly higher drug uptake in the tumor tissue for the intact mAb at 24 h, as for the fragments.

Ex vivo assessment of drug biodistribution 2 and 24 h after injection obtained from 2D planar fluorescence reflectance measurements (A) and γ-counting measurements (B) of explanted liver, kidney, muscle, and tumor tissues. *P < 0.05. **P < 0.01. ***P < 0.001.
Ex Vivo Quantification of Compound Accumulation in Tissue Homogenates
ECLIA measurements were performed to quantify the amount of antibody formats present in tissue homogenates. In contrast to FMT/CT and PET/MRI, ECLIA is specific for the κ light chain of the antibody and is thereby independent of the label. ECLIA measurement at 2 h confirmed a higher amount of Alexa750-labeled antibodies (25–40 %ID/cm3) (Fig. 5A) than of 64Cu-NODAGA–labeled compounds (3–9 %ID/cm3) in the liver (Fig. 5B). In the kidneys, ECLIA confirmed the strong size-dependent accumulation for both fluorescence-labeled and radiolabeled compounds. Antibody levels found at 2 h in the tumor and muscle were low. At 24 h, antibody levels could be detected only for the intact antibody, whereas protein levels of the fragments were below the limit of quantification. In this context, mAb levels in the tumor were comparable for both labels.
Quantification of anti-EGFR construct levels in tissue homogenates. (A) %ID of Alexa750-labeled compounds (anti-EGFR-mAb, -F(ab′)2, -Fab) per gram of tissue (liver, kidneys, muscle, tumor) (n = 5) determined by ECLIA in tissue homogenates 2 h and 24 h after injection. (B) %ID of 64Cu-NODAGA–labeled compounds (anti-EGFR-mAb, -F(ab′)2, -Fab) per gram of tissue (liver, kidneys, muscle, tumor) (n = 4) determined by ECLIA in tissue homogenates 2 h and 24 h after injection. *P < 0.05. **P < 0.01. Some levels of F(ab′)2 and Fab constructs were below limit of quantification.
Correlation Analysis of In Vivo Imaging and Ex Vivo Technologies
A correlation analysis between in vivo imaging technologies and ex vivo ECLIA was performed. As shown in Figures 6A and 6B, the in vivo biodistribution data for FMT/CT and PET/MRI at 2 h after injection revealed a strong correlation with the ECLIA values in the liver, kidney, muscle, and tumor tissues (R2 = 0.9 and 0.95, respectively).
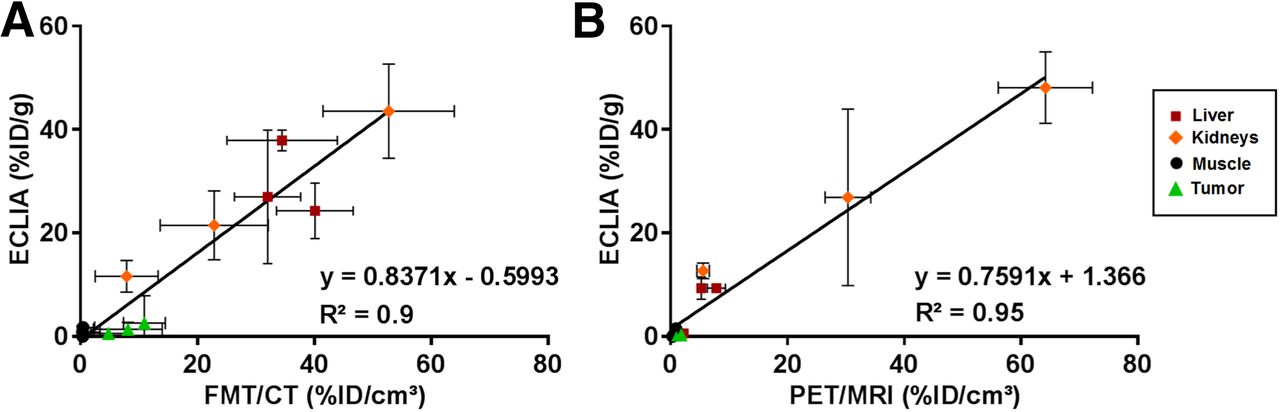
Correlation between in vivo and ex vivo biodistribution analyses. (A) Correlation of mean values over all animals of each group between FMT/CT values and ECLIA values (A) and between PET/MRI and ECLIA values (B) in livers, kidneys, muscles, and tumors at 2 h (P < 0.0001). Each point represents 1 region (liver, kidneys, muscle, or tumor) and 1 of 3 antibody formats.
Evaluation of Pharmacokinetics by Blood Serum Analysis
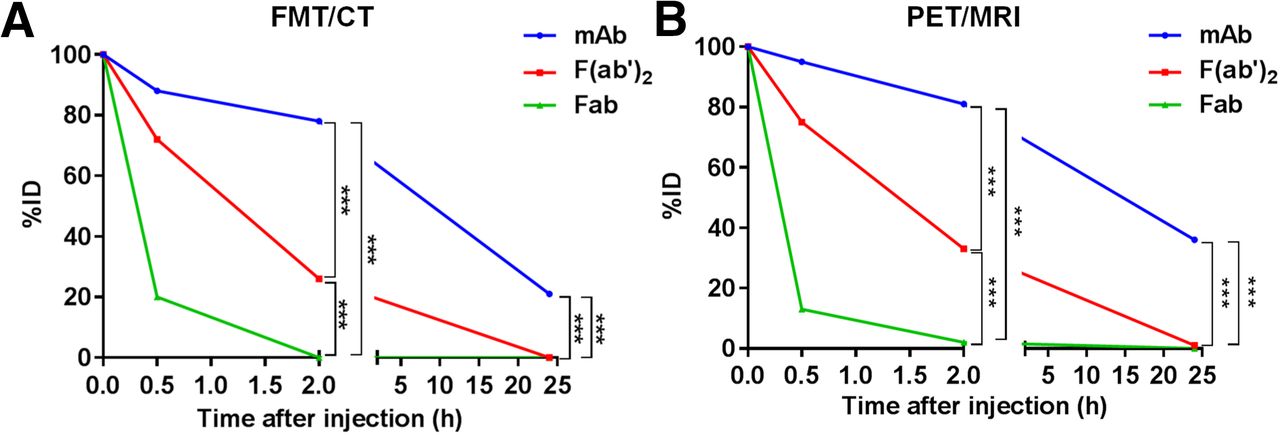
Quantification of blood serum samples at different time points (5 min, 30 min, 2 h, and 24 h after injection) via ECLIA provided information about drug clearance (Fig. 7). The Alexa750-labeled compounds (Fig. 7A) and the radiolabeled compounds (Fig. 7B) showed similar courses of blood clearance. However, the blood half-times were slightly shorter for the Alexa750-labeled compounds than for the 64Cu-NODAGA-labeled compounds. After 12.8 h, half of the mAb-Alexa750 was eliminated from blood, whereas it took 17.2 h for half of the mAb-64Cu-NODAGA to clear. The blood half-times for the F(ab′)2 fragments were 1.2 h for the fluorescence-labeled F(ab′)2 and 1.4 h for the radiolabeled F(ab′)2. The smaller Fab fragments showed values comparable to the blood half-times (Fab-Alexa750, 0.3 h; Fab-64Cu-NODAGA, 0.3 h).

Compound level of fluorescent and radiolabeled anti-EGFR constructs in blood serum. %ID of Alexa750-labeled compounds (A, n = 5) and 64Cu-NODAGA–labeled compounds (B, n = 4) in blood serum samples collected at several time points (5 min, 30 min, 2 h, and 24 h after injection) and quantified by ECLIA analysis. ***P < 0.001.
DISCUSSION
In this study, we investigated the performance of advanced FMT/CT imaging against PET/MRI to noninvasively and quantitatively assess the drug biodistribution of labeled therapeutic antibody formats in a preclinical cancer mouse model. For this purpose, we injected fluorescence-labeled compounds and monitored organ and tumor uptake at different time points via FMT/CT. The same experiment was performed with radiolabeled compounds using PET/MRI. Direct comparison of FMT/CT with PET/MRI and additional ex vivo technologies provided an adequate validation of the optical imaging technology.
Before clinical application, the in vivo pharmacokinetics of therapeutic molecules need to be extensively studied. Because invasive ex vivo methods such as blood sampling and necropsy require many animals and do not allow longitudinal measurements, noninvasive imaging technologies are of great interest in preclinical research. PET and SPECT combined with CT and MRI are widely accepted as the gold standard for the absolute quantification of drug levels in vivo. The PET technology is characterized by high sensitivity and good tissue penetration (16). However, Compton scattering (17) and the partial-volume effect in PET imaging, which are due to its limited spatial resolution, can lead to a lack of precision (18). This is the reason for differences between in vivo quantification and ex vivo γ-counting results. In addition, the radiation exposure and the half-life of radioactive isotopes must be considered. In contrast to use of radiolabels for PET, the FMT technology requires fluorescence labeling (2). However, light emitted by fluorescent probes is prone to strong optical absorption and scattering, limiting the application to nude mouse models or to mice whose hair has been removed, if quantitative data are desired. For clinical application, the use of advanced FMT/CT is restricted to imaging of body parts that are only several centimeters away from the entry point of the light (19). Thus, in translational theranostic studies, PET might be more appropriate (20).
In our study, FMT/CT and PET/MRI data correlated with ex vivo measurements and showed similar biodistribution patterns. In addition, except for liver, in vivo imaging data for different labeled compounds, measured with both modalities, correlated well, qualifying FMT/CT for routine preclinical drug research on nude mice. The difference in liver uptake was not expected but may have resulted from the label characteristics, such as hydrophobicity and charge. The immunoreactivity of the protein after the labeling procedure is important to know before in vivo application. For our imaging experiments, we demonstrated proper binding of labeled antibody to A-431 tumor cells by microscopy analysis. However, we recommend the performance of further binding affinity studies (e.g., Biacore) for future experiments. Only a few studies have investigated altered protein characteristics after labeling, reporting that Alexa750 labeling increases liver uptake (21). The altered liver concentration was described to be a result of the number of fluorescent dye molecules per compound and of the conformation of the labeled substance (22). Therefore, protein-to-dye ratio particularly needs to be considered, as the degree of labeling may affect the biodistribution. In addition, Ho et al. showed that the indocyanine green dye accumulated in the liver and was transcytosed by hepatocytes via the transporter organic anion transport protein (23). Hence, the similarity of Alexa750 to indocyanine green dye may cause liver uptake through the same transporter. Apart from that, radiocopper complexes have been found to vary in their stability (24). Studies demonstrated that labeling a molecule with copper chelators has an influence on its liver metabolism as copper dissociates from the chelator. The dissociated Cu(II) binds to a protein called superoxide dismutase, which is especially abundant in the liver (25). Consequently, further research on the use of fluorescence and radiolabels is clearly warranted as stated previously by Cilliers et al. (26), and the label degradation in vivo must be considered. The ex vivo ECLIA analysis is a good alternative and measures protein concentrations independently of the label. However, on internalization of the antibody construct in the cell, the compound is presented to lysosomes, is cleared within the cell, and can no longer be detected via ECLIA analysis.
Furthermore, our consecutive FMT/CT, as well as PET/MRI, measurements proved that the intact antibody showed the highest uptake in the tumor, accompanied by a long persistence in the blood. The F(ab′)2 and Fab fragments showed a lower tumor uptake because they were rapidly cleared through the renal route, resulting in low bioavailability in serum. The short blood half-time of the fragments presumably diminishes the penetration of the fragments to the tumor tissue. The clearance kinetics of the different antibody formats shown in this study match those of a former study, which focused on the kinetics of a specific mAb and fragments for prostate cancer and found faster blood clearance of antibody fragments than of complete antibodies (27). In general, compared with intact antibodies, fragments diffuse more easily from the circulating blood and are eliminated more quickly by the kidney (28). Overall, both technologies, FMT/CT and PET/MRI, provided valid data on the drug biodistribution in kidney, muscle, and tumor tissues.
CONCLUSION
To the best of our knowledge, this study was the first detailed side-by-side comparison of the performance of small-animal FMT/CT with that of PET/MRI for preclinical evaluation of drug distribution. The strong correlation of the FMT/CT and PET/MRI measurements with the ex vivo results, as well as the consistency of the biodistribution patterns determined by both in vivo technologies, qualifies advanced FMT/CT as a convenient and cost-effective technology to obtain pharmacokinetic information on therapeutic compounds in nude mice and as a promising alternative to classic PET. However, the influence of the fluorescent label must be carefully considered because it may change the liver uptake and, thus, lead to wrong conclusions on a drug’s biodistribution.
DISCLOSURE
This study was sponsored by Roche Diagnostics GmbH. Carina Hage, Franz Osl, Werner Scheuer, and Thomas Poeschinger are employees of Roche. Felix Gremse is the founder of Gremse-IT GmbH. Felix Gremse and Fabian Kiessling received funding from the German Higher Education Ministry (BMBF, Biophotonics, 13N13355) and the European Union (FP7). Bernd J. Pichler receives research support from Mediso and Roche. No other potential conflict of interest relevant to this article was reported.
Acknowledgments
We express gratitude to Axel Wessner for fluorescence labeling of anti-EGFR compounds, as well as to Klaus Mackeben and Kay-Gunnar Stubenrauch for ECLIA quantification.
Footnotes
Published online Aug. 28, 2017.
- © 2018 by the Society of Nuclear Medicine and Molecular Imaging.
REFERENCES
- Received for publication June 14, 2017.
- Accepted for publication July 25, 2017.


