


Abstract
Our study aimed to develop a method to mathematically predict the kinetic parameters K1 (influx rate constant), k2 (efflux rate constant), and BPND (nondisplaceable binding potential) of amyloid PET tracers and obtain SUV ratios (SUVRs) from predicted time–activity curves of target and reference regions. Methods: We investigated 10 clinically applied amyloid PET radioligands: 11C-Pittsburgh compound B, 11C-BF-227, 11C-AZD2184, 11C-SB-13, 18F-FACT, 18F-florbetapir, 18F-florbetaben, 18F-flutemetamol, 18F-FDDNP, and 18F-AZD4694. For each tracer, time–activity curves of both target and reference regions were generated using a simplified 1-tissue-compartment model, with an arterial plasma input function and the predicted kinetic parameters. K1, k2, and BPND were derived from the lipophilicity (logP), apparent volume, free fraction in plasma, free fraction in tissue, dissociation constant, and density of amyloid β using biomathematic modeling. Density was fixed at 3 nM to represent healthy control conditions and 50 nM to represent severe Alzheimer disease (AD). Predicted SUVRs for the healthy and AD groups were then obtained by dividing the integrated time–activity curve of the target region by that of the reference region. To validate the presented method, the predicted K1, k2, BPND, and SUVR for the healthy and AD groups were compared with the respective clinically observed values. Results: The correlation between predicted and clinical kinetic parameters had an R2 value of 0.73 for K1 in the healthy group, 0.71 for K1 in the AD group, 0.81 for k2 in the healthy group, 0.85 for k2 in the AD group, and 0.63 for BPND in the AD group. The regression relationship between the predicted SUVR (y) and the clinical SUVR (x) for the healthy and the AD groups was y = 2.73x – 2.11 (R2 = 0.72). Conclusion: The proposed method showed a good correlation between predicted and clinical SUVR for the 10 clinically applied amyloid tracers.
Aggregation of amyloid β (Aβ) peptide is one of the pathologic observations in the brains of individuals with Alzheimer disease (AD). Amyloid imaging using PET allows quantitative visualization of Aβ deposition in the living human brain (1). In the last decade, many PET radioligands have been developed for amyloid imaging. Some of these have successfully been applied in human PET studies: for example, 11C-Pittsburgh compound B (PIB) (2), 11C-labeled 2-(2-[2-dimethylaminothiazol-5-yl]ethenyl)-6-(2-[fluoro]ethoxy)benzoxazole (11C-BF-227) (3–6), 11C-labeled 5-(6-{[tert-butyl(dimethyl)silyl]oxy}-1,3-benzothiazol-2-yl)pyridin-2-amine (11C-AZD2184) (7), 11C-4-N-methylamino-4′-hydroxystilbene (11C-SB-13) (8), 18F-2-[(2-{(E)-2-[2-(dimethylamino)-1,3-thiazol-5-yl]vinyl}-1,3-benzoxazol-6-yl)oxy]-3-fluoropropan-1-ol (18F-FACT) (4), 18F-florbetapir (Amyvid; Eli Lilly and Company) (9,10), 18F-florbetaben (Neuraceq; Piramal Imaging) (11), 18F-flutemetamol (Vizamyl; GE Healthcare) (12,13), 2-(1-{6-[(2-18F-fluoroethyl)(methyl)amino]-2-naphthyl}ethylidene)malonitrile (18F-FDDNP) (14), and 2-[2-18F-fluoro-6-(methylamino)-3-pyridinyl]-1-benzofuran-5-ol (18F-AZD4694) (15).
In general, the discovery and development of radioligands for clinical application requires complicated and sometimes empiric procedures in terms of chemical factors (e.g., stability of labeling and lipophilicity) or biologic factors (e.g., affinity, metabolites, and density [Bavail] of the target) (16,17). The radioligand should preferably bind with high affinity to target molecules while having a low affinity for other nonspecific binding sites (18). It is also expected that the radioligand will readily cross the blood–brain barrier and bind with the target whereas its undesirable metabolites will not penetrate the blood–brain barrier. Lipophilicity is often expressed as the logarithm of the partition coefficient (logP) or distribution coefficient (logD), and its optimal range for central nervous system (CNS) drugs with high permeability has been reported to vary from 1 to 3 (19). The dissociation constant (KD) is the index for affinity and is measured through in vitro binding experiments. Even though these factors have been well investigated in the case of candidate radioligands, several factors obtained through in vitro or in vivo animal studies may not be applicable to human studies, and it is not easy to develop successful radioligands and satisfy clinical demands (20). We need to know not only the microparameters of the candidate radioligands but also their overall macroscopic performance.
Recently, there has been growing interest in more efficient development of successful radioligands in clinical studies using systematic evaluation of their overall performance (e.g., outcome measures). It is obvious that the use of in vivo PET scans in animals or humans is the fastest and easiest approach to evaluating the overall performance of the candidate radioligand. However, the development of a labeling protocol for positron emitter isotopes, and the synthesis of a radioligand for PET studies, are labor-intensive and lengthy processes. A systematic screening method for CNS radioligands without the use of in vivo PET scans was proposed by Guo et al. (17). Their method mathematically simulates clinical dynamic PET data for each candidate radioligand using the kinetic parameters K1 (influx rate constant) and k2 (efflux rate constant) between arterial plasma and brain tissue and the kinetic parameter BPND (nondisplaceable binding potential) (16) with fluctuations in statistical noise and the human population (21). The kinetic parameters were derived from biomathematic modeling using the logarithm of the distribution coefficient, taking into account several variables: all the neutral and charged forms of the molecule (clogD); the apparent molecular volume, or McGowan volume (cm3/mol/100) (Vx); the free fraction of radioligand in plasma (fp); the free fraction of nondisplaceable radioligand in brain tissue (fND); and the KD and Bavail of the target molecules. Good radioligands were screened out by comparing coefficients of variation for the estimated BPND (17). However, the approach includes in vitro animal experiments and analysis using liquid chromatography–tandem mass spectrometry for fP and fND, and it is difficult to achieve high reproducibility and reliability among different researchers and facilities. The approach has been applied only for CNS radioligands, not for amyloid PET tracers.
We proposed a new method to predict the SUV ratio (SUVR) of amyloid PET radioligands using biomathematic modeling and an in silico parameter; here, we use the words in silico to indicate numerically computed. SUVR is a common outcome measure in clinical amyloid PET imaging because it does not require use of arterial blood sampling and long dynamic PET scans. Furthermore, instead of using in vitro measurement of fp and fND, we investigated a surrogate method of measurement using a regression relationship determined from previously reported datasets of in silico logP, in vitro fND, and fP. The applicability and reliability of the proposed method in predicting the SUVRs of amyloid radioligands were validated using previously clinically observed kinetic parameters and the SUVRs for 11C-PIB, 11C-BF-227, 11C-AZD2184, 11C-SB-13, 18F-FACT, 18F-florbetapir, 18F-florbetaben, 18F-flutemetamol, 18F-FDDNP, and 18F-AZD4694.
MATERIALS AND METHODS
Amyloid PET Radioligands
Ten clinically applied amyloid radioligands (11C-PIB, 11C-BF-227, 11C-AZD2184, 11C-SB-13, 18F-FACT, 18F-florbetapir, 18F-florbetaben, 18F-flutemetamol, 18F-FDDNP, and 18F-AZD4694) were evaluated in this study. The measured KD for these ligands and the clinical SUVRs are detailed in Table 1. We selected the clinical SUVRs for specific cortical regions that show the highest SUVR in AD patients. The chemical structures of all radioligands, excepting 18F-FACT, were downloaded from PubChem (https://pubchem.ncbi.nlm.nih.gov) and used in the prediction study. The chemical structure of 18F-FACT was manually drawn using commercial software.
Binding Properties of 10 Amyloid PET Radioligands
Biomathematic Modeling
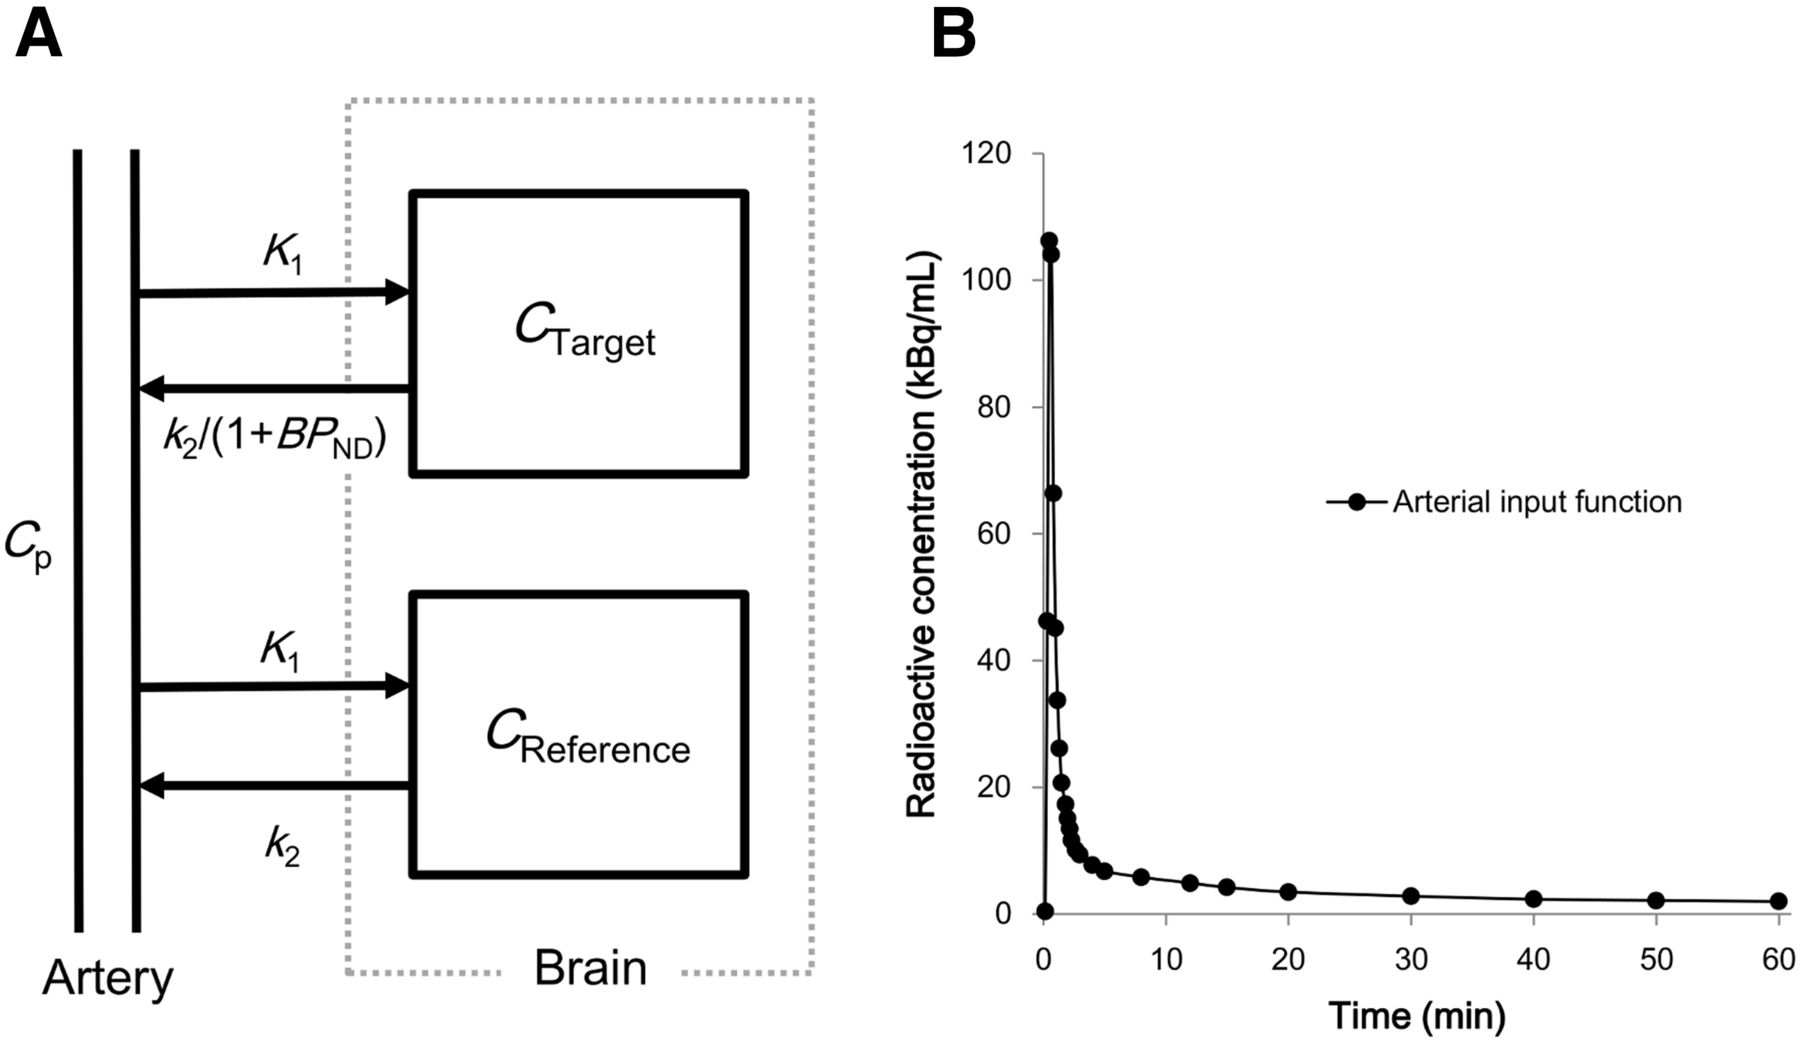
We assumed that the radioligand of interest obeyed the simplified 1-tissue-compartment model (Fig. 1A). The kinetic parameters in the human brain for each radioligand were mathematically modeled. The time–activity curves, with or without specific binding of the radioligand in brain tissue, were calculated as follows: Eq. 1In this equation, Ctarget is the time–activity curve of the target region, where the radioligand specifically binds to the target protein; Creference is the time–activity curve of the reference region without the target protein; and Cp is the arterial plasma input function. K1 from plasma to brain tissue (mL/cm3/min) was formulated using the Renkin–Crone model as follows:
 Eq. 2where P, f, and S are capillary permeability (cm/min), perfusion (mL/cm3/min), and capillary surface area (cm2/cm3 of brain), respectively. f and S were set to 0.6 and 150, respectively. A scaling factor for K1, 3.43, was introduced to compensate for the difference between in vivo K1 and predicted K1 and was determined by Guo et al. (17) using 13 CNS radioligands that are known to exhibit passive diffusion. Permeability in Equation 2 was empirically formulated as follows (17):
 Eq. 3The k2 from brain tissue to plasma (1/min) was expressed using the following equation, assuming equilibrium in the radioligand concentrations between plasma and brain tissue:
 Eq. 4where Vaq_p and Vaq_T are the apparent aqueous volume in plasma (solvent/mL of plasma) and the apparent aqueous volume in tissue (solvent/mL of tissue), respectively. These were set to 0.98 and 0.9, respectively (17). The radioligand’s BPND at the target site was expressed as follows:
 Eq. 5where Bavail and KD are in units of nmol/L. The time–activity curves of the target and reference regions were calculated using K1, k2, and BPND and the arterial input function Cp (Fig. 1B) using Equation 1. The parameter of interest, SUVR, was then estimated from the predicted time–activity curves.

(A) One-tissue-compartment model for both target and reference regions. (B) Measured human plasma input function Cp(t) for 11C-BF227 used in simulation.
Prediction of Clinical SUVR in Amyloid PET Imaging
For each amyloid radioligand, brain permeability in Equation 3 was estimated from Vx and lipophilicity calculated using the commercial software dProperties (Talete SRL). Instead of clogD in Equation 3, we used the in silico Moriguchi logP (22). K1 was then calculated as detailed in Equation 2.
The k2 in Equation 4 was estimated from K1, fP, and fND. fP and fND were estimated from in vitro binding experiments using mouse brain and plasma and the in silico lipophilicity of 24 CNS drugs (e.g., risperidone, haloperidol, and fluvoxamine) reported by Wan et al. (23) and Maurer et al. (24). The datasets were obtained from references, and then the regression relationships for clogP versus fND and fND versus fP were determined. After a specific radioligand was given, the corresponding fP and fND were estimated from these regression lines.
In amyloid PET imaging, Bavail in Equation 5 can be regarded as the available binding sites of Aβ fibrils in vivo on aggregate surfaces. The nominal concentration of Aβ fibrils in the frontal, temporal, and parietal cortices of the healthy control and AD subjects was less than 3 nM and 60 nM, respectively, in postmortem human brain tissue (25). Therefore, we regarded the approximate available binding concentrations (Bavail) of Aβ fibrils in healthy and severe AD conditions as 3 nM and 50 nM, respectively. Furthermore, there exist several Aβ peptides that are combined with a different number of amino acids. In the human brain, Aβ1–40 and Aβ1–42 are major binding sites for amyloid radioligands. Therefore, we rearranged Equation 5 as follows: Eq. 6where a, KD-42, and KD-40 are the fractions of Aβ1–42, the KD for Aβ1–42, and the KD for Aβ1–40, respectively. Bavail-42, Bavail-40, and Bavail are the available binding sites of Aβ1–42 and Aβ1–40, (Aβ1–42 + Aβ1–40). a was assumed to have a value of 0.7, which is biochemically derived from fractions of extracellular insoluble Aβ1–42 in both AD and healthy brains (26). When neither KD-42 nor KD-40 was reported (e.g., 18F-FACT in Table 1), BPND was calculated from the only reported KD, estimated fND, and fixed Bavail using Equation 5 and not Equation 6.
For amyloid PET radioligands, the outcome measure was set to cortical SUVR with cerebellum as the reference region. For each of the 10 radioligands in subjects with a specific disease status (AD or healthy), SUVR was calculated using the time–activity curves in the target and reference regions predicted from the kinetic parameters as follows: Eq. 7where t1 and t2 are the start and end of the time interval for SUVR.
Evaluation of the Method
The predicted K1, k2, BPND, and SUVR were compared with their clinical counterparts. Clinical K1 and k2 for the AD and healthy groups were previously estimated from clinical PET images using the 2-tissue-compartment model with measured arterial plasma input function. With the exception of 18F-FDDNP and 18F-florbetapir, the clinical BPND was calculated as DVR-1, where DVR is the ratio of the estimated distribution volumes (VT) using the 2-tissue-compartment model in the target and reference regions (16). For each radioligand, the time intervals for the predicted SUVR in Equation 7 were set to the same values as applied in the clinical study (Table 1). For all simulations, a common input function, shown in Figure 1B, was used. This input function was the averaged plasma input function for 11C-BF227 in 6 healthy subjects and was obtained from Figure 3 in a previous publication (4). The arterial blood was sampled from 0 to 60 min but was linearly extrapolated to 150 min for simulation of 11C-SB-13, 18F-florbetaben, and 18F-flutemetamol.
RESULTS
Regression Relationship of fP vs. fND and fND vs. logP
Figure 2A shows the relationships between in silico lipophilicity and in vitro fND, and Figure 2B shows the relationships between in vitro fND and fP using the datasets of Wan et al. (23) and Maurer et al. (24). Good correlations were observed between lipophilicity and fND and between fND and fP (R2 = 0.78 and 0.80, respectively). As shown in Table 2, fp and fND were estimated for each amyloid radioligand using in silico lipophilicity (Moriguchi logP) and the regression lines shown in Figure 2.

Relationship between logP and fND (A) and between fND and fP (B) from previously reported datasets of in silico logP and in vitro fND and fP.
In Silico Chemical and Biologic Properties for Prediction of SUVR in 10 Amyloid PET Radioligands
Predicted K1, k2, and BPND
Table 3 shows the predicted and clinical K1 and k2 for 8 of the amyloid radioligands. The relationship between predicted and clinical K1 and between predicted and clinical k2 is plotted in Figures 3A and 3B, respectively. Because the predicted K1 and k2 were derived from the model independently of disease, there is no distinction between the healthy and AD groups in predicted K1 and k2, whereas clinical K1 and k2 were from the healthy group and the AD group, respectively (Fig. 3A and 3B).
Predicted and Clinically Estimated K1 and k2 of 8 Amyloid PET Radioligands in Cortical Region

Comparison between predicted (y-axis) and clinical (x-axis) K1 (A), k2 (B), and BPND (C) datasets in cortical regions. HC = healthy control.
Predicted K1 correlated positively with clinical K1 in the healthy group (R2 = 0.73) and, after exclusion of the outlier (18F-FDDNP), in the AD group as well (R2 = 0.71). The slope of the regression lines for predicted and clinical K1 in the AD group (3.02) was larger than that in the healthy group (1.82). The correlation between predicted and clinical k2 in the healthy and AD groups had an R2 value of 0.81 and 0.85, respectively. The slope of the regression lines for predicted and clinical k2 in the AD group (1.53) was larger than that in the healthy group (0.76). Predicted and clinical BPND for 9 of the amyloid radioligands is detailed in Table 4. Predicted BPND correlated positively with clinical BPND in the AD group (R2 = 0.63) (Fig. 3C).
Predicted and Clinical BPND (−) for 9 Amyloid PET Radioligands
Predicted SUVR
Figure 4 shows the correlation between predicted and clinical SUVR in the healthy and AD groups. Predicted SUVR (y) and clinical SUVR (x) correlated well (y = 2.73x – 2.11; R2 = 0.72). Regarding the individual radioligands, 11C-PIB differed from the regression lines slightly.
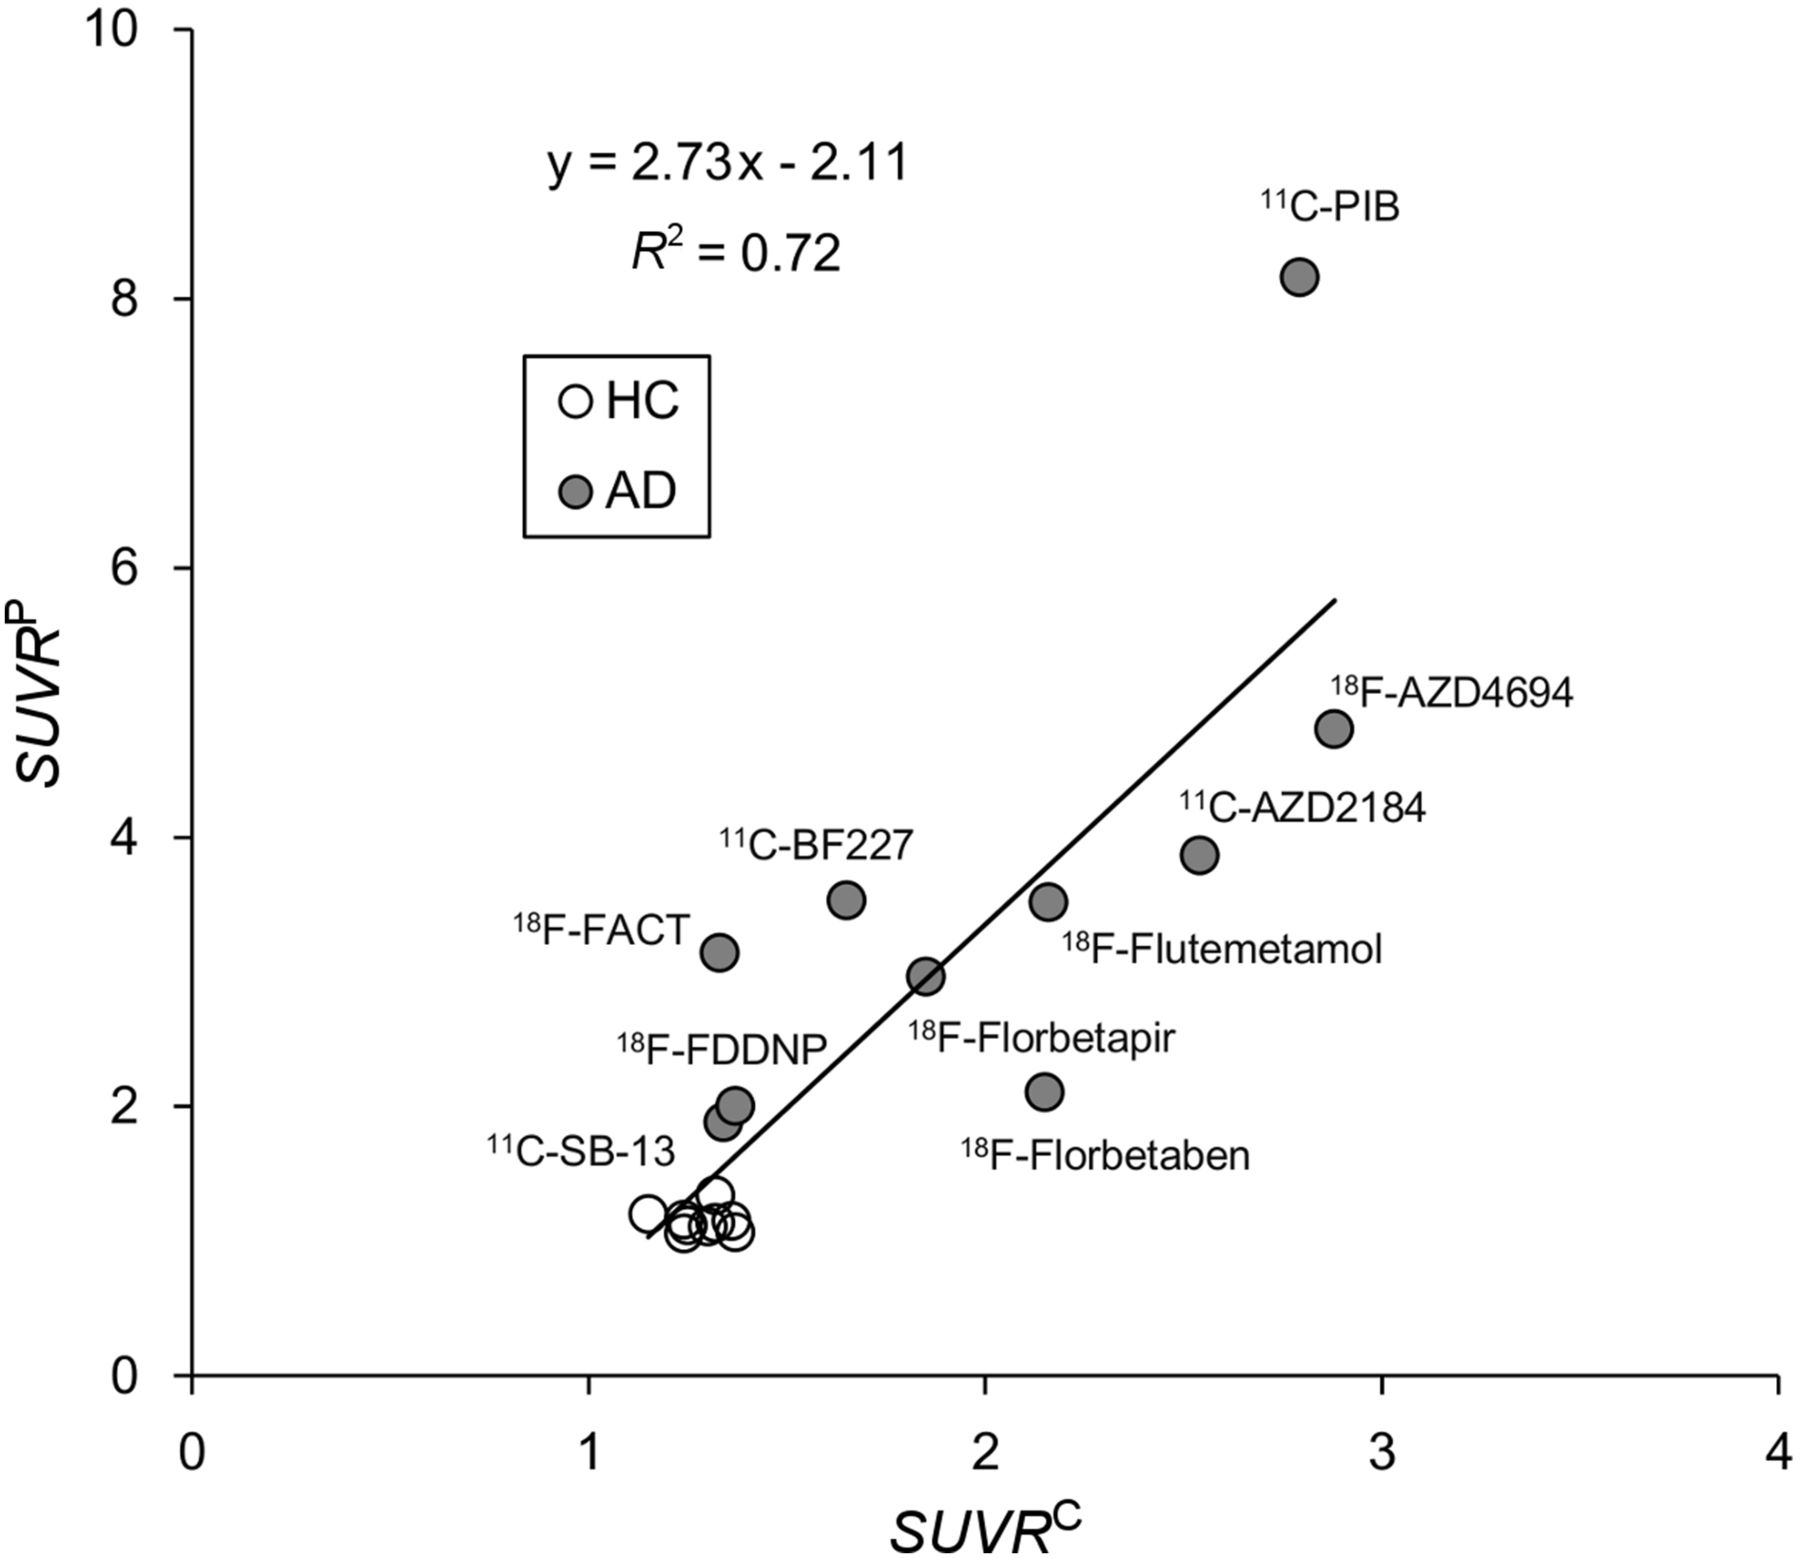
Comparison between predicted (y-axis) and clinical (x-axis) SUVR in healthy (HC) and AD subjects.
DISCUSSION
In a move toward finding a more efficient way to screen successful PET radioligands for clinical use, we have proposed a method of predicting the SUVR of amyloid PET radioligands. Rather than predicting other macroparameters, such as DVR as SUVR, we chose to predict SUVR because it is the most frequently used parameter in clinical studies, as it can be obtained without arterial blood sampling or dynamic PET scans and can be computed using a portion of the time–activity curve.
Predicted Permeability and K1
Permeability is an important parameter for the prediction of K1 in Equation 2. Guo et al. (17) estimated permeability according to Equation 3. However, clogD in Equation 3 was computed using in-house software (17) that was not available to us; thus, we used the Moriguchi logP as an alternative. Nonetheless, we found a positive correlation between predicted K1 and clinical K1 (Fig. 3A), although predicted K1 was slightly overestimated. There are several possible reasons for this overestimation. One is the physiologic change in K1 observed clinically in elderly subjects, especially those with AD. The other is the empiric scaling factor (3.43) introduced by Guo et al. (17), which compensates for the difference in K1 between in vivo studies (pig) and mathematic modeling.
With regard to the outlier, of the 8 tracers in Table 3 only 18F-FDDNP showed a higher clinical K1 in the AD group (0.36) than in the healthy group (0.25). A good correlation between predicted and clinical K1 in the healthy group was observed even when the 18F-FDDNP K1 data were included. We speculate that the reason 18F-FDDNP behaved differently, especially in the case of AD, is the difference in its chemical structure from the other 7 tracers.
We also need to consider whether a given compound is a P-glycoprotein substrate. A substrate of P-glycoprotein allows active transportation of radioligand across the blood–brain barrier and thus does not fit well in Equation 2 (17). It has been reported that 11C-PIB is not a substrate of P-glycoprotein (27,28); hence, 11C-PIB can be assumed to be transported across the blood–brain barrier by passive diffusion. The amyloid radioligands we evaluated were shown not to be P-glycoprotein substrates, in that they were transported across the blood–brain barrier by passive diffusion as supported by the good correlation between predicted and clinical K1 (Fig. 3A). However, when the method is applied to other candidate radioligands, the approach by which to determine whether a compound is a P-glycoprotein substrate will be an issue.
Predicted fp, fND, and k2
fp and fND are parameters for the prediction of k2 in Equation 4. For each radioligand, fp and fND were predicted using the datasets shown in Figure 2. Even though there was inconsistent use of lipophilicity for estimation of fp and fND between our study (which used Moriguchi logP) and the studies of Wan et al. (23) and Mauer et al. (24) (which used clogP), we observed positive correlations between predicted and clinical k2 in the healthy and AD groups (R2 = 0.81 and 0.85, respectively) (Fig. 3B). This result supports the possibility that use of the Moriguchi logP without in vitro experiments for fp and fND estimation can be applied to other amyloid radioligands. There have been several studies with reported data sets for in silico logP, in vitro fp, and fND for CNS drugs or radioligands (17,23,24,29). The data sets selected for use may change the predicted fP and fND.
Predicted BPND in Amyloid Imaging
Bavail, KD, and fND are parameters for the prediction of BPND in Equation 5. Among CNS radioligands, Bavail is not so varied among subjects. However, in pathologic imaging such as amyloid PET, the Aβ burden in the brain is more than 10 times higher in AD patients than in healthy subjects. An appropriate Bavail is important in simulating progressive change in radioligand uptake. However, it is difficult to define an appropriate Bavail because of the regional and individual differences in the Bavail of Aβ plaques. It may be better to simulate a wide range of Bavail for the evaluation of radioligands in amyloid PET. Furthermore, the affinity of target radioligands for various types of Aβ plaque (diffuse, dense core, amorphous, and cerebrovascular amyloid) were not modeled in the current study. In vitro studies have demonstrated the different binding properties of each radioligand; for example, 11C-BF-227 and 18F-FACT preferentially bind to mature plaques (4,5,30). Previously reported differences in regional uptake between 18F-FACT and 11C-PIB may have been caused by differences in regional distribution between diffuse and dense-cored amyloid plaques (31). These binding properties concerning various kinds of Aβ plaque are difficult to simulate using biomathematic modeling and may be a current limitation of the method.
Using predicted fND, fixed Bavail, and in vitro KD, predicted and clinical BPND correlated positively in the AD group (R2 = 0.63) (Fig. 3C); however, this correlation was lower than that of K1 and k2. In the case of 11C-PIB, predicted BPND was 5.44 and clinical BPND was 1.51 in the AD group (Table 4) (2). It can be speculated that this discrepancy results from differences between the Bavail used in our model and that observed in clinical studies or the effect of specific binding to tau in clinical studies (32).
Furthermore, in our study, in vitro KD was obtained from published studies performed at different institutes and under different experimental conditions. We confirmed that an error in KD propagates to BPND and to the final SUVR (Supplemental Fig. 1). If the present methodology were to be applied to within-institution screening using the same experimental protocol to measure KD, the correlation between predicted and clinical BPND would improve.
Predicted Time–Activity Curves and SUVR
The proposed method has two major limitations when calculating time–activity curves: the use of a simplified model and the use of a common input function. In general, clinical time–activity curves in the target region of an amyloid PET study are expressed as a 2-tissue-compartment model, not a 1-tissue-compartment model (2,4). Therefore, the model used in our study—a simplified 1-tissue-compartment model involving only 3 kinetic parameters—may not be suitable for predicting time–activity curves in the target region. However, if a 2-tissue-compartment model were implemented for more accurate modeling, a larger number of microparameters (e.g., K1, k2, k3, and k4) would be necessary, and k4 would be too small to be predicted accurately. Therefore, we used the simplified 1-tissue-compartment model while reducing the number of parameters relative to the 2-tissue-compartment model. Furthermore, it is ideal to use the measured time-course of the radioactivity concentration in human plasma for each radioligand. We found that there were only small visual differences in plasma input functions among several studies (4,7,33–36). Therefore, we decided to use a common arterial input function of 11C-BF227 (Fig. 1B). Further studies will be required to investigate how the error source caused by the input function influences the outcome.
Despite its limitations, the method simulated a tendency toward faster clearance of 18F-FACT than of 11C-BF227 (Supplemental Fig. 2), similar to the observations of a clinical study (4). However, in the case of 11C-PIB, we observed a difference in the shape of the target region between the clinical (2) and predicted time–activity curves (Supplemental Fig. 2). The method may require further modification to generate more realistic time–activity curves. Overall, the predicted and clinical SUVRs correlated well (Fig. 4), even though there was a discrepancy in the SUVRs for 11C-PIB.
Application to Candidate Compounds
The method may be used to support screening of candidate compounds before in vivo PET studies begin. There are unmodeled factors, such as pathologic changes in K1 due to aging and disease, the effect of spill-in from nonspecific binding in white matter to the cortical regions, the possible presence of P-glycoprotein substrate, and differences in binding properties among various types of Aβ plaque. Consideration of these factors may improve accuracy, but compounding errors due to having too many factors may lead to greater complications and variations. We believe the current model considers those factors that are important in ensuring reliable prediction of the SUVRs of amyloid PET radioligands. However, to evaluate the clinical applicability of candidate compounds, we need to achieve not only a large difference in SUVRs between healthy and AD groups but also the statistical power to classify the two groups. We plan to undertake such an evaluation.
CONCLUSION
The SUVRs that the proposed biomathematic model predicted for 10 amyloid tracers correlated well with the clinical SUVRs obtained from in vivo studies. The model showed good reliability and, hence, the potential to be applied to other amyloid radioligands.
DISCLOSURE
This study was supported in part by Grants-in-Aid for Scientific Research (C) (15K08687) and Scientific Research (B) (26293133) from the Ministry of Education, Culture, Sports, Science and Technology (MEXT) of the Japanese Government. No other potential conflict of interest relevant to this article was reported.
Footnotes
↵* Contributed equally to this work.
Published online Jan. 6, 2017.
- © 2017 by the Society of Nuclear Medicine and Molecular Imaging.
REFERENCES
- Received for publication September 5, 2016.
- Accepted for publication December 7, 2016.


