


Abstract
11C-preladenant was developed as a novel PET ligand for the adenosine A2A receptors (A2ARs). The present study aimed to evaluate the suitability of 11C-preladenant PET for the quantification of striatal A2ARs and the assessment of A2AR occupancy in the conscious monkey brain. Methods: 11C-preladenant was intravenously injected into conscious monkeys (n = 4, 18 PET scans), and a 91-min dynamic scan was started. Arterial blood samples in combination with metabolite analysis were obtained during the scan to provide the input function for kinetic modeling. The distribution volume (VT) was obtained by kinetic modeling with a 2-tissue-compartment model. The simplified reference tissue model (SRTM) with selected reference regions (cerebellum, cingulate, parietal cortex, and occipital cortex) was tested to estimate the binding potential (BPND) in A2AR-rich regions. BPND obtained from the SRTM was compared with distribution volume ratio (DVR)-1. The effects of blood volume, blood delay, and scan duration on BPND and DVR-1 were investigated. VT and BPND were also obtained after preblocking with unlabeled preladenant (1 mg/kg), A2AR-selective KW-6002 (0.5–1 mg/kg), and nonselective adenosine receptor antagonist caffeine (2.5–10 mg/kg). A2AR occupancy was studied with caffeine blockade. Results: Regional uptake of 11C-preladenant was consistent with the distribution of A2ARs in the monkey brain, with the highest uptake in the putamen, followed by the caudate, and the lowest uptake in the cerebellum. Tracer kinetics were well described by the 2-tissue-compartment model with a lower constraint on k4 to stabilize fits. The highest VT was observed in A2AR-rich regions (∼5.8–7.4) and lowest value in the cerebellum (∼1.3). BPND values estimated from the SRTM with different scan durations were comparable and were in agreement with DVR-1 (∼4.3–5.3 in A2AR-rich regions). Preladenant preinjection decreased the tracer uptake in A2AR-rich regions to the level of the reference regions. Caffeine pretreatment reduced the tracer uptake in the striatum in a dose-dependent manner. Conclusion: 11C-preladenant PET is suitable for noninvasive quantification of A2ARs and assessment of A2AR occupancy in A2AR-rich regions in the monkey brain. SRTM using the cerebellum as the reference tissue is the applicable model for A2AR quantification.
The adenosine A2A receptor (A2AR) has drawn much attention in the past decades, because it has been implicated in brain disorders such as depression (1), Huntington disease (2), Alzheimer disease (3), and Parkinson disease (4). Consequently, the A2AR has been studied as a potential target for central nervous system disorders, and several A2AR antagonists were tested in clinical trials as antiparkinsonism drugs (5).
PET with a suitable A2AR radioligand provides a unique opportunity to study A2AR availability and function in vivo. This is exemplified by the in vivo imaging studies of the Parkinson brain with A2AR radioligands 11C-SCH442416 (6) and 11C-TMSX (7). In addition, A2AR availability was assessed with 11C-TMSX in secondary progressive multiple sclerosis (8). Differences were found in the striatum between the drug-naïve and levodopa-treated Parkinson patients and in normal-appearing white matter between secondary progressive multiple sclerosis patients and healthy volunteers. However, because of the unfavorable properties of the radioligands, such as low target-to-nontarget ratio and high uptake in brain regions with negligible levels of A2ARs (6,7,9), the results were difficult to interpret, and therefore the usefulness of PET imaging with A2AR radioligands is still to be proven.
We have recently synthesized 11C-preladenant (10), an A2AR antagonist with high affinity (ki = 1.1 nM for human A2AR) and selectivity toward A2AR (11). PET imaging in rats showed a high uptake of 11C-preladenant in the striatum and low uptake in extrastriatal regions, which was in agreement with cerebral A2AR distribution (10,12).
On the basis of the encouraging results from the rodent studies, here we further evaluated 11C-preladenant in conscious monkeys, as such a procedure rules out the possible effects of anesthesia on the kinetics of the tracer and A2AR ligands. We characterized the pharmacokinetic properties of the tracer with kinetic modeling. Furthermore, we studied the striatal A2AR occupancy by the nonselective adenosine receptor antagonist caffeine, the most studied A2AR antagonist. This study serves as a prelude toward first-in-human PET studies.
MATERIALS AND METHODS
Synthesis of 11C-Preladenant
11C-preladenant was prepared according to the procedure described by Zhou et al. (10) with some modifications. The final product was obtained in a practical yield of 2.78 ± 1.32 GBq, with a radiochemical purity of 98.2% ± 1.5% and a specific activity of 28.1 ± 10.9 GBq/μmol at the time of injection.
Animals
Animals were maintained and handled in accordance with the recommendations of the U.S. National Institutes of Health and the guidelines of the Central Research Laboratory, Hamamatsu Photonics. All experiments were approved by the Ethical Committee of the Central Research Laboratory, Hamamatsu Photonics (HPK-2014-12). Four young male rhesus monkeys (Macaca mulatta, 5.0–8.5 kg) were used for the PET measurements (baseline, n = 7; pretreatment with caffeine [Sigma], n = 3; pretreatment with 1 mg/kg preladenant [Chemscene, LLC], n = 3; pretreatment with 0.5 mg/kg KW-6002 [Axon Medchem BV], n = 4 [2 without blood sampling]; pretreatment with 1 mg/kg KW-6002, n = 1) in a conscious state. Each blocker was intravenously injected 30 min before injection of 11C-preladenant. T1-weighted MR images of the monkeys were obtained with a 3.0-T MR imager (Signa sExcite HDxt 3.0 T; GE Healthcare Japan). MR images were reconstructed into a 256 × 256 × 178 matrix, with a voxel size of 0.4 × 0.4 × 0.7 mm.
PET Measurements
After overnight fasting, a venous cannula for PET ligand or blocker injection was inserted in one inferior limb and an arterial cannula for blood sampling was inserted in the other inferior limb. The PET scan was obtained using an animal PET scanner (SHR-7700; Hamamatsu Photonics) (13). After a transmission scan using a [68Ge]-[68Ga] rotation rod source, a 91-min dynamic acquisition was started at the time of 11C-preladenant (∼1 GBq) injection. Arterial blood samples were obtained manually over the acquisition. Blood and plasma were separated by centrifugation. The radioactivity in blood and plasma samples was measured using a well-counter (1480 WIZARD; Perkin Elmer). The percentage of radioactivity consisting of intact tracer in plasma was determined by radio–thin-layer chromatography with a mobile phase of chloroform/methanol (9/1, v/v).
PET Data Analysis
Dynamic PET data were histogrammed into 49 frames (6 × 10, 6 × 30, 12 × 60, and 25 × 180 s). The frames were reconstructed by filtered backprojection with a Hanning filter of 4.5 mm in full width at half maximum and corrected for attenuation, scatter, and random coincidences. All images contained 100 × 100 × 20 voxels with a voxel size of 1.2 × 1.2 × 3.6 mm. Individual PET and MR images were coregistered. Volumes of interest were drawn manually on the individual MR images, using regional information from BrainMaps.org (14) as an anatomic reference. MR image–derived volumes of interest were superimposed on the coregistered PET images to extract time–activity curves for kinetic analysis. Time–activity curves were normalized to body weight and injected activity to yield SUVs.
Tracer Kinetic Modeling
Tracer kinetics were quantified with PMOD software (version 3.5; PMOD Technologies). The fractional blood volume (VB) in the brain was either fixed to 0%, 3%, or 5% or used as a fit parameter to assess the effect of blood volume on kinetic parameters. The blood delay was either fixed to 0 or used as a fit parameter. In addition, to stabilize kinetic model fits we explored both fitting or fixing k4 for several reference regions (i.e., regions showing no or minimal specific binding). In the case of fixing, k4 was set to 0, 0.005, 0.011, 0.02, or 0.04 min−1.
A monoexponential function was fitted to the intact tracer fraction over time. A standard 2-parameter (K1, k2) 1-TCM (1-tissue-compartment model) and a 4-parameter (K1, K1/k2, k3, k4) 2-TCM (2-tissue-compartment model) with and without VB using a metabolite-corrected plasma input function were used to fit time–activity curves. The effects of variation in VB, blood delay, reference region, k4, and scan duration on model fits were judged by Akaike information criterion (AIC) and by the observed kinetic parameters (i.e., VT, nondisplaceable distribution volume [VND], DVR-1, and BPND). BPND in the striatum was obtained by  (15) as well as SRTM (Supplemental Fig. 1; supplemental materials are available at http://jnm.snmjournals.org). The invasive- and noninvasive model–derived BPND values were compared, using DVR-1 with a full scan length of 91 min as the gold standard. The cerebellum, cingulate, parietal cortex, and occipital cortex were tested as reference regions. The striatum was used as the target region in all data analyses. The test–retest variability (TRV) was compared between models and reference regions. TRV was calculated as
  or
or  .
.
A2AR Occupancy by Caffeine
Three PET scans after administration of 2.5, 5, and 10 mg/kg of caffeine were obtained as described above, whereas blood sampling was acquired only for the caffeine dose of 2.5 mg/kg because of logistical reasons. Receptor occupancy was calculated from SRTM-derived BPND as  , where the BPND, baseline was obtained by averaging test and retest BPND at baseline of individual animals.
Statistics
The Wilcoxon signed-rank test was used to assess the difference in plasma activity and intact tracer fraction between baseline and A2AR-blocker pretreatment, the effects of A2AR-blocker pretreatment on VT, and the difference in AIC between 1-TCM and 2-TCM. A Bland–Altman plot (difference [Δ] vs. mean) was used to judge the agreement between BPND and DVR-1. Δ (%) was computed as  . A probability value of P less than 0.05 was considered to be statistically significant.
RESULTS
Kinetics of 11C-Preladenant in Plasma
Figure 1 shows the plasma kinetics and metabolic radioactivity profile of 11C-preladenant during the 91-min scan. KW-6002 and preladenant pretreatment did not significantly alter tracer metabolic rate (Fig. 1B) but caused significantly higher (P < 0.05) plasma radioactive levels between 24 and 40 s after injection than at baseline (Fig. 1A). The tracer metabolic pattern could be fitted with a monoexponential function with 32% ± 7% of radioactivity in plasma consisting of intact tracer at 90 min after injection. The metabolite-corrected plasma curve at baseline was well described with a biexponential function, with a distributive half-life of 0.15 ± 0.03 min and an elimination half-life of 6.86 ± 2.19 min.

Kinetics of 11C-preladenant in monkey plasma. (A) Time course of total activity in plasma at baseline and after blocker pretreatment. Insert shows first 3 min of plasma kinetics. (B) Parent fraction in plasma at baseline and after blocker pretreatment. Error bars indicate SD. *P < 0.05.
Tracer Kinetic Modeling
The 2-TCM fitted the data better than the 1-TCM, with significantly (P < 0.001) lower (∼2%–19%) AIC values for all volumes of interest and visually better agreement between the fitted curves and the experimental data (for clarity, only 2-TCM fits are shown in Fig. 2A). Therefore, the 2-TCM was used to quantify tracer kinetics. Variation in the VB, blood delay, and k4 value in reference regions did not substantially affect AIC values, because only a 0%–9% difference was found between various fits. Still, best fits (smaller AIC) were obtained when VB was either fixed to 5% or included as a fit parameter, blood delay was included as a fit parameter, and the reference region k4 was either fixed to 0.011 min−1 or included as a fit parameter.
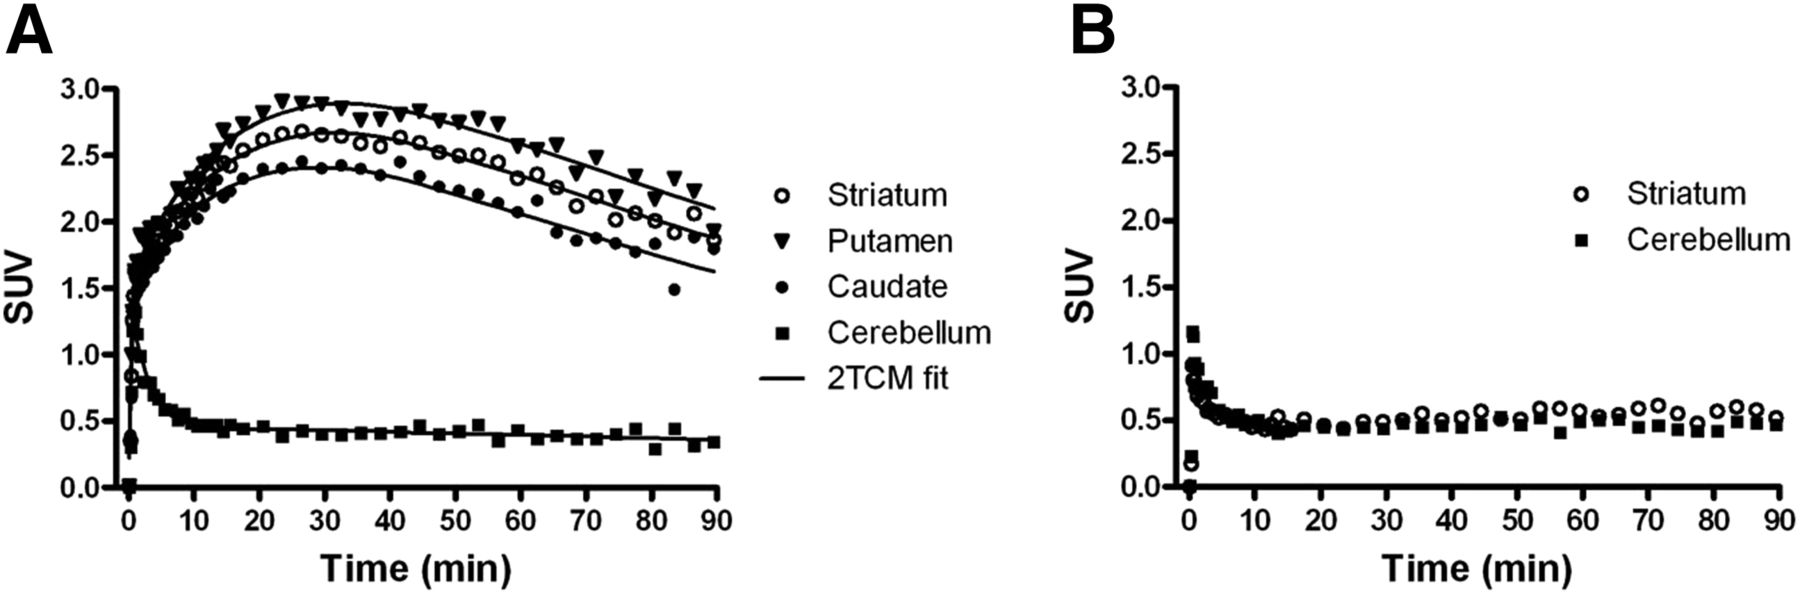
(A) Representative time–activity curves and 2-TCM fits of striatum, putamen, caudate, and cerebellum at baseline. (B) Time–activity curves of striatum and cerebellum after preladenant (1 mg/kg) pretreatment.
The VND was estimated from the VT of a reference region (i.e., cerebellum) at baseline and a target region (i.e., striatum) with A2AR binding sites completely blocked with preladenant. The effect of different VB and k4 values on estimated VND was analyzed. The VB had little effect on either VND or VT because a less than 10% difference was found with various VB values. The effect of k4 on VND is shown in Figure 3. The range of fit values for k4 was chosen on the basis of an average cerebellar k4 value of 0.011 min−1 (17% coefficient of variation [COV]) estimated by 2-TCM from 5 of 7 baseline scans. The excluded 2 cases provided low estimates on k4 (0.0031 and 0.0056 min−1), resulting in upward-biased VND values of 3.1 and 2.6, respectively, which were considered outliers (Supplemental Fig. 2). Indeed, when k4 was small (0.005 min−1) or without constraint, VND seemed to be overestimated in 1 or 2 cases at baseline. 2-TCM with k4 between 0.011 and 0.04 min−1 estimated VND values within an acceptable range (i.e., 0 < VND < 2), whereas larger fixed k4 values resulted in a somewhat lower VND with smaller variability (k4 = 0.011 min−1, VND = 1.2, 22% COV; k4 = 0.04 min−1, VND = 0.9, 17% COV) (Fig. 3).
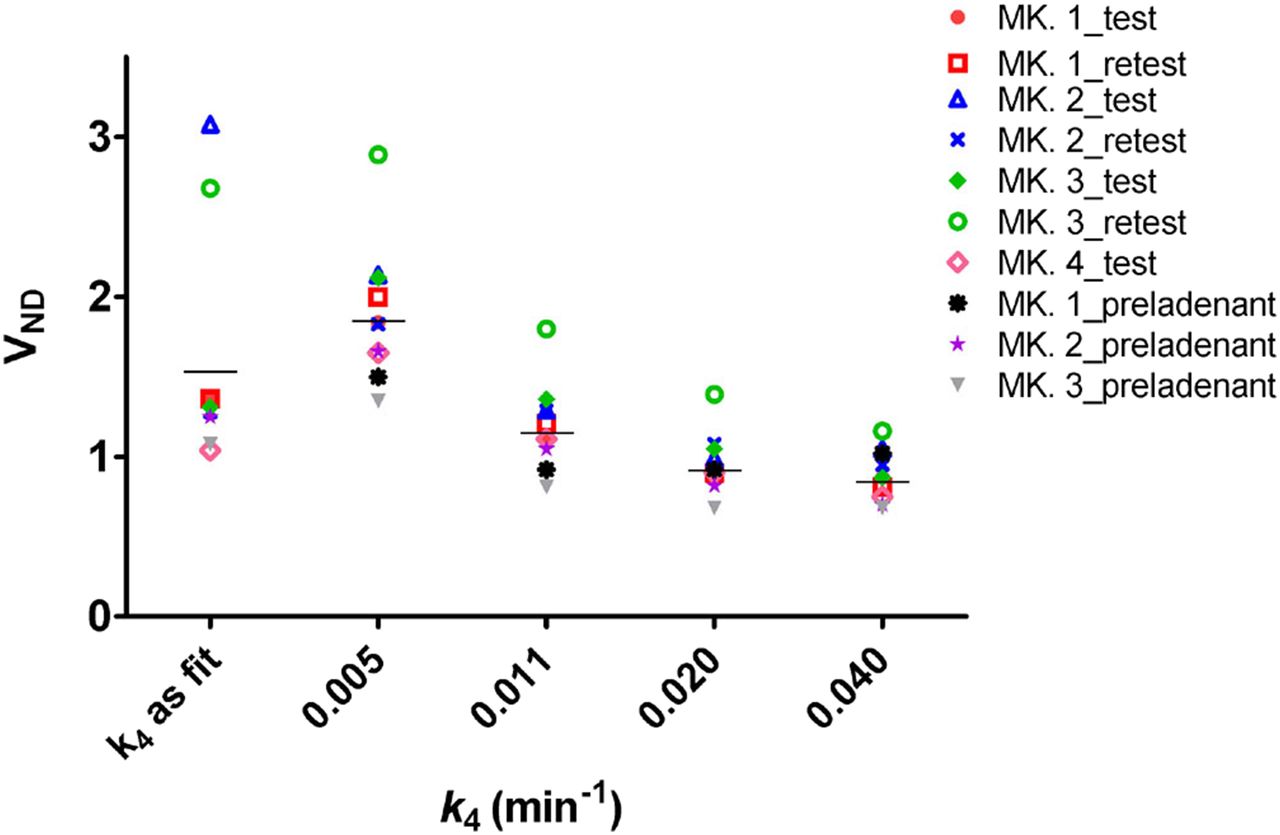
Effect of k4 on VND. VND was obtained as VT in cerebellum from 7 baseline scans and as VT in striatum from 3 scans with preladenant preblocking. Horizontal lines represent mean of 10 scans. MK = monkey.
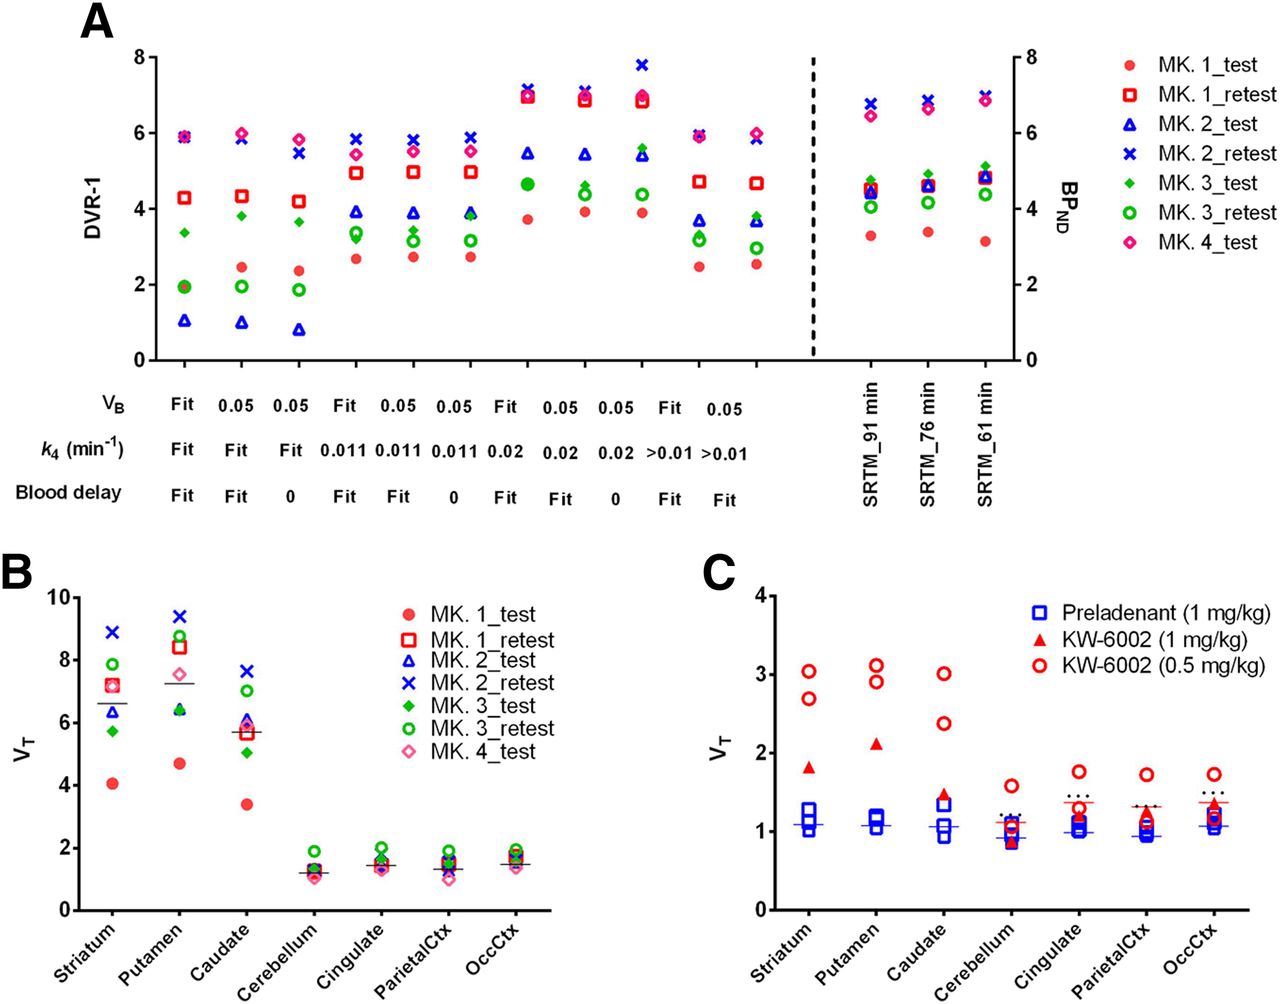
Next, we compared the impact of 2-TCM parameters, such as VB (fixing to 5% or as a fit parameter), blood delay (no delay or as a fit parameter), and k4 constraints (k4 = 0.011 and 0.02 min−1, k4 ≥ 0.01 min−1, or as a fit parameter), on striatal specific binding values using DVR-1 derived from VT, striatum/VND, cerebellum-1 (Fig. 4A). The results show that the data points were more scattered with unconstrained k4, whereas a lower degree of dispersion was observed when k4 ≥ 0.01 min−1. As k4 negatively correlated to VND (Fig. 3), DVR-1 calculated with k4 fixed to 0.02 min−1 was approximately 35% larger than DVR-1 calculated with k4 fixed to 0.011 min−1 (k4 = 0.02 min−1 5.7 ± 1.4 vs. k4 = 0.011 min−1 4.2 ± 1.2). Other factors such as blood delay and VB showed a small impact on DVR-1 estimates (Fig. 4A). Therefore, VT and VND at baseline and under receptor saturation conditions were estimated by fitting VB and blood delay to allow for variation in delay and VB between animals and experiments, but with k4 being constrained ≥ 0.01 min−1 to stabilize the fits. The results are presented in Figures 4B and 4C. VT values were 5.8–7.4 in A2AR-rich regions and 1.3–1.6 in reference regions at baseline.

(A) Effect of blood volume, blood delay, and cerebellar k4 on DVR-1 and a comparison in BPND between SRTM with different scan durations. Values were obtained using cerebellum as reference region. (B) VT in striatum and reference regions at baseline. Horizontal lines represent mean of 7 baseline scans. (C) VT in striatum and reference regions after blocker pretreatment. Solid horizontal lines represent mean of 3 preladenant preblocking scans (blue) and 3 KW-6002 preblocking scans (red, reference regions only). Dotted horizontal lines represent mean of 7 baseline scans (reference regions only). MK = monkey; OccCtx = occipital cortex; ParietalCtx = parietal cortex.
Preladenant pretreatment significantly (P < 0.001) reduced the VT in A2AR-rich regions to about 1.1, which was comparable with VT in reference regions (∼1.0). However, the pretreatment with blockers also reduced the VT in reference regions by 27%–33% (Fig. 4C), albeit the difference did not reach statistical significance. Because of the animal welfare issues, KW-6002 pretreatment was unable to achieve complete A2AR blockade (Fig. 4C). A dose of intravenous KW-6002 (1 mg/kg) resulted in adverse effects, and therefore higher doses were not tested. In addition to the cerebellum, we evaluated the cingulate, occipital cortex, and parietal cortex as reference regions to predict striatal BPND, because VT values in these regions are comparatively low and stable (Fig. 4B).
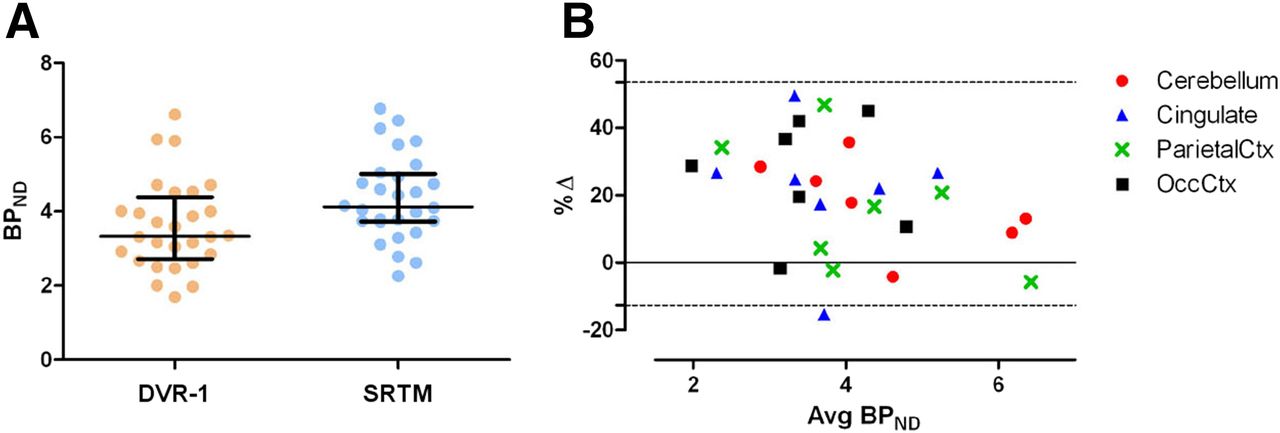
BPND values obtained from the noninvasive SRTM with various reference regions as input were in agreement with DVR-1 in general (Figs. 4A and 5), with a positive bias of 20% ± 17% when k4 was constrained to above 0.01 min−1. Models with the cerebellum as the reference region displayed the highest BPND in A2AR-rich regions, being approximately 5.3 (23% COV) in the putamen and 4.3 (25% COV) in the caudate. In comparison with the cerebellum, the parietal cortex as the reference region estimated slightly lower (8%) BPND with comparable variability (0%–1% difference, depending on brain regions) but higher test–retest reproducibility, showing a TRV value of 22% whereas 29% was calculated using the cerebellum as the reference region. Other reference regions estimated low BPND values with low test–retest reproducibility; therefore, these regions are less optimal reference regions to quantify tracer kinetics in the striatum. The between-subject variability for VT and BPND was comparable (11%–30% COV). TRV was larger for VT and DVR-1 calculated with the 2-TCM, 31%–43%, in comparison with 22%–29% TRV for BPND determined with the SRTM. Preladenant preinjection (1 mg/kg) reduced the BPND values in target regions to about 0, indicating a complete blockade. Pretreatment with KW-6002 resulted in decreased tracer uptake in the striatum in all cases, with BPND values of 1.0 at 1 mg/kg (n = 1) and 2.0 ± 0.7 at 0.5 mg/kg (n = 3). In 1 case, no effect of 0.5 mg/kg of KW-6002 was observed, because the BPND in this animal was 7.4.

(A) Striatal BPND estimates from DVR-1 (2-TCM) and SRTM, using cerebellum, cingulate, parietal cortex, and occipital cortex as reference regions. Values were obtained from 7 baseline scans. Horizontal lines represent median with interquartile range. (B) Same datasets as in A but presented as Bland–Altman plot of difference (Δ) between BPND and DVR-1 against means of BPND and DVR-1. Area between dotted lines represents 95% confidence interval.  . Avg = average; OccCtx = occipital cortex; ParietalCtx = parietal cortex.
Furthermore, we investigated whether BPND was still robust with 61-min analysis by correlating DVR-1 and BPND obtained from 91-min scans with BPND obtained from the first 61-min analysis of the same scans (Fig. 6). Despite the positive bias of BPND related to DVR-1, a good correlation was found between the parameters, with a root mean square error value of 0.49 measured between data points and the line of Deming regression, which is about 69% of the smallest value (BPND = 0.70) and 6.8% of the largest value (BPND = 7.1). Moreover, there was no difference in BPND estimation between 91- and 61-min analysis, because the linear regression line (slope = 1.0, y-intercept = 0.17) was almost identical to the line of identity.

(A) Deming linear regression of BPND on DVR-1. (B) Deming linear regression of BPND obtained from 91- and 61-min analysis. BPND and DVR-1 were derived by reference to cerebellum.
A2AR Occupancy by Caffeine
Caffeine pretreatment reduced tracer uptake in A2AR-rich regions in a dose-dependent manner (Fig. 7). Sixty-one- and 91-min analysis estimated comparable A2AR occupancy, with a maximum difference of 1%, when the values were derived from BPND with the cerebellum as reference region. The BPND and A2AR occupancy in the striatum after intravenous injection of 2.5, 5.0, and 10.0 mg/kg of caffeine were approximately 2.3, 1.5, and 0.8 and 64%, 74%, 81%, respectively. The parietal cortex as the reference region failed to estimate striatal BPND at the dose of 2.5 mg/kg.

PET images of transverse view of monkey brain over 91-min scan (A) and corresponding time–activity curves in striatum (B) at baseline (open circle) and after intravenous injection of caffeine at 2.5 (triangle), 5.0 (cross), and 10.0 (closed circle) mg/kg (BPND of 6.9, 2.3, 1.5, and 0.8, respectively). Table shows estimated A2AR occupancy (%) in A2AR-rich regions at corresponding caffeine doses based on 91- and 61-min analysis. BPND for occupancy calculation was obtained from SRTM with cerebellum as reference region.  .
.
DISCUSSION
We report the quantification of 11C-preladenant uptake for the imaging of A2ARs in the conscious monkey brain. The tracer displayed a regional uptake that is in agreement with the known distribution of the receptor in the brain, with highest uptake in the putamen and caudate and lowest uptake in the cerebellum.
The tracer kinetics can be quantified with the 2-TCM in all brain regions. Regions devoid of receptor expression might be better fitted with 2-TCM than 1-TCM, because a small third (nonselective/metabolic) tissue compartment might exist in the brain, which is overwhelmed by the specific compartment in receptor-rich regions but not in receptor-poor regions. When the specific binding sites are blocked (Fig. 2B) or in regions without receptor expression, the specific binding compartment disappears and the influence of this small third tissue compartment on tracer kinetics emerges. The presence of a small (and slow) third tissue compartment resulted in difficulty in estimating k4 in reference regions. In reference regions, the slow third tissue compartment caused time–activity curves to level off at later times, leading to very small k4 values. Consequently, a 91-min acquisition might not be adequate and thus a longer scan might be necessary to have a better estimate of k4 in reference regions. In our study, cerebellar k4 could not be properly estimated in 2 of 7 baseline scans and in 1 scan with complete receptor blockade. Because the accuracy in VND estimate is essential to determine how much activity in VT is due to specific binding, and VND appeared sensitive to k4, we have studied the effect of fixing or constraining k4 on VND in both the cerebellum and the striatum with complete receptor blockade. We found that a small k4 resulted in high VND values. Therefore, we recommend using the plasma input 2-TCM with k4 constrained above 0.01 min−1, resulting in more comparable VND estimates across studies (Fig. 3).
With VND stabilized by restraining k4, we further estimated the specific binding in target regions using DVR-1 and examined the agreement between DVR-1 and BPND obtained from the SRTM (Fig. 4A). The 2 measures correlated well with each other, with an average bias of +20% for BPND. However, BPND is favorable to DVR-1 in terms of smaller dispersion and TRV. Next, we investigated whether BPND was still robust with a 61-min acquisition. An excellent agreement was found in BPND between 61- and 91-min analysis. A good positive correlation was also observed between 61-min BPND and 91-min DVR-1 (Fig. 6), although the correlation became worse at small BPND (i.e., BPND ≤ 1.5 [Fig. 6A]), because both methods lose the robustness of measuring specific binding in regions lacking specific binding sites. Taken together, our findings suggest that striatal BPND can be reliably quantified with a 61-min dynamic PET acquisition. A 61-min scan protocol was also adequate to study the A2AR occupancy by caffeine, because a high degree of consistency was observed across 61- and 91-min analysis (Fig. 7).
Pretreatment with a blocker decreased the VT values in the reference regions by approximately 30% (Fig. 4C, for clarity, caffeine data are not presented). A reduction in VT in reference regions after blocker treatment was also found with 18F-labeled preladenant (18F-MNI-444) in a monkey study (16) but not in a rat study with 11C-preladenant (17). In another rat study with 11C-SCH442416 PET, using percentage injected dose per gram as the outcome parameter, tracer uptake in the cerebellum and cortex was also reduced after KW-6002 treatment (18). Some of the results may indicate the existence of specific binding to A2AR in reference regions (e.g., cerebellum). However, considering the low density of A2AR in extrastriatal regions (<10% density of A2AR in the striatum) (19) and the limited sensitivity of available PET tracers for A2AR (BPND < 10 in target regions), it is unlikely that these tracers are able to pick up the signal due to specific binding from the noise (background) in extrastriatal regions. We have observed a higher plasma parent activity concentration after pretreatment with a blocker than at baseline. Although the difference was not statistically significant, this might still contribute to a decrease in VT in blocking experiments because the time–activity curves in reference regions at baseline and in blocking studies are similar. Moreover, the presence of the blocking agents might also influence the plasma free fraction, which is positively correlated to VND and VT (15). The decrease in VT in reference regions after blocker treatment might cause a bias in BPND calculations in receptor occupancy studies if such a decrease is mainly due to blocking of specific signal in these regions. Further studies are needed to find out whether such effect is species-specific and whether the reduction in VT is actually significant (it is not significant in our case). Among all investigated reference regions, the cerebellum is favored over others in terms of low VT and robustness of BPND estimation.
A potential pitfall in our study might be the nonnegligible impact of injected mass of preladenant on BPND and VT, because a mass-dependent decrease in BPND was observed at baseline (Supplemental Fig. 3), due to variable specific activity of the tracer. Differences in specific activity between test and retest scans could account for the relatively high TRV (22%–29%) in this study, in comparison with our rat study (TRV, 6%), in which A2AR occupancy was always <5% due to coadministered preladenant with 11C-preladenant (17). The masses of preladenant (3–10 nmol/kg) injected in this study could result in approximately 15%–30% of A2AR occupancy (16). When the true BPND at baseline was obtained by correcting the apparent BPND at baseline with 15%–30% self-occupancy by unlabeled preladenant, the TRV in BPND decreased to 14%–22% (Supplemental Fig. 4). Furthermore, the A2AR occupancy at caffeine doses of 2.5, 5, and 10 mg/kg became 70%, 72%, and 81%, respectively, after correction for self-occupancy (16,20). Regardless of possible nonnegligible receptor occupancy by preladenant, our study demonstrated that 11C-preladenant has suitable binding properties and pharmacokinetic profile, which warrants its translation to human studies. In human studies, issues regarding the injected mass dose of the tracer are less likely to occur, because humans have a 10- to 15-fold-higher body weight than the monkeys in this study and modern clinical PET cameras require a 2- to 3-fold-lower injected 11C-preladenant dose for proper counting statistics than the animal scanner applied here.
CONCLUSION
11C-preladenant showed a regional uptake in the conscious monkey brain that is in accordance with the known A2AR distribution, with high uptake in the striatum and low uptake in the cerebellum. The tracer kinetics in the striatum can be well described with the 2-TCM and SRTM. A 61-min dynamic acquisition is sufficient for adequate assessment of BPND, whereas a scan duration of more than 91 min might be necessary to have a robust estimation on k4 in reference regions. Pretreatment with caffeine reduced the tracer uptake in A2AR-rich regions in a dose-dependent manner, indicating that 11C-preladenant PET is suitable to study A2AR occupancy with A2AR-targeting molecules.
DISCLOSURE
No potential conflict of interest relevant to this article was reported.
Acknowledgments
We thank Michel Koole for suggestions on experimental design.
Footnotes
Published online Jan. 6, 2017.
- © 2017 by the Society of Nuclear Medicine and Molecular Imaging.
REFERENCES
- Received for publication August 10, 2016.
- Accepted for publication November 10, 2016.


