


Abstract
The aim of our study was to evaluate the effect of stepwise-reduced doses on objective and subjective image parameters and on oncologic readings in whole-body 18F-FDG PET/MRI. Methods: We retrospectively simulated the stepwise reduction of 18F-FDG doses of 19 patients (mean age ± SD, 50.9 ± 11.7 y; mean body mass index ± SD, 22.8 ± 3.2 kg/m2) who received a whole-body PET/MRI examination from 3 to 0.5 MBq/kg of body weight (kgBW) in intervals of 0.25. Objective imaging parameters were assessed by measuring the SUV and coefficient of variation in different regions (aorta, liver, spleen, kidney, small bowel, lumbar vertebra, psoas muscle, urinary bladder) as well as the noise-equivalent counting rates in each bed position. Subjective image quality was evaluated with a masked reading of each simulated PET compared with the dose of 2 MBq/kgBW. Oncologic reading was performed first according to PERCIST in each dose and second by defining malignant lesions in doses of 2 MBq/kgBW and the maximum dose image (gold standard). The diagnostic confidence of each lesion was measured using a Likert scale. Results: With decreasing doses, regions in the mid abdomen showed a stronger decrease of SUVmean and noise-equivalent counting rates than regions in the upper abdomen (SUVmean, −45% and −15% on average in the small bowel and the liver, respectively). The coefficient of variation showed a nonlinear increase, pronounced below 1.5 MBq/kgBW. Subjective image quality was stable over a range between 1.25 and 2.75 MBq/kgBW compared with 2 MBq/kgBW. However, large photopenic areas in the mid abdomen were observed in 2 patients. In the PERCIST reading, target lesions were above the liver threshold with a stable SUVpeak in all cases down to 2 MBq/kgBW. Eighty-six of 90 lesions were identified correctly with a dose of 2 MBq/kgBW; Likert scores did not differ significantly. Conclusion: A reduction of doses in 18F-FDG PET/MRI might be possible down to 2 MBq/kgBW in oncologic whole-body examinations. The image quality in the mid abdomen seems to be more affected by lower doses than in the upper abdomen, and in single cases large photopenic areas can occur. Therefore, we do not recommend reducing doses below 3 MBq/kgBW in adults at this time.
PET provides information about tissue properties regarding, for example, metabolism or surface receptors, on a molecular level. The possibility of implementing PET into hybrid imaging by combination with CT (PET/CT) or MRI (PET/MRI) in 1 single scanner facilitates the anatomic correlation of PET data and has led to an increasing acceptance in daily clinical routine. 18F-labeled FDG is the most widely used tracer in whole-body oncology, because it is able to detect an increased consumption of glucose, which is a characteristic of many tumor types (1). Therefore, PET with 18F-FDG plays a pivotal role in several oncologic diseases such as lung cancer or lymphoma (2–5). In oncology, PET is of increasing importance not only for the initial staging of patients but also in therapy monitoring or the evaluation of tumor recurrence (6,7). According to the RECIST for oncologic trials in radiology, Wahl et al. introduced a model to standardize oncologic reading of PET in clinical trials: PERCIST (8). With the increasing use of PET in oncologic imaging and therefore in repetitive follow-up examinations, radiation exposure increases for patients on the one hand, but also for technologists and physicians on the other hand (9). Today’s guidelines for tracer doses in PET are mostly based on phantom studies, theoretic model calculations, or retrospective evaluations of examinations of different patient populations (10–15). Because of the high sensitivity of PET detectors in current PET/MRI scanners (16,17) and commonly longer PET acquisition times than PET/CT acquisition times (18,19), a reduction of PET tracer doses might be feasible for PET/MRI examinations. However, an intraindividual analysis of the influence of different tracer doses on image quality is ethically not feasible in a prospective study setting. Recently, Gatidis et al. proposed a new approach to simulate PET tracer dose reduction of whole-body examinations by a randomized undersampling of PET list-mode data (20). Thus, it is possible to retrospectively simulate PET examinations of several lower doses of 1 patient by randomly deleting proportions of PET events over the acquisition time. In a recently published study, Schaefferkoetter et al. investigated the influence of a simulated reduction of 18F-FDG doses on image characteristics in the lung and found that even a low-dose PET of 18.5 MBq might be sufficient for lung cancer screening (21).
The aim of our study was to evaluate the effects of dose reduction in 18F-FDG PET on objective and subjective imaging parameters and the influence on oncologic reading in whole-body examinations using stepwise-simulated reduced tracer doses.
MATERIALS AND METHODS
Patients
From October 2012 to July 2014, we retrospectively evaluated all patients who were examined in a fully integrated simultaneous PET/MRI scanner (Biograph mMR; Siemens Healthineers) in a clinical setting. Inclusion criteria were a torso 18F-FDG PET scan of adults (>18 y), an injected tracer dose of at least 3 MBq/kg of body weight (kgBW), and an acquisition time per bed of at least 4 min. Written informed consent concerning the examination and scientific evaluation of their data was given by all patients.
Hybrid Examinations
Before being injected with 18F-FDG, all patients fasted at least 6 h. Between the tracer injection and the examination, patients rested on a patient couch. Acquisition time per bed position was 4–6 min. All PET data were stored in list-mode. A 3-dimensional (3D) T1-weighted spoiled gradient-echo sequence in end-expiratory breath-hold with Dixon-based fat-water separation (for vendor-provided PET attenuation correction) and a coronal T2-weighted short-time inversion-recovery sequence were acquired simultaneously with PET. Other MR sequences were chosen according to the disease and clinical question. If the acquisition time per bed position exceeded 4 min, the PET data were shortened to 4 min per bed position by excluding the counts acquired in the excessive minutes. The simulation of doses was performed by a retrospective randomized undersampling of list-mode data as described by Gatidis et al. (20). Here, a predefined proportion of PET events are randomly deleted in the PET list-mode data. These undersampled datasets can be reconstructed as simulated low-dose PET images. Using this method, we calculated PET images of the following doses of each patient (MBq/kgBW): 3.0, 2.75, 2.5, 2.25, 2.0, 1.75, 1.5, 1.25, 1.0, 0.75, and 0.5. All PET data were acquired in 3D mode and reconstructed using the vendor-provided e7-tools software package (Siemens Healthineers) with after parameters: 3D ordered-subset expectation maximization algorithm, 21 subsets, 2 iterations, 256 × 256 matrix size, 2.8 × 2.8 × 2 mm voxel size, and 4 mm gaussian filter. The results were controlled visually.
Quantitative Assessment of PET Image Quality
To assess the reliability of the evaluation of tracer uptake and to give an impression of the image noise in different doses, we acquired the SUVmean (corrected by body weight) and the coefficient of variation (CV) in physiologic organs. The estimated trues, prompts, noise-equivalent counting rates (NECRs), and total scatter fraction (SF) demonstrate the effects of dose modulations on technical scan parameters in different body regions.
In the PET images reconstructed with the original dose fused with the corresponding short-time inversion-recovery sequence, 2-dimensional circular regions of interest with a target diameter of 1 cm were set in the spleen, descending aorta, renal pelvis, psoas muscle, urinary bladder, and small bowel in the middle abdomen in the axial plane; and in the fourth lumbar vertebra in the coronal plane. Moreover, the 3D spheric volume of interest of 3-cm diameter was set in the right liver lobe as proposed by Wahl et al. for PERCIST evaluations (8). Care was taken to avoid organ borders, and only organs without PET-positive lesions were included. Those regions or volumes of interest were copied to all PET images at various dose simulations of the respective patient to measure the SUVmean and the SD. These steps were performed using PMod (PMOD Technologies Ltd.) and MATLAB (The MathWorks Inc.). The CV within a region of interest was defined as SD/SUVmean.
Depending on the covered body region, the bed positions of an examination were classified in the following categories: head/neck, thorax/neck, upper abdomen/lower thorax, abdomen/pelvis, and pelvis/upper thighs (Fig. 1). The estimated trues, prompts, NECR, and SF of each bed position were extracted from the PET data header.
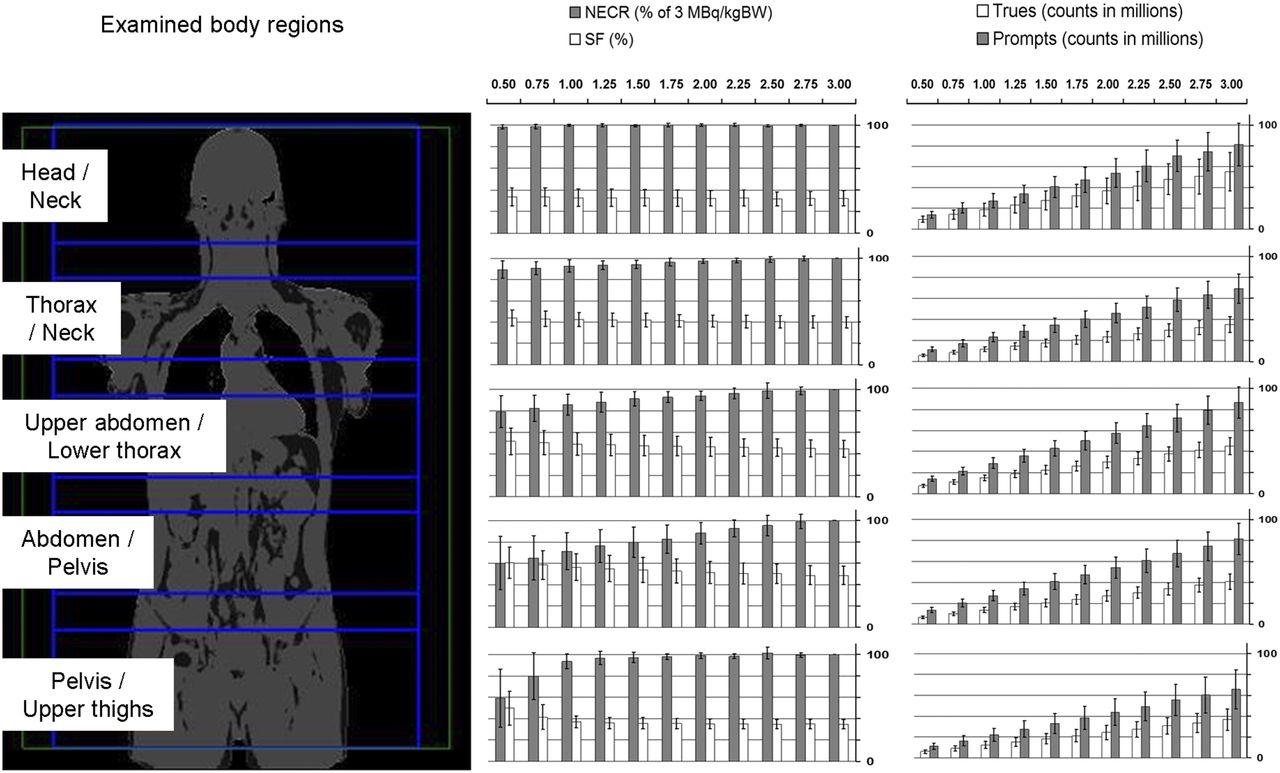
Overview of NECR in percentage compared with 3 MBq/kgBW, estimated SF in percentage, trues, and prompts in each examined body region. Error bars represent SD. Note different levels of SF and strong dependence of NECR and SF on reduction of doses in abdominal/pelvic region.
Oncologic Readings
All examinations were evaluated in a clinical setting in a consensus reading by a radiologist and a nuclear medicine physician, each with more than 8 y of experience in hybrid imaging. In this reading, all malignant lesions in various oncologic diseases were defined. All examinations with PET-positive malignant findings were included in the oncologic readings.
We performed 2 different oncologic readings: first, according to PERCIST, to demonstrate the effects of dose reduction on clinical oncologic trials (PERCIST); and second, in a nuclear medicine physician reading procedure to represent the effects of a dose reduction down to 2 MBq/kgBW on oncologic readings in daily clinical routine compared with the full-dose PET images (lesion detection).
PERCIST
We calculated a liver threshold according to PERCIST with the 3D spheric volume of interest in the right liver lobe in all simulated PET images of a patient as follows: 1.5 × SUVmean + 2 × SD. According to PERCIST, a maximum of 5 malignant lesions with the highest SUVpeak was defined as target lesions (maximum, 2 per organ) in PET images with doses of 3 MBq/kgBW. A 3D spheric volume of interest was drawn covering the whole lesion to assess the SUVmax, the SUVpeak, and the metabolic volume (MTV) of each lesion in each PET image. The SUVpeak was defined by Wahl et al. (8) as the largest possible mean of value of a 1 cm3 spheric volume of interest positioned within a tumor. The MTV was defined as a volume within a 40% threshold of the SUVmax. These steps were performed with the software MMOncology (syngo.via, Siemens Healthineers).
Lesion Detection
In a second oncologic reading, a nuclear medicine physician with 5 y of experience in PET imaging evaluated the examinations with a simulated dose of 2 MBq/kgBW and the full-dose PET image (gold standard) of each oncologic patient to define malignant lesions. As a first benchmark, 2 MBq/kgBW was chosen, based on the observations of the image parameters (relatively stable behavior of SUV, CV, and NECR; Figs. 1 and 2) and the results from the first oncologic reading (no lesion with SUVpeak below this threshold). The reader was masked for the respective dose and waited at least 6 wk between the readings of the different datasets. A lesion was defined as a focal excess of tracer uptake compared with the surrounding regional uptake. A maximum of 10 lesions per organ was evaluated. For each lesion, the diagnostic confidence was rated using a Likert scale: 1, highly suggestive of a malignant lesion; 2 = suggestive of a malignant lesion; 3, probably a malignant lesion; and 4, possibly a malignant lesion.
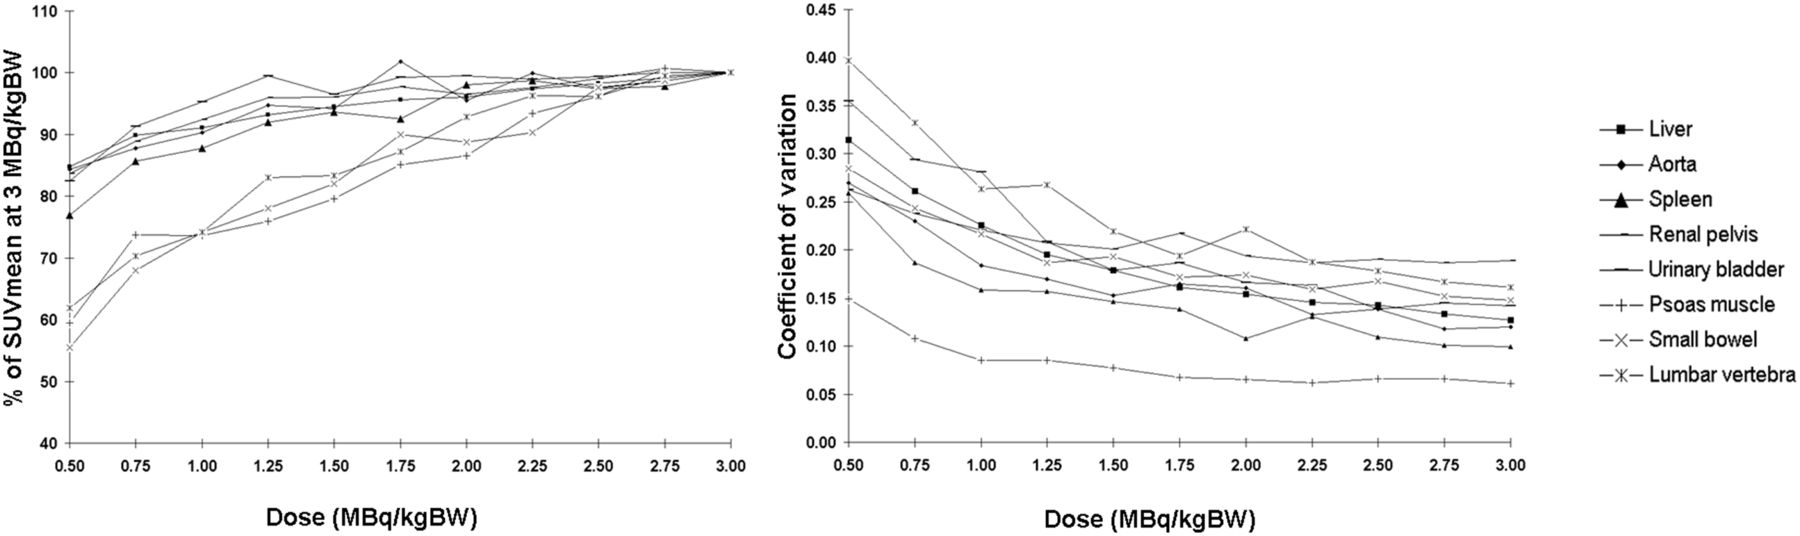
Means of SUV and CV in organs compared with 3 MBq/kgBW. Regions of interest located in abdominal region with low tracer uptake such as psoas muscle, small bowel, or lumbar vertebra showed stronger relative decrease of SUVmean compared with other regions. Pronounced increase of CV in doses below 1.5 MBq/kgBW was observed. Power-law-fit of CV revealed R2 > 0.96 except for aorta, spleen, pelvis, and muscle (R2 > 0.91).
Subjective Image Evaluation
We assessed the subjective image impression to demonstrate the effects of dose reduction on the overall confidence of a nuclear medicine physician reading PET images of lower doses. For this purpose, the nuclear medicine physician compared all reconstructed doses of a patient with the simulated PET of 2 MBq/kgBW in a masked randomized setting with an in-house–written MATLAB reading software (https://sites.google.com/site/kspaceastronauts/blindfold) in the following manner: 2 PET images of a randomly picked patient were simultaneously presented on a screen, side by side. One PET image was reconstructed from the 2 MBq/kgBW dose and was always presented randomly on the right or left side. We chose 2 MBq/kgBW instead of 3 MBq/kgBW to prevent a selection bias for the higher dose. The other PET image was of a randomly picked dose (higher or lower). The reader always rated the image on the left-hand side in comparison to the image on the right-hand side as of (+) better image quality, (=) comparable image quality, or (−) worse image quality regarding the subjective overall diagnostic validity focused on image artifacts and overall homogeneity.
Statistical Analysis
The results of the second oncologic reading were compared with a McNemar test with the continuity correction. The scores of the Likert scale were statistically compared using ANOVA with Bonferroni post hoc correction. A P value of less than 0.05 was considered significant. The correlation of the trend in percentage of MTV and SUVmax in percentage was calculated with a linear regression using the ordinary least-squares algorithmic technique. Analyses were performed with the software JMP (version 11; SAS Institute).
RESULTS
In total, 19 patients (14 women; mean age ± SD, 50.9 ± 11.7 y; body mass index [BMI], 22.8 ± 3.2 kg/m2) met the inclusion criteria and were included in the evaluation. Patients’ diseases were distributed as follows: teratocarcinoma (n = 1), squamous cell carcinoma (n = 1), bronchial carcinoma (n = 3), breast cancer (n = 7), esophageal cancer (n = 1), rectal carcinoma (n = 2), lymphoma (n = 1), gastric cancer (n = 1), neurofibromatosis (n = 1), and fever of unknown origin (n = 1).
The mean injected dose was 229.6 ± 67.2 MBq; the mean uptake time was 64.8 ± 9.3 min. The simulation of tracer dose reductions in dependence on patients’ body weight led to the following doses of 18F-FDG in MBq (±SD): 203.0 ± 34.9, 186.1 ± 32.0, 169.2 ± 29.1, 152.2 ± 26.2, 135.3 ± 23.3, 118.4 ± 20.4, 101.5 ± 17.4, 84.6 ± 14.5, 67.7 ± 11.6, 50.7 ± 8.7, and 33.8 ± 5.8. An example of all reconstructed simulated doses of a patient is given in Figure 3.

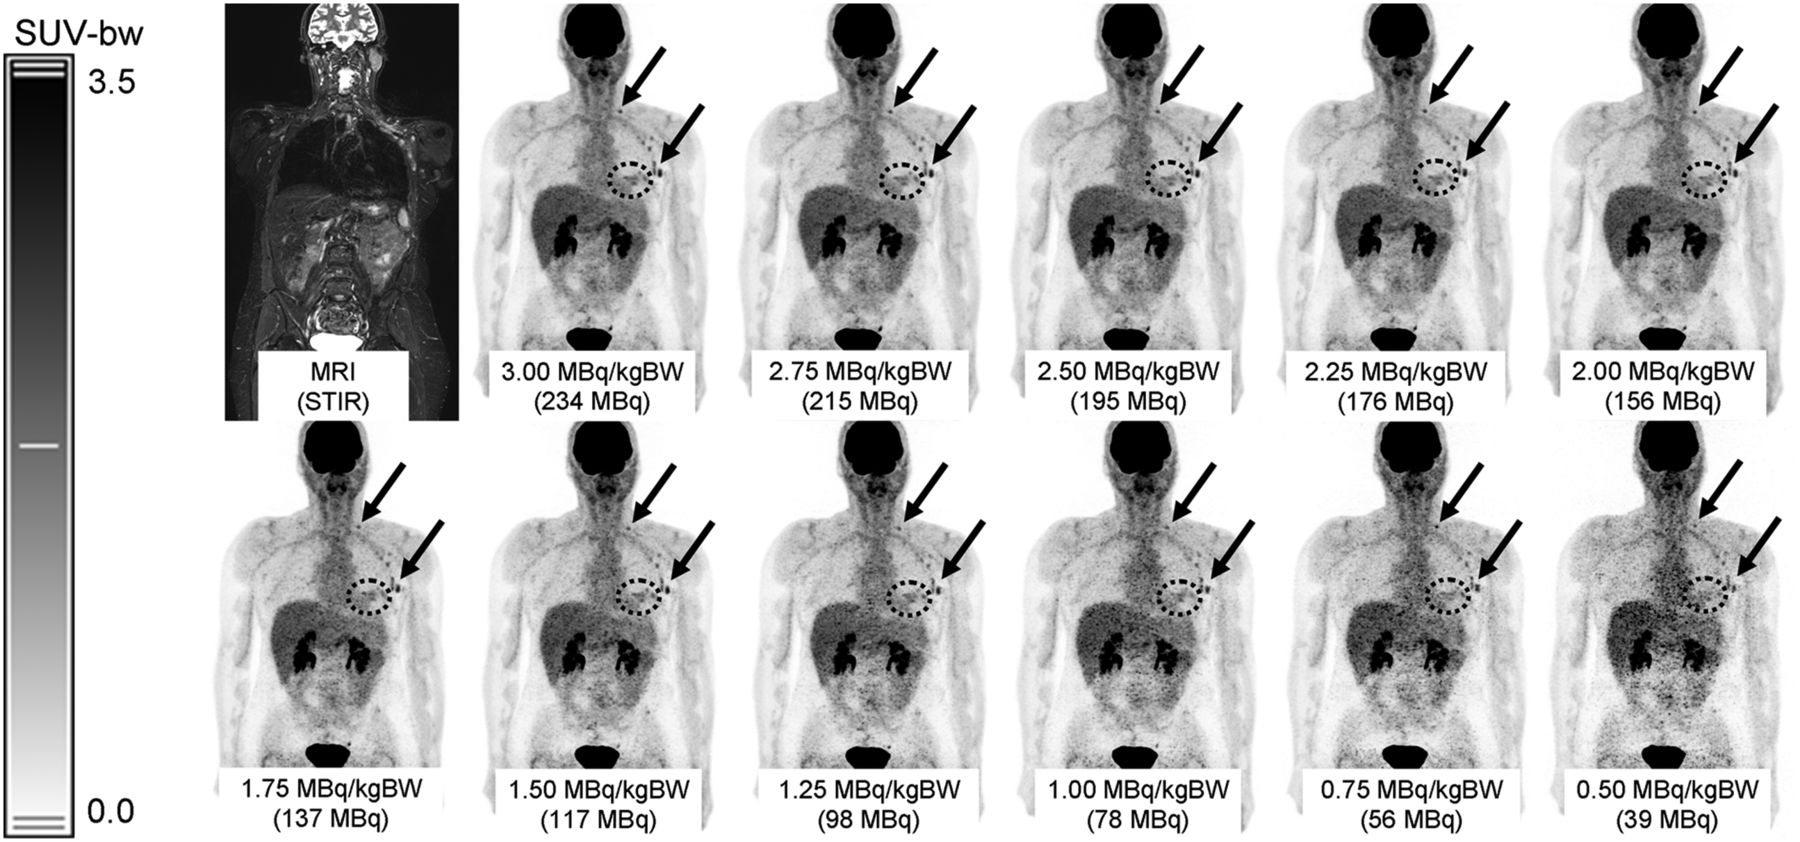
Example of 57-y-old female patient with metastasized breast cancer. Lymph node metastases in left axilla and supraclavicular region are marked with black arrows; cancer in patient’s left breast is highlighted with dotted circle. In all simulated doses, tumor and lymph node metastases can be delineated, although image quality suffers from increasing noise level. In this patient, no severe photopenic artifacts were observed. STIR = short-time inversion-recovery.
Quantitative Assessment of PET Image Quality
The results of the measurement of SUVmean and CV in physiologic tissue are given in Figure 2. The SUVmean in the small bowel, the psoas muscle, and the lumbar vertebra showed a stronger dependence on doses with a pronounced decrease for reduced doses (up to −45% on average in the psoas muscle) compared with other investigated regions (up to −25% in the spleen). At doses of 3 MBq/kgBW, the CV in the renal pelvis was highest (CV, 0.18). The CV in all organs showed a pronounced increase for decreasing doses, especially for doses below 1.5 MBq/kgBW. Fitting the CV with a power law (R2 > 0.91 for all organs) indicates that the noise characteristics follow the Poisson relationship (respecting the fact that dead time, normalization, attenuation correction, and reconstruction algorithm might alter this relationship (11,22)). In all examined body regions, the NECR tended to decrease whereas the estimated SF tended to increase with decreasing doses (Fig. 1). In the abdominal/pelvic region, this dependence of NECR and SF on doses was most pronounced (NECR at 2 MBq/kgBW: abdominal/pelvic regions: 88.2%, head/neck region: 99.9% of the NECR at 3 MBq/kgBW). Moreover, the highest estimated SF of PET images was found in this region (48.7% at 3 MBq/kgBW), and the estimated SF reached the system maximum of 0.75 in low doses in 7 patients: in 3 cases at 0.5 MBq/kgBW, in 2 cases below 0.75 MBq/kgBW, in 1 case below 1.5 MBq/kgBW, and in 1 case below 1.75 MBq/kgBW. This is a predefined limit in the vendor’s software to ensure stable data correction and image reconstruction. In 1 of those patients, the system maximum of the estimated SF was also reached in the pelvic/upper thigh region at 0.5 MBq/kgBW.
Oncologic Readings
Thirteen of 19 patients had PET-positive malignant lesions and were therefore included in the oncologic reading.
PERCIST
In 1 of the patients with PET-positive malignant lesions, the SUVpeak of the lesions was below the liver threshold. Therefore, this patient was excluded from the PERCIST oncologic reading. Overall, 20 lesions in 12 patients were examined in the PERCIST oncologic reading. Of these, 3 were located in the skeleton, 2 in the mammary gland, 1 in the lung, 1 in the adrenal gland, and 1 in the rectum. Moreover, 12 metastatic lymph nodes were evaluated. The results of the PERCIST reading including the SUVmax, SUVpeak, MTV, and PERCIST threshold, which apply to the liver, are presented in Figure 4. The PERCIST threshold was revealed to be of relatively stable behavior, with an increase for doses below 1.25 MBq/kgBW. The SUVpeak showed a slight decrease for decreasing doses, less pronounced, however, compared with the SUVmean in organs. The mean value of SUVpeak at a dose of 0.75 MBq/kgBW was 96% of 3 MBq/kgBW compared with 90% at the same dose of SUVmean in the liver. The SUVmax and the MTV showed the strongest dependence on dose reduction (MTV: 77% of 3 MBq/kgBW on average at a dose of 0.75 MBq/kgBW). The trend of the MTV showed a moderate inverse correlation with the trend of SUVmax (R2 = 0.27). With decreasing doses, the SUVpeak of a target lesion was below the liver threshold in 3 lesions: in 1 lesion at 1.75 MBq/kgBW, in 1 lesion below 1.0 MBq/kgBW, and in 1 lesion at 0.5 MBq/kgBW.

Overview of SUVpeak, SUVmax, MTV of evaluated lesions, and liver threshold according to PERCIST. Liver threshold also includes SD; therefore, decreasing SUV can be compensated by increasing SD, which leads to relatively stable behavior. Trend of MTV shows an inverse linear correlation to trend of SUVmax, with R2 = 0.27.
Lesion Detection
In the second oncologic reading, 90 lesions were defined in the original PET images of the maximum doses (gold standard): 51 metastatic lymph nodes, 15 osseous lesions, 9 pleural lesions, 6 lung metastases, 3 lesions in the mammary glands, 2 in the adrenal glands, 2 in the subcutaneous fat, 1 in the thyroid gland, and 1 in the rectum.
Of those, 86 were identified correctly in the 2 MBq/kgBW PET images. Overall, the difference to full dose PET data was not significant (P = 0.95). No false-positive lesions were found in the 2 MBq/kgBW PET images. Four metastatic lymph nodes were missed in 2 patients in the 2 MBq/kgBW PET, located in the mediastinum (n = 2) and the neck (n = 2). One of them is demonstrated in the supplemental materials (available at http://jnm.snmjournals.org). Three of those lymph nodes were rated with a Likert score of 4 (possibly a malignant lesion) and 1 with a Likert score of 3 (probably a malignant lesion) in the original PET data with full dose. The Likert score on the 2 MBq/kgBW PET images was rated lower than on the full-dose PET images in 5 lesions of 2 patients. However, the average Likert score was 1.8 in both PET images and did not differ significantly (P = 0.84).
Subjective Image Evaluation
The results of the evaluation of the subjective impression of image quality are given in Figure 5. Over a range between doses of 1.25 and 2.75 MBq/kgBW, most PET images were rated as equally good compared with the 2 MBq/kgBW. One PET image with 2.75 MBq/kgBW and 9 PET images with 3 MBq/kgBW were rated as substantially better. One PET image was rated worse at doses of 1.75, 1.5, and 1.25 MBq/kgBW, respectively. However, 5 PET images at 1.75 Mq/kgBW were rated as better than 2 MBq/kgBW.

Overview of evaluation of subjective image impression compared with dose of 2 MBq/kgBW. + means better image quality; = means comparable image quality; − means worse image quality.
With decreasing doses, increasing photopenic areas were observed. Typical photopenic artifacts in PET images were located around the urinary bladder in 3 patients. Moreover, in 2 different patients, we observed large photopenic areas in the middle abdomen, not surrounding the kidneys or the urinary bladder; one of them is demonstrated in Figure 6. BMI of those patients was 24 and 26, respectively.
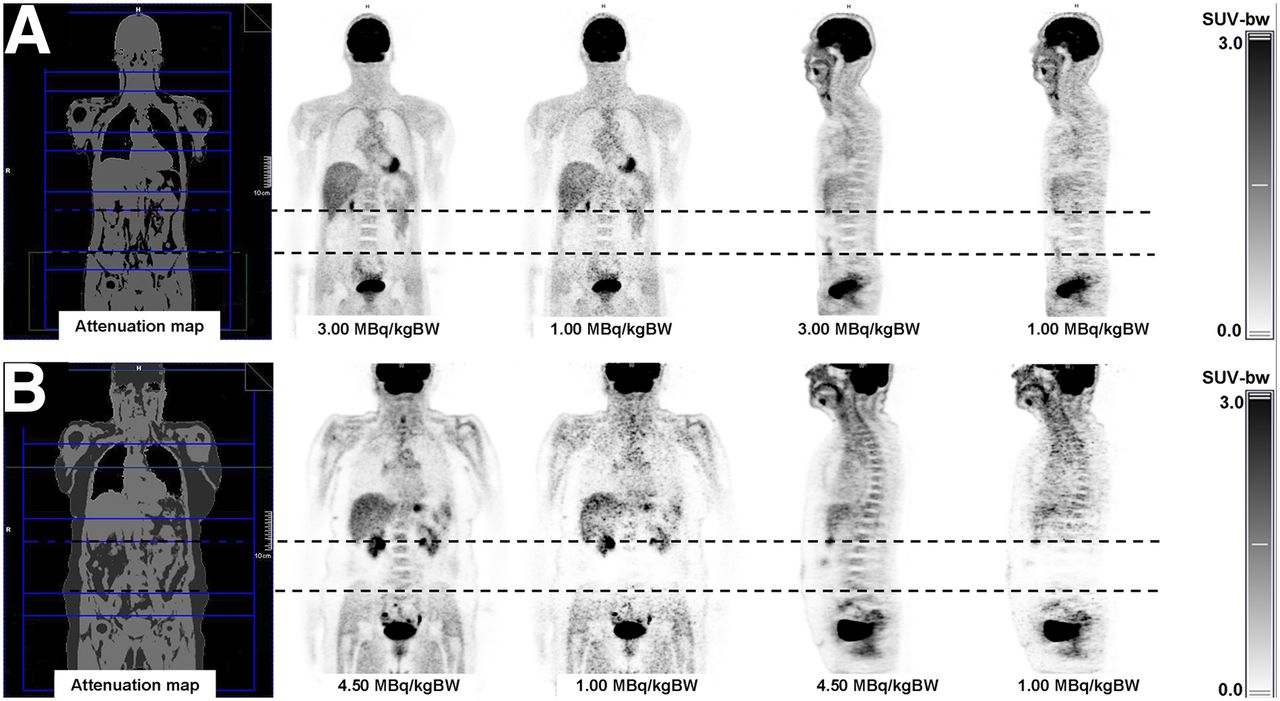
Two examples of simulated dose reduction in 18F-FDG PET. Upper line (A) shows example of a 43-y-old male patient; even with dose of 1 MBq/kgBW image impression is good. In lower line (B), pronounced photopenic area was observed in abdominal region at lower doses. However, this region was located completely within 1 bed position (dotted line).
DISCUSSION
In PET, the annihilation of positrons and electrons leads to the emission of 511-keV γ-photons. This high-energy radiation might potentially harm patients and personnel in the long term (9,23,24). The increasing use of 18F-FDG PET in oncologic imaging not only in initial staging but also in follow-up examinations also results in an increase of radiation exposure for both the patients and the medical personnel. Thus, a reduction of PET tracer doses is desirable. The definition of today’s doses in 18F-FDG PET is mostly based on theoretic models, phantom studies, and the retrospective comparison of different groups of patients (10–15). Because PET is a quantitative statistical imaging technique based on the Poisson-distributed random process of positron emission, theoretic calculations are legitimate. Those models use theoretic benchmarks such as image noise (which is calculated as the SD of the counts in a region of interest) and NECR as surrogates for the assessment of image quality. They are aimed at optimizing objectified parameters such as the NECR peak and do not consider individual characteristics of the patient, physiologic tracer distributions, or the subjective requirements of the physician for an adequate reading of the examination. It is therefore not clear how representative, for example, a phantom study is for an individual patient (25). Moreover, Chang et al. (14) reported in a retrospective study with a large number of patients that a scanner with a higher NECR does not necessarily translate to lower image noise and therefore better image quality, depending on the technique used for image reconstruction. Therefore, the conjunction between NECR and the real image impression or subjective image quality might be more complex. Moreover, to evaluate image quality, many studies measure the image noise in homogeneous liver tissue (12); however, this might not be sufficient to represent the PET image quality of a whole-body examination, because the PET image quality of individual regions might be influenced by regional patient characteristics. This uncertainty is also represented in the heterogeneous recommendations for doses in 18F-FDG PET, for example, comparing the respective European and American societies (13,26). By applying the proposed method of retrospectively modifying PET list-mode data, we could perform a retrospective intraindividual comparison of PET images with different doses.
The first part of our study revealed the effects of dose reduction on objective imaging parameters. We observed variable influences of doses on the system NECR and estimated SF in different body regions, pronounced in the abdominal/pelvic region. Therefore, the influence of doses on image quality differs in different body regions. With decreasing doses, an overall nonlinear increase of the CV in organs can be seen. Additionally, an enhanced effect on the average SUVmean of the small bowel, the psoas muscle, and the lumbar vertebra (mid abdominal region) with a pronounced decrease compared with the other investigated regions (upper abdomen or urinary bladder) was observed with decreasing doses. However, it has to be noted that those regions provide low SUV and thus small changes cause increased relative deviations. The finding of increasing estimated SF and decreasing SUVmean with decreasing doses is likely to be connected, because an artificially growing SF results in an underestimation of measured tracer uptake.
In 2 patients, we observed large photopenic areas in the middle abdomen with decreasing dose; one of them is demonstrated in Figure 6. With BMIs of 24 and 26, those patients were not obese—a common potential reason for impaired PET image quality. In both cases, the estimated SF reached the system limit of 0.75 in those bed positions at doses of 1.75 MBq/kgBW and below, respectively. The system NECR in these cases showed a break in the decreasing curve at the corresponding doses (Fig. 7). Therefore, the high amount of scatter resulting from an erroneous scatter estimation (or more precisely from erroneous scatter scaling) hampers the image reconstruction, or the scatter correction in particular. A reconstruction of PET images without scatter correction or scatter scaling did not reveal these photopenic areas (supplemental materials). The NECR and SF reported were not measured but estimated (calculated) by the scanner. Thus, the computation of the SF and consequently the SUV is incorrect in those regions at low tracer doses. However, because no PET-positive lesions were found in those regions for either patient, the clinical impact on oncologic examinations remains unclear.

NECR and estimated SF of bed position covering abdominal/pelvic region of 2 patients with large photopenic artifacts in abdominal region. Note break in curves of NECR when estimated SF reaches internal maximum of 0.75, limited by scanner software.
Scatter estimation is usually performed by single scatter simulation (27,28) whereas the correction for multiple scatter is done via scatter scaling (scatter fitting outside attenuating regions in the emission sinogram (29)). Thus, scatter scaling can be problematic for low tracer concentrations or specific tracers (low counting rate outside attenuating regions (30)) as well as for high tracer concentrations outside the PET field of view (31). This is especially true for current PET/MRI systems, which have higher estimated scatter fractions than PET/CT systems (32). Thus, to allow PET imaging with low tracer activities, an optimization of the scatter correction is needed (e.g., via fast Monte Carlo simulations (33,34)). However, because the attenuation correction map in an essential input for the scatter estimation, an optimization of the MR-based attenuation correction might also be an important point of action to improve the reconstruction results (e.g., (35,36)). A workaround to reduce photopenic areas in the abdominal region might be an optimized positioning of PET fields of view (PET field of view not between kidney and bladder). Also, prolonged acquisition times in this region might compensate for low-dose examinations. However, this has to be further evaluated in future studies. Of course, ensuring the voiding of the patients’ bladders is important.
Other investigated regions showed a more stable behavior, with a pronounced decrease of SUVmean from below 1.25 MBq/kgBW. A typical photopenic artifact in PET images was located around the urinary bladder. This artifact was severely increasing with decreasing doses in 3 patients (patients different from the previously described cases). As a consequence, in 1 of those cases, a PET-positive carcinoma of the rectum could not be distinguished from the background at a dose of 0.5 MBq/kgBW (supplemental materials).
The oncologic evaluation according to PERCIST revealed that the calculated threshold in the liver shows a relatively stable behavior compared with the other examined parameters even with a slight increase of the threshold at low doses. This behavior can be explained by the increase of SD in lower-dose images (threshold = 1.5 × SUVmean + 2 × SD), which therefore countervails the trend of decreasing SUVmean (Figs. 2 and 4). In some target lesions, the SUVpeak in the highest dose was just close above the liver threshold. In 3 of those lesions, the SUVpeak was below the threshold in lower doses (maximum, 1.75 MBq/kgBW). This might have severe influence on oncologic readings, because those lesions would not have been rated as target lesions. Moreover, considering the Deauville criteria for lymphoma (7) and the overall trend toward quantitative assessment in PET, a reliable measurement of SUV is of utmost importance, especially in clinical trials.
The SUVmax and the MTV were revealed to be unstable parameters with a strong correlation to doses. The MTV can influence the oncologic reading in follow-up examinations, in texture analysis, as well as on therapy planning in radiation therapy (8,37,38).
With a simulated dose of 2 MBq/kgBW, the subjective image impression as well as the diagnostic performance of oncologic reading did not differ substantially from higher doses in most cases: the evaluation of the subjective image impression revealed that over a wide range of doses, no substantial differences compared with 2 MBq/kgBW were found. The reading of the image impression represents an individual subjective evaluation by an experienced nuclear medicine physician at a certain time; however, 5 PET images with a simulated dose of 1.75 MBq/kgBW were rated better than the 2 MBq/kgBW PET images. With a dose of 2 MBq/kgBW, most lesions could be identified correctly and no false-negative or-false positive findings in an organ or patient-based analysis were observed. Moreover, Likert scores regarding diagnostic confidence of lesions did not differ significantly from those of the maximum doses.
Previously conducted studies investigated the effects of simulated dose reduction in dependence on predefined true count levels on image characteristics of 18F-FDG PET images of the lung (21,39). We chose a more clinical approach by calculating whole-body PET images in dependence on patients’ characteristics, because count levels differ for different body regions and cannot be predicted. De Groot et al. (12) suggest that the signal-to-noise-ratio in PET is more strongly correlated to the body mass than to the lean body mass, the BMI, or the fat mass; thus, we decided to calculate our doses in relation to kilogram of body weight. Yan et al. (39) determined a lower limit of 5 million true counts for the Biograph mMR, which would roughly correspond to a dose below 0.5 MBq/kgBW in our setting. However, the dose-determining factor is the lower abdomen, which was not assessed by their work. Schaefferkoetter et al. (21) found similar results for PET/CT. Interestingly, they also found an increase in the estimated SF below 1 million true counts in the lung. Unfortunately, the abdominal region was not assessed here either.
Our study has several limitations. The low number of patients with a relative homogeneous BMI and with different types of tumors does not allow for general recommendations. The investigated regions were mostly located in the abdomen; other regions such as the thorax or the brain were not evaluated and are beyond the scope of our work. In the oncologic reading according to PERCIST, only target lesions were investigated; however, nontarget lesions can also have a significant influence on the evaluation of PET examinations in oncology. The initial doses in our study are already relatively low compared with guidelines, as it is generally accepted that prolonged acquisition times have the potential to compensate for lower doses (19). Bed positions of a patient were classified in different categories; because our study was performed in a clinical setting, patients show different body heights and body proportions. Therefore, the different beds do not always cover exactly the same body region or organs. Also, the random deletion of PET events from list-mode data assumes a linear dependence of true and random events to the single counts (similar to Schaefferkoetter et al. (21)). However, it is known that randoms show a quadratic dependence. Even though results from Gatidis et al. (20) indicated that there is no significant difference between measured and simulated PET images for the activity concentration range used here, our results represent a worst-case scenario; image quality might be improved for measured low-dose PET images because randoms and dead time should be lower at lower doses. Finally, all PET images in all simulated doses were reconstructed with the same parameters. However, for PET images of lower doses an adjustment of reconstruction parameters such as gaussian filtering or the number of subsets might lead to improved image impressions or lesion detections.
CONCLUSION
It could be shown that a reduction of 18F-FDG doses down to 2 MBq/kgBW might be possible in whole-body PET/MRI examinations of oncologic patients with no distinct effect on lesion detection, diagnostic confidence, or a study evaluation according to PERCIST. However, the impact of reducing doses on image quality and SUV measurements is highly dependent on body regions, mostly affecting the middle abdomen. Moreover, with decreasing doses we observed the occurrence of large photopenic artifacts in the middle abdomen in single patients. The occurrence of this artifact cannot currently be predicted, and the clinical impact is unclear. Therefore, we do not recommend reducing doses below 3 MBq/kgBW in oncologic PET/MRI examinations in adults at this time.
DISCLOSURE
No potential conflict of interest relevant to this article was reported.
Footnotes
Published online Mar. 30, 2017.
- © 2017 by the Society of Nuclear Medicine and Molecular Imaging.
REFERENCES
- Received for publication September 20, 2016.
- Accepted for publication March 16, 2017.


