


Abstract
Rheumatoid arthritis is a chronic autoimmune disorder resulting in synovial inflammation. Fibroblast activation protein (FAP) is overexpressed by fibroblastlike synoviocytes in arthritic joints. Radioimmunoimaging with an anti-FAP antibody might be used to monitor the response to therapy, thus enabling tailored therapy strategies and therapeutic outcomes. The aim of this study was to assess whether a radiolabeled anti-FAP antibody could be used to monitor the efficacy of treatment with long-circulating liposomes (LCL) containing prednisolone phosphate (PLP-LCL) in a mouse model of arthritis. Methods: Collagen-induced arthritis (CIA) was induced in male DBA/1J mice. Mice were treated with a single injection (10 mg/kg) of PLP-LCL or empty LCL as a control. SPECT and CT images were acquired 24 h after injection of 99mTc-labeled succinimidyl-hydrazinonicotinamide (99mTc-S-HYNIC)–conjugated anti-FAP antibody 28H1 at 2, 5, and 9 d after treatment. The uptake of 99mTc-S-HYNIC-28H1 in all joints was quantified and correlated with macroscopic arthritis scores. Results: Treatment of CIA with PLP-LCL significantly suppressed joint swelling. At just 1 d after treatment, the macroscopic arthritis scores had decreased by 50%. Scores decreased further, to only 10% of the initial scores, at 5 and 9 d after treatment. In contrast, macroscopic arthritis scores had increased up to 600% in untreated mice at 9 d after the injection of empty LCL. 99mTc-S-HYNIC-28H1 uptake ranged from 1.5 percentage injected dose per gram in noninflamed joints to 22.6 percentage injected dose per gram in severely inflamed joints. The uptake of radiolabeled 28H1 in inflamed joints (percentage injected dose) correlated with the arthritis score (Spearman ρ, 0.77; P < 0.0001). Moreover, the uptake of 99mTc-S-HYNIC-28H1 was slightly increased at 9 d after therapy but was not seen macroscopically, indicating that SPECT/CT imaging might be more sensitive than the macroscopic arthritis scoring method. Conclusion: SPECT/CT imaging with 99mTc-S-HYNIC-28H1 specifically monitored the response to therapy, and tracer accumulation correlated with the severity of inflammation. In addition, SPECT/CT imaging was potentially more sensitive than the macroscopic arthritis scoring method. This study showed that SPECT/CT with 99mTc-S-HYNIC-28H1 could be used to noninvasively monitor the course of CIA in mice.
- fibroblast activation protein
- SPECT/CT imaging
- collagen-induced arthritis
- prednisolone phosphate–encapsulating PEG liposomes
- therapy monitoring
Rheumatoid arthritis (RA) is an autoimmune disorder that affects 0.5%–1% of the European population (1). It is characterized by inflammation of synovial joints and eventually leads to cartilage and bone destruction. At present, RA is treated mostly systemically (orally, intramuscularly, or intravenously) by combinations of nonsteroidal antiinflammatory drugs, disease-modifying antirheumatic drugs, biological agents, and corticosteroids or sometimes locally (intraarticular corticosteroid injections) (2,3). All of these therapeutic treatments aim to relieve pain, reduce inflammation, and prevent irreversible damage. Unfortunately, therapeutic effects may take several months to occur, especially after treatment with disease-modifying antirheumatic drugs; in a subpopulation of patients, nonresponsiveness to the drugs is seen. Therefore, there is a need for a noninvasive imaging method to objectively determine the severity of symptoms, to monitor therapeutic efficacy, and to predict the occurrence of exacerbations during the course of the disease. At an early stage after treatment, specific and sensitive therapy monitoring could allow for an alteration of the therapeutic strategy when therapeutic effects are shown to be insufficient, potentially decreasing the unwanted side effects of ineffective drugs. In addition, an early switch to an effective drug could protect patients from irreversible damage due to RA.
The synovium of RA patients contains high levels of inflammatory cells, including macrophages and fibroblastlike synoviocytes (4,5). These cells are prominently present in areas with high inflammatory activity and have an aggressive, invasive character. When activated, macrophages produce proinflammatory cytokines, such as interleukin 1 and tumor necrosis factor α, triggering the production of proinflammatory cytokines (6). After stimulation by interleukin 1 and tumor necrosis factor α, fibroblastlike synoviocytes produce proinflammatory cytokines and proteolytic enzymes, such as interleukin 6 and matrix metalloproteinases (7,8). These mediators stimulate and amplify inflammation, contribute to degradation of the extracellular matrix, and exacerbate joint damage. Patients are often treated with corticosteroids, such as prednisolone phosphate (PLP), to suppress inflammation and reduce the levels of proinflammatory cytokines. PLP reduces the accumulation of macrophages and irreversible cartilage damage (9,10). To increase efficacy and reduce toxicity, PLP can be given locally or encapsulated in drug delivery systems. In experimental arthritis models, the use of long-circulating liposomes (LCL) to target all inflamed joints at once with one intravenous injection created local persisting depots of steroids and increasing ratios of efficacy to safety (11,12).
Molecular imaging has already been proven successful in noninvasive and early response monitoring but, in most cases, is not specific for arthritis at a molecular level (11,13). Fibroblast activation protein (FAP) is a cell surface–bound, type II transmembrane glycoprotein belonging to the family of serine prolyl oligopeptidases. In arthritic joints, FAP is dominantly expressed by activated fibroblastlike synoviocytes and is found in human arthritis as well as experimental arthritis, such as the collagen-induced arthritis (CIA) model (14). FAP plays a role in pannus formation and progression of disease in all stages (15). Antibody 28H1 is a noninternalizing antibody with a high affinity for human and murine FAP (16). The specificity of 28H1 was shown in an vitro binding assay and by immunohistochemistry in arthritic joints (16). SPECT/CT imaging with 111In-labeled 28H1 as a tracer revealed a significant correlation between uptake of 111In-diethylenetriaminepentaacetic acid (DTPA)-28H1 in inflamed joints and the severity of arthritis (16). To further improve this tracer, we examined the use of 99mTc for radiolabeling. Because of the shorter half-life of 99mTc (6 h) than of 111In (67 h), it is a better match with the relatively short circulation time of 28H1. Additionally, the radiation dose per scan will be lower, 99mTc is less expensive, and image resolution will be higher than that with 111In-labeled tracers.
In this study, we focused on the potential role of antibody 28H1 as a specific and sensitive tool for early response monitoring after treatment with LCL containing PLP (PLP-LCL) in murine CIA. The CIA model is considered to be a suitable model for studying disease progression and the therapeutic effects of antirheumatic drugs.
MATERIALS AND METHODS
Preparation of Liposomes
LCL containing PLP at 2.1 mg/mL were prepared by injection of an ethanolic lipid solution into an aqueous dispersion medium and then extrusion as described earlier (11,17). In brief, dipalmitoylphosphatidylcholine and 1,2-distearoyl-phosphatidylethanolamine-methyl-polyethylene glycol conjugate 2000 (both from Lipoid GmbH) and cholesterol (from BUFA) (molar ratio, 1.85:0.15:1) were dissolved in ethanol. The aqueous drug solution contained PLP (BUFA) at 100 mg/mL in water for injection. The ethanolic lipid solution was injected into the aqueous solution, and the resulting coarse dispersion was downsized by multiple extrusion steps (4 or 5 for each pore size) through polycarbonate filter membranes with decreasing pore sizes of 200, 100, and 50 nm (Whatman Nuclepore Track-Etch Membrane; Sigma–Aldrich). Size (111 nm) and mean polydispersity (0.07) were determined by dynamic light scattering with a Malvern 4700 system (Malvern Ltd.). Nonencapsulated PLP was removed by dialysis against saline in Slide-A-Lyzer dialysis cassettes (Thermo Fisher Scientific) with a molecular weight cutoff of 10 kDa. The dialysis medium was refreshed 4 times after at least 8 h.
Antibody Conjugation
Monoclonal anti-FAP antibody 28H1 (3.7 mg/mL) was conjugated with a 10-fold molar excess of succinimidyl-hydrazinonicotinamide (S-HYNIC) (Solulink, Inc.) in 1 M NaHCO3 (pH 8.2) for 1 h at room temperature. Nonconjugated S-HYNIC was removed by dialysis against ammonium acetate (0.25 M; pH 5.5) in Slide-A-Lyzer dialysis cassettes with a molecular weight cutoff of 10 kDa. The dialysis medium was refreshed 4 times after at least 8 h.
Radiolabeling Procedure
SnSO4 (1 mg/mL) was freshly prepared by adding 5 mg of SnSO4 to 5 mL of 0.1 M HCl. This solution was flushed with N2 (gas) for 10 min to prevent oxidation of SnSO4 during the labeling procedure. Tricine (100 mg per mL of phosphate-buffered saline; pH 7; coligand), 0.02 mg of SnSO4, and 240 MBq of 99mTcO4− were added to 300 μg of S-HYNIC-28H1, and the mixture was incubated at room temperature for 30 min. Radiolabeling efficiency was determined by instant thin-layer chromatography on ITLC-SG strips (Agilent Technologies) with 0.1 M citrate (pH 6.0) as the mobile phase. Labeling efficiency exceeded 95% or, if it was less than 95%, then the labeled product was purified by gel filtration chromatography on a PD-10 column (GE Healthcare) to provide a preparation with a radiochemical purity of greater than 95%.
Animals
Male DBA/1J mice, 10–12 wk old, were purchased from Janvier Labs. All mice were housed in filter-top cages under pathogen-free conditions. Food (SNIFF Voer) and water were available ad libitum. All animals were allowed to become accustomed to the environment for at least 1 wk before experiments were initiated. All in vivo experiments were approved by the Animal Welfare Committee of Radboud University, Nijmegen, The Netherlands, and were conducted in accordance with the principles of the revised Dutch Act on Animal Experimentation (1997).
CIA Model
CIA was induced as described previously (18). In brief, male DBA/1J mice were immunized with 100 μg of bovine type II collagen emulsified in Freund complete adjuvant (Difco Laboratories) and injected intradermally into the tail base. After 3 wk (day 21), the mice received a booster injection of 100 μg of bovine type II collagen in saline. The onset of CIA occurred a few days after the booster injection. The onset and development of arthritis were macroscopically monitored by independent observers in a masked fashion and scored on a scale from 0 to 2 for each paw. Cumulative scoring was based on redness, swelling, and ankylosis: 0, no sign of arthritis; 0.25, 1 or 2 toes red or swollen; 0.5, 3–5 toes red or swollen; 1.0, swollen ankle; 1.5, swollen footpad; and 2.0, severe swelling and ankylosis (16).
Liposomal Treatment with PLP
Liposomal treatment was given 1 d after the booster injection. The treated mice received a single intravenous injection of PLP (10 mg/kg) in LCL, with a lipid dose of 100 μmol/mouse, in a total volume of 200 μL. The control mice received empty LCL at the same lipid dose.
Small-Animal SPECT/CT Imaging and Ex Vivo Biodistribution Studies
Treated and untreated DBA/1J mice with CIA were injected intravenously with 50 μg of 99mTc-labeled S-HYNIC-28H1 (specific activity, 800 MBq/mg, in 200 μL; n = 5 per group) at day 1, 4, or 8 after therapy. At 24 h after tracer injection, mice were euthanized by CO2/O2 suffocation. Subsequently, images were acquired with a U-SPECT-II/CT scanner (MILabs) (19). Images were acquired as 2 frames of 25 min with a 1.0-mm-diameter cylindrical pinhole mouse ultra-high-sensitivity collimator. SPECT scans were followed by CT scans for anatomic referencing (spatial resolution, 160 μm; 65 kV; 615 μA). Scans were reconstructed with MILabs reconstruction software (which uses an ordered-subset expectation maximization algorithm), a voxel size of 0.2 mm, 16 subsets, and 1 iteration.
After image acquisition, relevant tissues were dissected to determine the accumulation of the tracer in the organs and the joints. Tissues of interest (right wrist joint, left wrist joint, right ankle joint, and left ankle joint) were dissected and weighed, and radioactivity was measured in a shielded well-type γ-counter (∼7.6 cm [3 in]; Perkin–Elmer). Injection standards (1%) were counted simultaneously with tissue samples to correct for physical decay and to allow calculation of the percentage injected dose (%ID) per gram of tissue (%ID/g).
Quantitative SPECT Analysis
Reconstructed micro-SPECT scans were coregistered with CT images. A gaussian filter of 0.8 was applied to the SPECT images, and a 3-dimensional volume of interest was drawn around the arthritic joints with Inveon Research Workplace 4.1 software (Siemens Preclinical Solutions). Voxel intensity values were converted to %ID with decay correction and a standard curve (voxel intensity vs. kBq) acquired by scanning and reconstructing known 99mTc activities from 0 to 370 kBq under the same conditions as those used during the animal scans.
Statistical Analysis
Statistical analysis was performed with GraphPad Prism version 5.03 for Windows (GraphPad Software). Values are reported as mean ± SD. The data were analyzed with nonparametric Mann–Whitney U tests. All tests were 2-sided, and P values of less than 0.05 were considered to be significant.
RESULTS
PLP-LCL Therapy
Treatment with a single injection of PLP-LCL at 10 mg/kg was started after the onset of arthritis and was effective, as macroscopic arthritis scores were lower in treated mice than in control mice (Fig. 1). Visual arthritis scores were measured on a scale from 0 to 2 per paw and from 0 to 8 per mouse until 9 d after therapy. Arthritis scores were significantly lower in the treated group than in the control group at all time points. At day 2 after treatment, the arthritis scores had decreased in treated mice but had increased in control mice (P = 0.01). This effect was still seen at 5 d after treatment (P = 0.01) and at 9 d after treatment (P = 0.02).
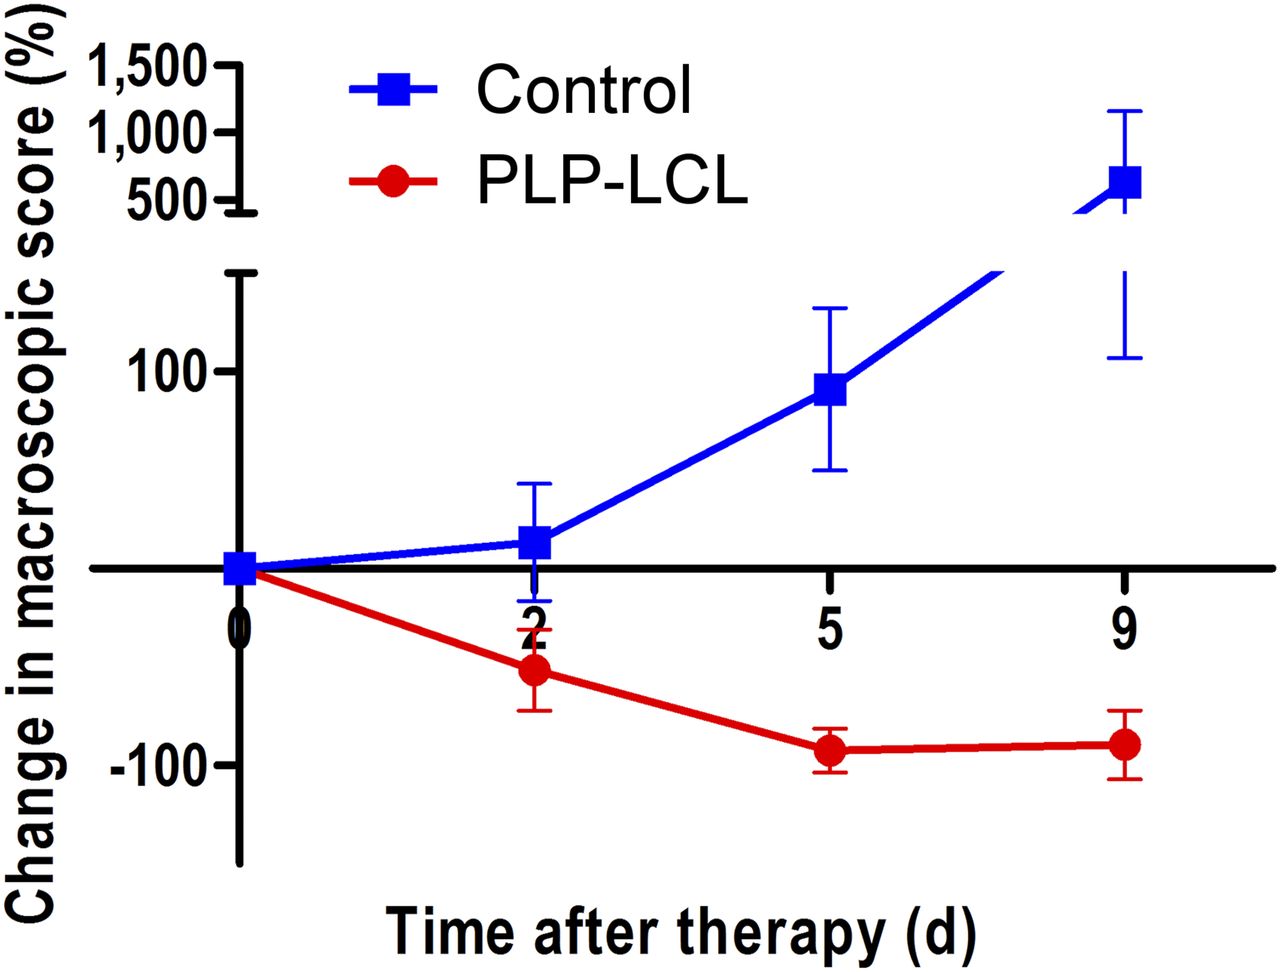
Changes in macroscopic arthritis scores over time after single treatment with PLP-LCL at 10 mg/kg (red circles) vs. empty LCL (blue squares). Values are mean ± SD for 5 mice per group. Mann–Whitney U tests showed that differences between control and treated animals were significant at all time points (P = 0.01, P = 0.01, and P = 0.02 at 2, 5, and 9 d after treatment, respectively).
SPECT/CT Imaging
Inflamed joints were specifically visualized by SPECT/CT imaging with 99mTc-S-HYNIC-28H1 at 2, 5, and 9 d after treatment (Fig. 2). Images clearly showed preferential uptake of the anti-FAP antibody in inflamed paws, with low background accumulation in other tissues; even joints with minimal arthritis scores (0.25 on a scale of 0–2) were delineated. Increased uptake of the radiolabeled anti-FAP antibody in inflamed joints of control mice was shown over time (Figs. 2A–2C), whereas the joints of treated mice did not show enhanced uptake (Figs. 2D–2F).
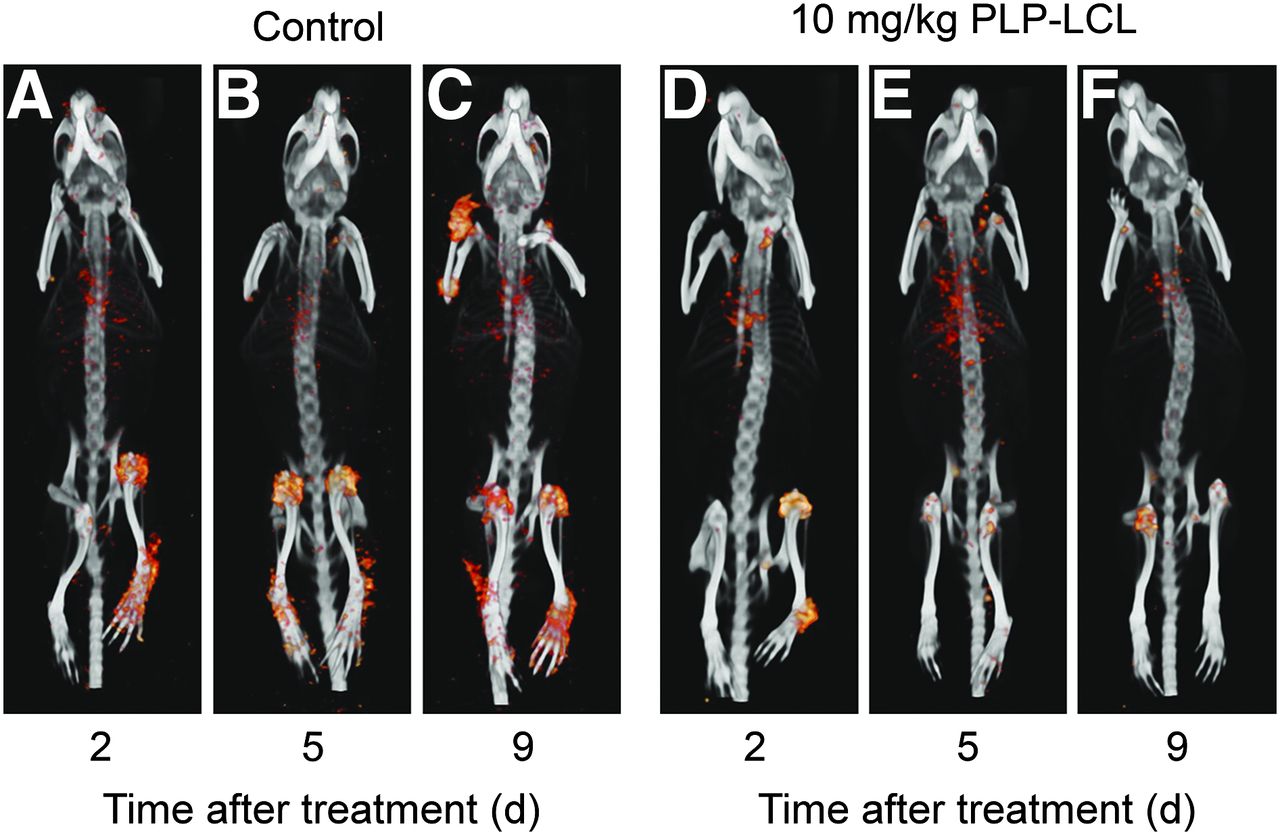
3-dimensional SPECT/CT scans of control (A–C) and PLP-LCL–treated (D–F) CIA mice at 24 h after injection of 99mTc-28H1 (50 μg). Image acquisition was performed 2 d (A and D), 5 d (B and E), and 9 d (C and F) after therapy. All images are scaled equally.
Quantitative SPECT Analysis
Tracer accumulation in each paw on SPECT/CT images was analyzed quantitatively. Analysis showed that tracer accumulation was lower in treated mice than in control mice and was significantly lower at 5 and 9 d after treatment (P < 0.02) (Fig. 3A). Tracer accumulation in joints of treated mice was 4.1 ± 3.5, 1.9 ± 1.0, and 3.2 ± 1.1 %ID/g at 2, 5, and 9 d after treatment, respectively; for untreated mice, the corresponding values were 3.5 ± 3.0, 3.1 ± 2.8, and 6.9 ± 4.1 %ID/g at 2, 5, and 9 d after injection of empty LCL, respectively. A good correlation was found between the values obtained for 99mTc-S-HYNIC-28H1 uptake in the quantitative SPECT analysis and the arthritis scores (Spearman ρ, 0.6830; P < 0.0001) (Fig. 3B).
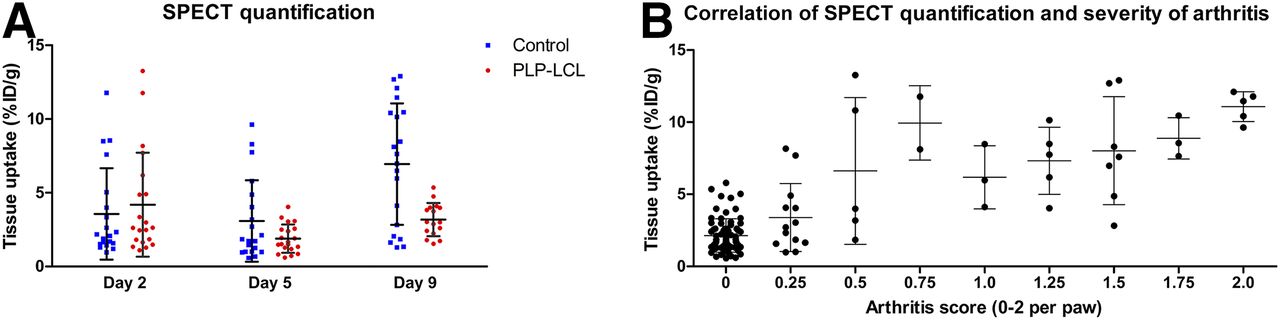
(A) Tissue uptake–based quantitative SPECT analysis at 2, 5, and 9 d after treatment with PLP-LCL at 10 mg/kg. Mann–Whitney U tests showed significantly lower levels of tissue uptake after treatment with PLP-LCL than in control group (P = 0.02). (B) Correlation between tissue uptake of 99mTc-S-HYNIC-28H1 at 24 h after injection and arthritis scores (Spearman ρ, 0.6830; P < 0.0001). Tissue uptake (%ID/g) per individual paw (4 or 5 mice per group, 4 joints per mouse) is shown.
Biodistribution Studies
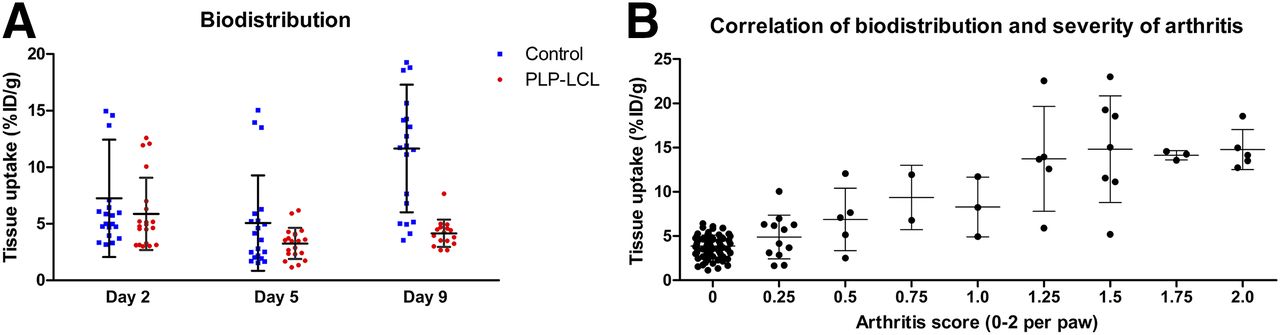
Measurement of the activity concentration in dissected organs showed that the accumulation of 99mTc-S-HYNIC-28H1 in joints was lower in arthritic mice treated with PLP-LCL than in control mice (P = 0.01) (Fig. 4A). Tracer accumulation in joints of treated mice was 5.9 ± 3.1, 3.3 ± 1.4, and 4.1 ± 1.2 %ID/g at 2, 5, and 9 d after treatment, respectively. These values were lower than those for control mice, in which tracer accumulation in joints was 7.2 ± 5.2, 5.1 ± 4.2, and 11.7 ± 5.6 %ID/g at 2, 5, and 9 d after injection of empty LCL, respectively. Whole-body distribution of radioactivity in treated mice did not differ significantly from that in control mice at all time points (data not shown). Additionally, in line with the quantitative SPECT analysis, a correlation was found between the values obtained for 99mTc-S-HYNIC-28H1 uptake in the biodistribution studies and the arthritis scores (Spearman ρ, 0.6699; P < 0.0001) (Fig. 4B). Furthermore, the values obtained for 99mTc-S-HYNIC-28H1 uptake in the biodistribution studies correlated with the uptake values found in the quantitative SPECT analysis (r, 6.072; P < 0.0001).

(A) Tissue uptake–based biodistribution studies at 2, 5, and 9 d after treatment with PLP-LCL at 10 mg/kg. Mann–Whitney U tests showed significantly lower levels of tissue uptake after treatment with PLP-LCL than in control group (P = 0.01). (B) Correlation between tissue uptake of 99mTc-S-HYNIC-28H1 at 24 h after injection and arthritis scores (Spearman ρ, 0.6699; P < 0.0001). Tissue uptake (%ID/g) per individual paw (4 or 5 mice per group, 4 joints per mouse) is shown.
DISCUSSION
The present study demonstrated that SPECT images at 24 h after injection of a 99mTc-labeled anti-FAP antibody reflected the severity of arthritis and therapeutic efficacy (6,11,12,20). These data indicated that 99mTc-S-HYNIC-28H1 could be used for noninvasive monitoring of the therapeutic effects of PLP-LCL in a mouse model of arthritis. Our previous study showed that the uptake of 111In-DTPA-28H1 in inflamed joints was specific and correlated with the severity of arthritis and that 111In-DTPA-28H1 SPECT/CT resulted in high-quality images (16). The data indicated that molecular imaging with an anti-FAP antibody might provide added value for early and sensitive response monitoring.
Ideally, multiple images would be acquired within a short period of time, just before therapy and early after therapy. To allow for this schedule, repeated injections of the tracer would be necessary. High-quality images were obtained with 111In-DTPA-28H1, and the half-life (2.8 d) of 111In is suitable for antibody imaging but too long to allow repeated imaging of the same patient within a short period. Therefore, we radiolabeled 28H1 with a radionuclide that has a relatively short physical half-life. With a half-life of 6 h, the radionuclide 99mTc is potentially suitable for repeated imaging at multiple time points at short intervals. To allow efficient and stable labeling of 28H1 with 99mTc, we conjugated the antibody with S-HYNIC and labeled it in the presence of tricine as a coligand.
Because 28H1 is a humanized antibody that would induce a severe immune response with repeated exposure in mice, we were not able to image the mice repeatedly and monitor the therapeutic effects in the same animal. However, here we showed that 99mTc-S-HYNIC-28H1 might be used to monitor the therapeutic effects in RA patients at multiple time points. The potential ability of our construct to monitor therapeutic efficacy was examined with PLP-LCL therapy because it has been shown to result in rapid, strong therapeutic benefits in experimental RA models (6,11,12,20). The therapeutic effects in mice were monitored by visual arthritis scoring; the scores had already decreased 2 d after the administration of PLP-LCL, and almost complete remission of macroscopic signs of arthritis was observed at least until 9 d after treatment (Fig. 1).
With PLP treatment, lower levels of tumor necrosis factor α and interleukin 1 are produced in inflamed joints, in turn leading to decreased activation of fibroblastlike synoviocytes, resulting in reduced production of FAP (9,10). We hypothesized that this effect could be visualized noninvasively with 99mTc-S-HYNIC-28H1 SPECT/CT. High image quality was obtained, and the activity of the radiolabeled antibody in background tissue was low (Fig. 2). Over time, images showed increasing uptake in the joints of mice in the control group and decreasing uptake in the joints of mice that received PLP-LCL; these findings demonstrated that the therapeutic effects of PLP-LCL could be visualized noninvasively with 99mTc-S-HYNIC-28H1 SPECT/CT.
The findings were confirmed after quantification of the SPECT images (Fig. 3A) and by the ex vivo biodistribution studies (Fig. 4A). In both analyses, values correlated with macroscopic arthritis scores (Figs. 3B and 4B); this correlation was also observed with the 111In-labeled compound (16). The correlation found between macroscopic arthritis scores and ex vivo biodistribution data was lower than that found between macroscopic arthritis scores and quantitative imaging.
Significant uptake of 99mTc-S-HYNIC-28H1 was observed in multiple joints of individual mice; these joints were not considered in our macroscopic arthritis scoring system, so the uptake of 99mTc-S-HYNIC-28H1 resulted in a more complete representation of the severity of disease. Even paws with low arthritis scores were visualized by 99mTc-S-HYNIC-28H1 SPECT, although the joints did not show obvious macroscopic symptoms; these findings indicated the potentially high sensitivity of this imaging method for monitoring the onset of disease. These data suggest that this imaging method outperforms the macroscopic arthritis scoring method for identifying mildly involved joints and can measure inflammation in joints that cannot be scored macroscopically.
Quantitative SPECT analysis at day 9 after therapy can also support the hypothesis of high sensitivity of imaging with 99mTc-S-HYNIC-28H1. The arthritis scores did not increase in the treated group, whereas the SPECT values increased, although not significantly. This finding can indicate an early decrease in the effect of PLP that was not yet detected macroscopically, emphasizing that molecular imaging may detect flare-ups at earlier time points than macroscopic arthritis scoring. However, we cannot rule out the possibility that the increase in tissue uptake was a result of variations between the groups. The mice that were imaged at day 5 were not the same as those that were imaged at day 9. The mice were divided into groups on the basis of macroscopic arthritis scores at the start of therapy, but because of the systemic and progressive character of the model, the groups were not equally affected at the time of imaging. Although no significant differences were found in macroscopic arthritis scores between the mice in the day 5 group and those in the day 9 group at the start of therapy, the differences in tissue uptake could be explained by slightly more severely affected mice in the day 9 group.
CONCLUSION
99mTc-S-HYNIC-28H1 SPECT is a more specific and potentially a more sensitive method for the early detection of exacerbations in RA and for therapy monitoring, relative to the arbitrary macroscopic arthritis scoring system. Therefore, this reliable, noninvasive method may be valuable for immediate therapy monitoring and further therapy planning in RA patients, with the aim of improving individual treatment strategies.
DISCLOSURE
This study was supported by a grant from NanoNextNL Drug Delivery Program 03D.06. No other potential conflict of interest relevant to this article was reported.
Acknowledgments
We thank Bianca Lemmers-van de Weem, Sharon Wennekers, Iris Lamers-Elemans, and Kitty Lemmens-Hermans for their technical assistance in the animal experiments.
Footnotes
Published online Aug. 4, 2016.
- © 2017 by the Society of Nuclear Medicine and Molecular Imaging.
REFERENCES
- Received for publication May 8, 2016.
- Accepted for publication July 13, 2016.


Jump to section
Related Articles
Cited By...
- An ultra-high-affinity small organic ligand of fibroblast activation protein for tumor-targeting applications
- The Latest Developments in Imaging of Fibroblast Activation Protein
- Fibroblast Activation Protein-Targeted PET/CT with 68Ga-FAPI for Imaging IgG4-Related Disease: Comparison to 18F-FDG PET/CT
- A Tumor-Imaging Method Targeting Cancer-Associated Fibroblasts