


Abstract
Diffuse optical spectroscopic imaging (DOSI) is used as an indicator of tumor blood volume quantified by tissue hemoglobin concentrations. We aimed to determine whether early changes in tumor total hemoglobin (tHb) concentration can predict a pathologic complete response (pCR) to neoadjuvant chemotherapy in patients with operable breast cancer, and we compared the predictive value of pCR between DOSI and 18F-FDG PET combined with CT. Methods: Of the 100 patients enrolled, 84 patients were prospectively evaluated for primary objective analysis. Sixty-four of the patients underwent both sequential DOSI scans at baseline after their first and second chemotherapy courses and 18F-FDG PET/CT at baseline and after their second chemotherapy course. The mean tHb (tHbmean) concentration and SUVmax of the lesion were measured using DOSI and 18F-FDG PET/CT, respectively, and the percentage change in tHbmean (∆tHbmean) and change in SUVmax (∆SUVmax) were calculated. We compared the diagnostic performances of DOSI and 18F-FDG PET/CT for predicting pCR via the analysis of the receiver-operating-characteristic curves. Results: pCR was achieved in 16 patients, and neoadjuvant chemotherapy caused a significant reduction of ∆tHbmean in pCR compared with non-pCR after the 2 chemotherapy courses. When the tentative ∆tHbmean cutoff values after the first and second courses were used, the ability to predict pCR was as follows: 81.2% sensitivity/47.0% specificity and 93.7% sensitivity/47.7% specificity, respectively. Comparison of the diagnostic performances of DOSI and 18F-FDG PET/CT revealed areas under the curve of 0.69 and 0.75 of ∆tHbmean after the first and second courses, respectively, which were lower than those of ∆SUVmax (0.90). Conclusion: DOSI predicted pCR in patients with breast cancer with moderate accuracy. The diagnostic performance of DOSI was inferior to that of the early metabolic response as monitored by 18F-FDG PET/CT.
Neoadjuvant chemotherapy (NAC) has been established as the standard of care for patients with locally advanced breast cancer (1). Although it is increasingly used in early breast cancer depending on the histologic subtype, further predictive tools are required as companion diagnostics to identify and treat patients with responsive disease.
Biofunctional imaging techniques for early response assessment may soon change the process of cancer management. Presently, 18F-FDG PET combined with CT is accepted as a noninvasive method for the early evaluation of the response to therapy because decreased glucose metabolism precedes tumor shrinkage (2). However, the expensive technology using 18F-FDG PET/CT during NAC has precluded its integration into clinical practice (3). Near-infrared optical imaging based on the visualization of the hemodynamic status of the tissue (such as oxyhemoglobin [O2Hb] and deoxyhemoglobin [HHb] concentrations) is reportedly promising for determining the physiologic status of tumor-bearing breast tissue and for monitoring early responses (4).
We recently established a time-resolved (TR)–diffuse optical spectroscopic imaging (DOSI) system (TRS20; Hamamatsu Inc.) for breast measurement and reported that elevation of the total hemoglobin (tHb) concentration in lesions compared with that of the background normal tissue reflects hypervascularity of the lesion (5). We hypothesized that changes in lesional tHb concentrations would indicate the degree of tumor angiogenesis during treatment, thereby predicting the therapeutic response.
Several recent studies have revealed that decreased lesional tHb concentrations observed on longitudinal DOSI scans can accurately distinguish pathologic responders to cytotoxic chemotherapy from others (6,7).
Therefore, we aimed to prospectively evaluate the diagnostic performance of sequential TR-DOSI scans for monitoring early chemotherapy response and primarily to determine whether changes in lesional tHb concentration measured after the first and second courses of cytotoxic drug administration can predict pathologic complete response (pCR) in patients with primary breast cancer. Secondarily, we compared the diagnostic performances of TR-DOSI and 18F-FDG PET/CT for predicting pCR.
MATERIALS AND METHODS
Patient Eligibility
Patients older than 18 y who had newly diagnosed, biopsy-proven breast cancer; clinical stage T1c-4, N0–2 primary breast cancer according to the TNM classification (sixth edition); and who planned to undergo at least 4 chemotherapy cycles were eligible for this prospective TR-DOSI chemotherapy monitoring study. The exclusion criteria included pregnancy, previous breast cancer treatment, bilateral breast cancer, or ineligibility for surgery. Patients enrolled at Saitama Medical University and Hamamatsu University, School of Medicine, participated in our TR-DOSI study. The institutional review board at each of these centers approved this study, and written informed consent was obtained from each patient. The study was conducted in accordance with the Declaration of Helsinki and was registered at the UMIN Clinical Trials Registry (no. 000011888). The physicians determined a standard-of-care chemotherapy regimen for each patient according to the patient’s age, cancer stage, and tumor subtype. All patients underwent breast-conserving surgery or a mastectomy with sentinel node biopsy or axillary dissection after completing their courses of chemotherapy.
Study Design
All patients in this study had previously undergone a mammogram, ultrasound, or contrast-enhanced MRI.
TR-DOSI was performed before treatment and after the first and second infusions of the anticancer drug (Fig. 1). Only patients with clearly visible lesions on ultrasound were considered evaluable and underwent sequential TR-DOSI scans. In our study, measurements were obtained an average of 18 d (range, 14–30 d) after the core biopsy and at day −2 to day 1 before the initial infusion of the anticancer drug. The subsequent assessments were taken at day −2 to day 1 before the second or third drug infusions. The patients also underwent 18F-FDG PET/CT scans (Biograph 6/16; Siemens) at baseline and 2–3 wk after the second course of NAC.

Longitudinal imaging study with 18F-FDG PET and DOSI. C1 = first chemotherapy course; C2 = second chemotherapy course; MMG = mammography; US = ultrasound.
TR-DOSI Scan Protocol
The system has been described previously in detail (8). In brief, after locating the tumor by ultrasound, a grid was manually drawn using a marker pen, mapping 7 × 7 points with 10-mm intervals between the points in the x–y dimension, with the tumor located at the center of the grid. A handheld probe with a 2.8-cm source-detector distance was brought into contact with each point on the breast, thus measuring the optical properties of the tissue at each point. The contralateral normal breast was also measured as a reference.
The imaging systems at the 2 institutions were confirmed to have comparable imaging quality and data acquisition capability before the start of the study. After the subtraction of water and lipid absorption (using the estimate that normal breast tissue comprises 18.7% water and 66.1% lipid) (9), tissue concentrations (μM) of O2Hb and HHb were calculated from the absorption coefficient at wavelengths of 760, 800, and 830 nm. The tHb concentration was recorded as the sum of O2Hb and HHb. The percentage of tissue oxygen saturation was defined as the ratio between the concentrations of O2Hb and tHb (O2Hb/tHb × 100). The region of interest (ROI; a circle measuring 2 cm in radius) was assigned to the skin, including the area of the target lesion and the adjacent normal tissue. In total, 10–14 points were included for each ROI. We set the ROI, showing the highest concentration of tHb above the lesion as identified by ultrasound. After all imaging studies were completed, the optical images acquired at baseline and after the first and second courses of chemotherapy were analyzed by 2 investigators masked to all medical and pathologic reports. The percentage change in the mean tHb (∆tHbmean) between the baseline and after chemotherapy was calculated as follows: (posttherapeutic tHbmean − baseline tHbmean)/baseline tHbmean × 100 (%).
18F-FDG PET/CT Scan Procedure
Patients with a clearly visible lesion at the baseline assessment underwent serial 18F-FDG PET/CT scans. The imaging protocol was designed to ensure SUV measurements across all time points. Blood glucose levels were measured in all patients before 18F-FDG administration; no patient had blood glucose levels exceeding 200 mg/dL. After fasting for at least 6 h, the patients received an intravenous injection of 18F-FDG (3.7–4.0 MBq/kg). After a 60-min uptake period, all images were acquired from the thigh level to the skull base with the patients’ arms raised using a PET/CT system combined with a 6- or 16-slice CT scanner. PET emission data were acquired in the 3-dimensional mode (2 min per bed position) and reconstructed using ordered-subsets expectation maximization. Tumor 18F-FDG uptake was quantified by SUV, which normalizes the measured tissue activity in an ROI by the injected dose and body weight, calculated by the tracer concentration per the following equation: (Bq/mL)/(injected activity [Bq]/patient body weight [g]).
All the PET/CT images were interpreted by experienced nuclear medicine physicians who were masked to all medical and pathologic information. When a hypermetabolic lesion was detected on PET/CT, the SUVmax was prospectively calculated, and the percentage change in ∆SUVmax was calculated as follows: (posttherapeutic SUVmax − baseline SUVmax)/baseline SUVmax × 100 (%).
Histopathologic Response
Resected surgical specimens were used as the reference standard for determining the residual disease status. The surgical specimens were cut into 0.5-cm-thick slices, fixed in 10% neutral-buffered formalin, and processed for histologic examination. For routine clinical practice, all slides sectioned from the paraffin-embedded blocks were reviewed and reported with respect to residual cancer cellularity, in situ disease, and the number of lymph nodes involved.
At least 2 experienced pathologists meticulously reviewed all surgical specimens and reached a consensus. A histopathologic response was assessed by applying the grading criteria to definitive surgery specimens in comparison with the initial core biopsy samples. The meta-analysis from Cortazar et al. showed that only pCR, defined as the absence of invasive cancer cells in the primary tumor and in lymph nodes, is associated with improved patient survival (10). In this study, however, we defined the primary endpoint of pCR as the absence of invasive cancer cells in the breast irrespective of the presence of lymph node infiltration by malignant cells (ypT0/is) (11). All other cases were classified as non-pCR.
Statistical Analysis
The Student t test was used when the data followed a normal distribution. Otherwise, the nonparametric Mann–Whitney U test was used. The χ2 test was performed to analyze the associations between 2 categoric variables. To identify an optimal threshold for pCR prediction, receiver-operating-characteristic curve analysis was performed by incrementally increasing the cutoff values. The area under the curve (AUC), sensitivity, specificity, positive predictive value (PPV), negative predictive value (NPV), and accuracy were obtained from the receiver-operating-characteristic curve analysis. A P value of 0.05 or less was considered statistically significant. Data were analyzed using statistics software (version 15.2.2; MedCalc).
RESULTS
Patients
Of the 100 patients who were enrolled between September 2013 and February 2015 from the 2 institutes, 84 patients (84%) were included in the TR-DOSI study and 64 patients (64%) were included in a comparison study of TR-DOSI and 18F-FDG PET. Patient characteristics are shown in Table 1. The number of patients included in each analysis are summarized in Supplemental Figure 1 (supplemental materials are available at http://jnm.snmjournals.org). After chemotherapy was completed, 39 patients (46.4%) underwent breast-conserving surgery. Histopathology revealed pCR in 16 (19%) and non-pCR in 68 (81%) of the 84 patients. pCR tumors had a significantly higher frequency of hormone-receptor negativity or human epidermal growth factor receptor 2 positivity than non-pCR tumors (P = 0.003). No difference was observed between pCR and non-pCR tumors with respect to patient age, tumor size, histology, or axillary involvement. The mean tumor depth from the skin as seen by ultrasound was 6.8 mm (range, 0–17.3 mm). The chemotherapy regimens administered in this study, including the doses and schedules, are summarized in Table 2.
Patient and Tumor Characteristics
Chemotherapy Regimens
Hemodynamic Response with TR-DOSI
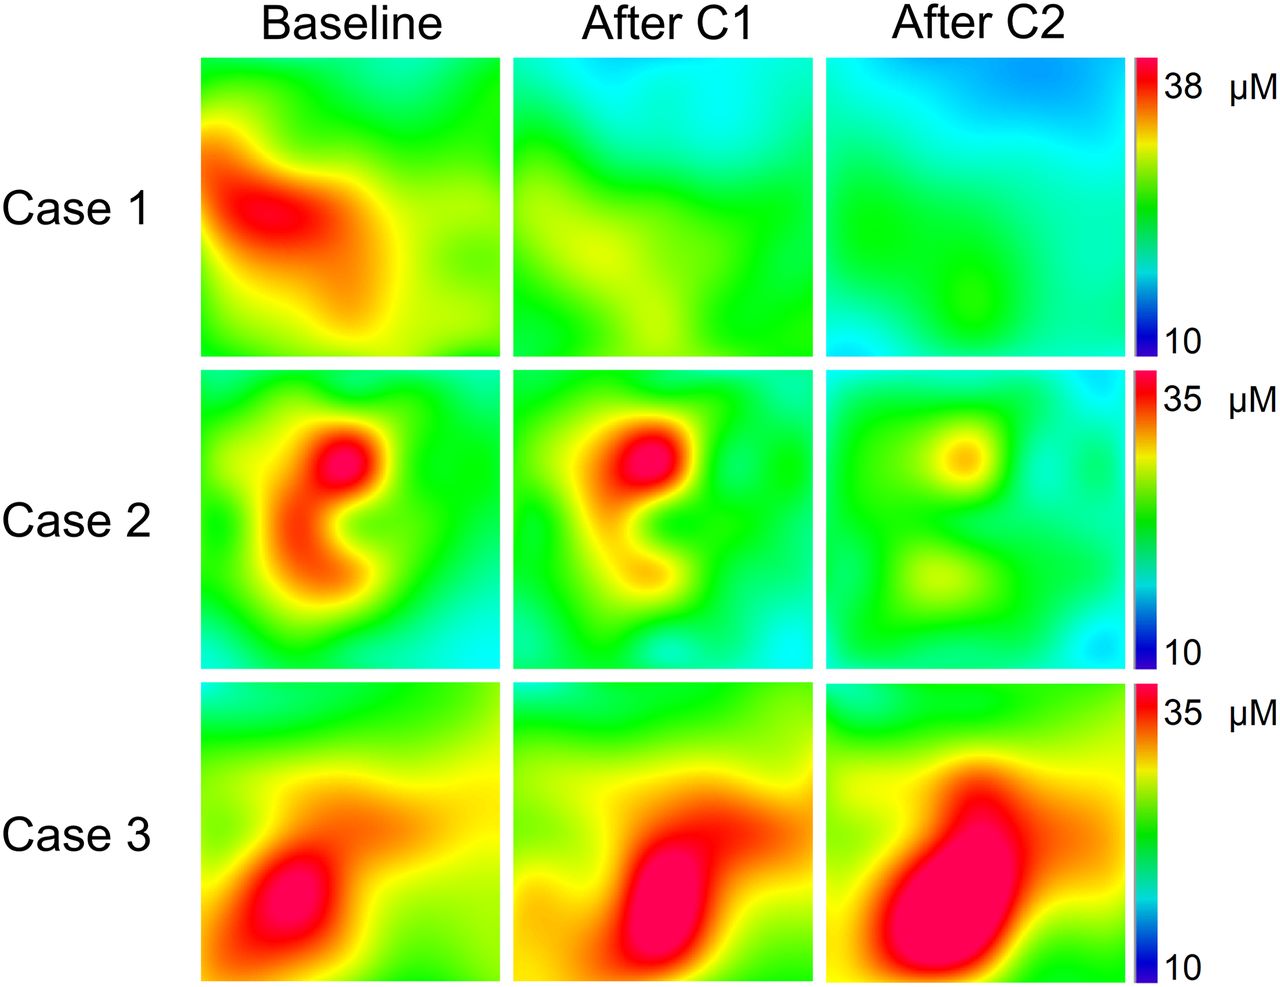
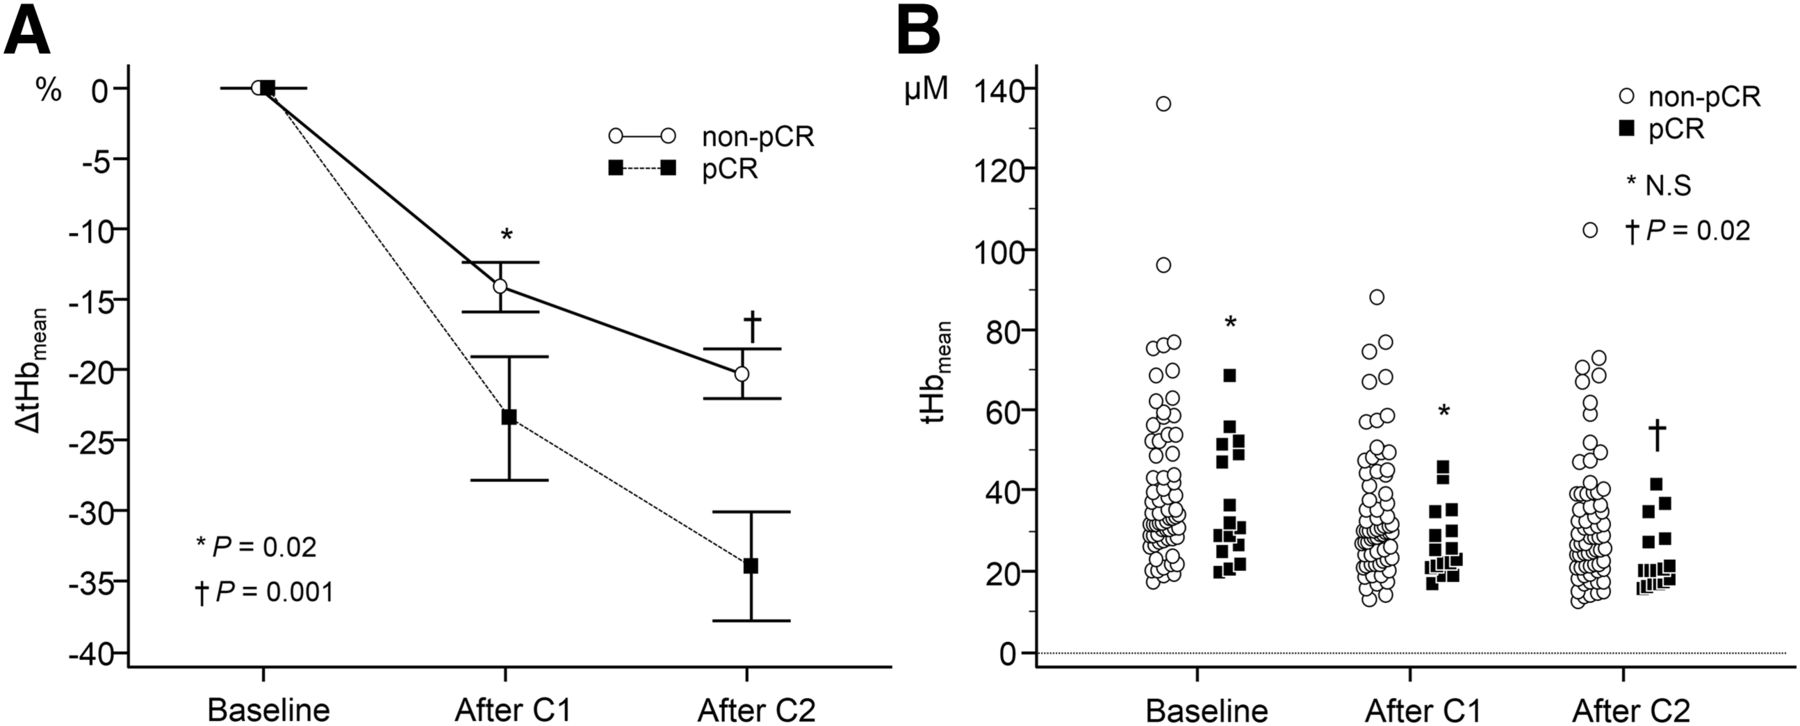
The first TR-DOSI scan was obtained at a median of −1 d (range, −2 to 1 d) before the first infusion. No significant differences were found in the baseline hemoglobin parameters between pCR and non-pCR irrespective of the intrinsic subtypes (Supplemental Table 1). The second and third scans were obtained at a mean (±SD) of 25.1 d ± 7.2 and 48.8 d ± 11.7 after the first infusion, respectively. Representative optical images of lesional tHb from 3 different subjects at baseline and after the first and second chemotherapy courses are shown in Figure 2. Figure 3A shows ∆tHbmean during chemotherapy in pCR and non-pCR lesions. pCR tumors showed a significantly larger decrease in ∆tHbmean after the first chemotherapy course (first-course ∆tHbmean) than did non-pCR tumors (mean, −23.4% ± 4.3 SE vs. mean, −14.1% ± 1.7 SE; P = 0.02) and after the second chemotherapy course (second-course ∆tHbmean) (mean, −33.9% ± 3.8 SE vs. mean, −20.2% ± 1.7 SE; P = 0.001). Figure 3B compares the absolute value tHbmean between pCR and non-pCR lesions. The tHbmean at baseline and after the first course did not differ between pCR and non-pCR tumors (baseline: median, 31.1; 95% confidence interval [CI], 25.7–49.8, vs. median, 33.5; 95% CI, 31.2–38.3 [P = 0.4]; and first course: median, 23.8; 95% CI, 20.8–31.5, vs. median, 29.8; 95% CI, 27.8–31.9 [P = 0.06]). The second-course tHbmean differed significantly between pCR and non-pCR tumors (median, 19.9; 95% CI, 16.8–27.3, vs. median, 28.0; 95% CI, 24.4–31.2 [P = 0.02]). The ability to predict pCR was as follows: sensitivity, 81.2%; specificity, 47.0%; PPV, 26.5%; NPV, 91.4%; and accuracy, 53.5%, with an optimal cutoff value of −12.4% for the first-course ∆tHbmean, and sensitivity, 93.7%; specificity, 47.7%; PPV, 30.0%; NPV, 96.9%; and accuracy, 56.6%, with an optimal cutoff value of −20.5% for the second-course ∆tHbmean.

Lesional total hemoglobin maps from 3 different subjects at baseline, after C1, and after C2. Each map shows a 60 × 60 mm measurement area that includes tumor and surrounding normal margin. (Top) Example of pCR. Tumor size was 22.0 mm before chemotherapy. (Middle) Example of 47.0-mm tumor that partially responded to chemotherapy. (Bottom) Example of 24.2-mm tumor that did not respond to chemotherapy. C1 = first chemotherapy course; C2 = second chemotherapy course.

(A) Change in tHbmean (∆tHbmean) during neoadjuvant chemotherapy in pCR and non-pCR. (B) Absolute value of tHbmean concentration at baseline, after C1, and after C2 in pCR and non-pCR. χ2 test was performed. C1 = first chemotherapy course; C2 = second chemotherapy course; N.S = not significant.
Metabolic Response with 18F-FDG PET/CT
Of the 69 patients who agreed to participate in the PET study and underwent sequential 18F-FDG PET/CT scans, 64 (92.7%) patients who had a tumor SUVmax greater than 3.0 at baseline were evaluated for PET-guided monitoring of their response to treatment (3). The patients’ distributions between the 2 studies were similar (Table 1). A significant decrease in ∆SUVmax was observed in pCR tumors compared with that of non-pCR tumors (mean, −72.5% ± 3.5 SE vs. −35.6% ± 3.4 SE; P < 0.0001). For an optimal threshold of ∆SUVmax set at −53.3%, the diagnostic performance for predicting pCR was as follows: sensitivity, 100%; specificity, 77.7%; PPV, 55.5%; and NPV, 100%. The diagnostic accuracy was 82.6%.
Comparison of TR-DOSI with 18F-FDG PET/CT
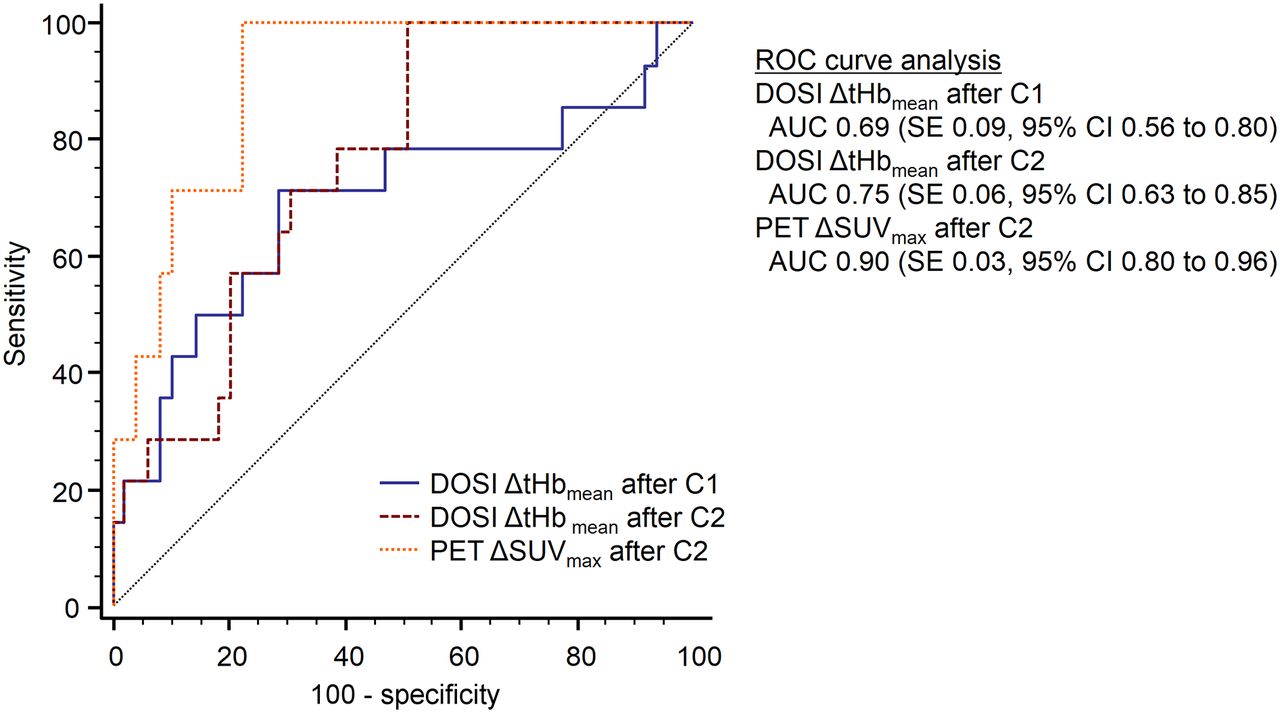
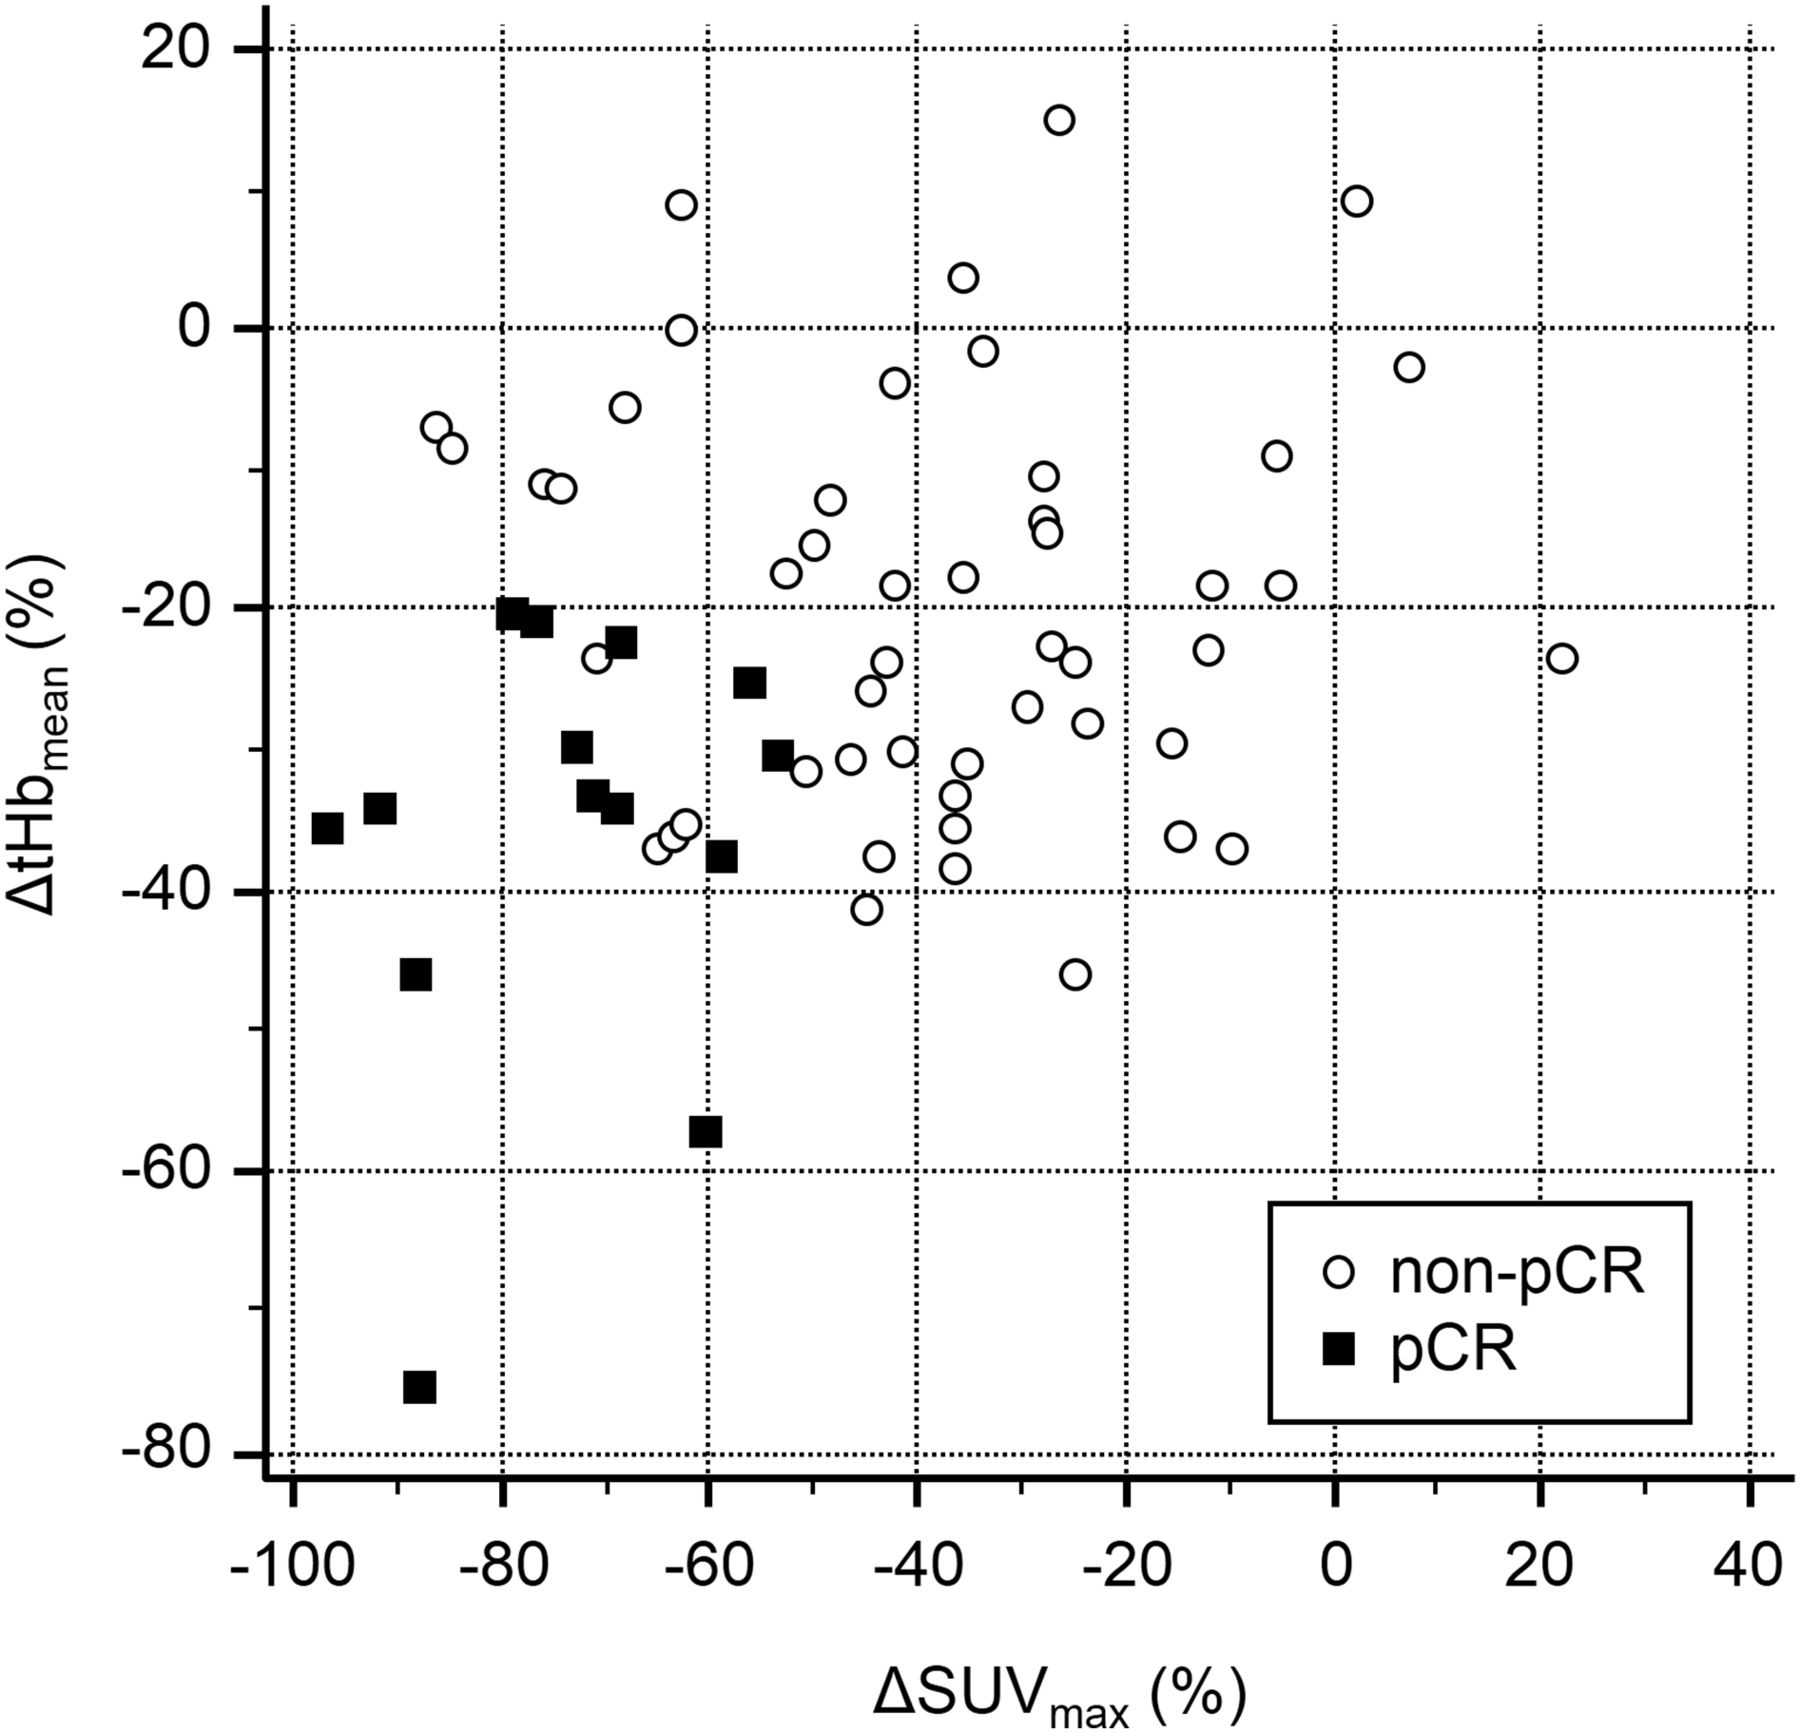
Comparison of the diagnostic performance for predicting pCR between TR-DOSI ∆tHbmean and 18F-FDG PET/CT ∆SUVmax using receiver-operating-characteristic curve analysis indicated that the AUCs of both first- and second-course ∆tHbmean were inferior to that with ∆SUVmax (Fig. 4). There was no significant difference between those of the first- and second-course ∆tHbmean. Scatterplots showed no significant linear correlation between second-course ∆tHbmean and ∆SUVmax (r = 0.23, P = 0.06; Fig. 5). When combined with second-course ∆tHbmean and ∆SUVmax using an optimal cutoff, the results were as follows: diagnostic accuracy, 93.7%; sensitivity, 100%; specificity, 92.0%; PPV, 77.7%; and NPV, 100%.

Comparison of diagnostic performance between DOSI ∆tHbmean and 18F-FDG PET ∆SUVmax for predicting pCR. Receiver-operating-characteristic (ROC) curve analysis indicated AUC of 0.69 for ∆tHbmean after C1, AUC of 0.75 for ∆tHbmean after C2, and AUC of 0.90 for ∆SUVmax. ∆tHbmean after C1 was significantly inferior to ∆SUVmax (P = 0.03); there were no significant differences between ∆tHbmean after C2 and ∆SUVmax (P = 0.06) and between ∆tHbmean after C1 and ∆tHbmean after C2 (P = 0.2). C1 = first chemotherapy course; C2 = chemotherapy course.

Scatterplots showed no significant linear correlation between 18F-FDG PET ∆SUVmax and DOSI ∆tHbmean (r = 0.23; 95% CI, −0.01 to 0.45; P = 0.06). Results using post–second-course ∆tHbmean and ∆SUVmax with optimal cutoffs for pCR identification were as follows: sensitivity, 100%; specificity, 92.0%; PPV, 77.7%; NPV, 100%; accuracy, 93.7%.
DISCUSSION
Early Response of Optical Hemodynamic Biomarker
Both the first- and the second-course ∆tHbmean for the pCR tumors decreased significantly more than those for the non-pCR tumors. In most of the pCR tumors, the lesional tHb decreased sharply after beginning chemotherapy and remained at a low level equivalent to that of the background tissue. In contrast, ∆tHbmean of non-pCR tumors varied greatly in response to chemotherapy. In half of the non-pCR patients, the tumor tHb concentration decreased by −20% or less. Consequently, although the specificity and PPV were low, the high sensitivity and high NPV of this method could help physicians exclude nonresponding patients early on in the course of NAC.
In contrast, baseline hemoglobin parameters, including tHb and oxygen saturation, did not differ between pCR and non-pCR (Supplemental Fig. 1). Optical researchers showed that tHb or oxygen saturation of pCR-achieving tumors was significantly higher than that of non-pCR tumors (12,13). This discrepancy may be explained by differences of technology and measurement procedures or physiologic variations of the baseline hemoglobin concentration.
Comparison Between TR-DOSI and 18F-FDG PET/CT
Comparison of TR-DOSI and 18F-FDG PET/CT for predicting pCR revealed that the AUC (0.75) after the second-course ∆tHbmean was inferior to the AUC (0.90) after the second-course ∆SUVmax. This finding indicates that 18F-FDG PET technology is more useful than tHb optical imaging with regard to the early prediction of tumor response. PERCIST is still well suited to early prediction of the tumor response to chemotherapy (14). Coudert et al. conducted a successful 18F-FDG PET–guided response-adopted randomized trial and revealed that the combination chemotherapy of bevacizumab and trastuzumab plus docetaxel had a higher pCR rate (43.8%) than that (24.0%) of trastuzumab plus docetaxel in human epidermal growth factor receptor 2–positive breast cancer that was less responsive to trastuzumab based on 18F-FDG PET/CT (15). In metabolic responders treated with trastuzumab plus docetaxel, the pCR rate was close to 54%.
Although optical imaging could be a low-cost alternative to 18F-FDG PET/CT, tHb measurements alone may not be enough to replace tumor glycolysis measurements for predicting histologic outcomes. The weak linear correlation (r = 0.23, P = 0.06) we observed between ∆tHbmean and ∆SUVmax demonstrates the significance of using multiple parameters to assess the response to chemotherapy (Fig. 5). The combined results from TR-DOSI and 18F-FDG PET/CT distinguished pCR from non-pCR with an accuracy of 93.7%, which was higher than that of either modality alone (18F-FDG PET/CT accuracy, 82.6%, and DOSI accuracy, 56.6%). This result suggests that the response of breast cancer to chemotherapy is complex and multifactorial—that is, the use of multiparametric and multimodal imaging biomarkers may more precisely stratify the tumor response (16). The present criteria used for histologic assessment depend on the degree of cancer cell eradication and tumor shrinkage; however, tumor stromal changes, such as remodeling of the vasculature, are not considered. Therefore, a subgroup of patients classified as non-pCR might have responded but simply were not recognized as having responded under the current classification system. Further study is required to clarify whether assessment of early tHb response using TR-DOSI will translate into survival benefits.
Further work is required to overcome the limitations of the present study. First, systemic stratification of intrinsic subtypes is recommended when conducting a clinical study because different biologic characteristics and administration of targeted drugs may influence tumor vascularity. Previous 18F-FDG PET studies demonstrated that triple-negative breast cancers are more intensely 18F-FDG–avid than others (17,18). A prospective comparison study stratified by intrinsic subtype with identical regimes for all patients is required. Second, although pCR is a suitable surrogate prognostic marker in patients with breast cancer, a recent meta-analysis of neoadjuvant trials has understated the importance of pCR in patients with luminal tumors (10).
We had 3 reasons why we defined the primary endpoint as pCR with ypT0/is irrespective of lymph node involvement. First, unlike 18F-FDG PET/CT, TR-DOSI can only measure primary tumors, including the surrounding normal tissue, but cannot detect axillary metastatic lymph nodes. Second, our aim was to evaluate the correlation between early tHb changes of the primary tumor and the histologic response of the primary tumor after completion of neoadjuvant chemotherapy. Third, we consider the knowledge of the primary tumor achieving a pCR as still being informative because the surgeon may decide to perform minimal breast-conserving surgery on the patient.
The TR-DOSI and PET comparison study included only 64 patients because some patients refused further exposure to radiation or for financial reasons.
There are several limitations of DOSI technology. First, the measurement of optical absorption is limited to the reach of photons and up to only a few centimeters depth from the skin. The entire tumor blood volume cannot be observed using this approach, which may result in partial-volume effects. In addition, the chest wall thickness can be tilted at different angles, thereby compromising the measurement (19). Second, the low sensitivity and poor spatial resolution of this technique may decrease the reproducibility of the results. Some investigators have argued that the use of ultrasound- or MRI-guided diffuse optical tomography may provide better results than DOSI alone, which could improve the quality of the study (20,21). Third, no consensus has been reached for determining the ROI of the lesional tHb regarding user and device independence. Fourth, our TR-DOSI cannot assess the tissue content of water and lipid. To improve the diagnostic accuracy, more data should be acquired at the longer wavelengths that are absorbed by water and lipids.
CONCLUSION
To the best of our knowledge, the present prospective study is the first to demonstrate that the early tHb response of a tumor to chemotherapy can be used to identify pCR with moderate accuracy and with a lower diagnostic performance than the 18F-FDG PET/CT response classification in numerous patients with breast cancer. However, the combination of DOSI and 18F-FDG PET/CT improved the diagnostic performance over that of each modality alone. This noninvasive DOSI technology has the potential to provide complementary information for directing individualized therapy.
DISCLOSURE
The costs of publication of this article were defrayed in part by the payment of page charges. Therefore, and solely to indicate this fact, this article is hereby marked “advertisement” in accordance with 18 USC section 1734. No potential conflict of interest relevant to this article was reported.
Acknowledgments
We thank Yutaka Yamashita, Motoki Oda, Etsuko Omae, Hiroyuki Suzuki, and Kenji Yoshimoto for their technical support; Noriko Wakui for her help with patient measurements; Hiroko Shimada, Ikuko Sugitani, Michiko Sugiyama, and Eiko Hirokawa for their contribution to patient enrollment; and Enago (www.enago.jp) for the English language review.
Footnotes
Published online Mar. 3, 2016.
- © 2016 by the Society of Nuclear Medicine and Molecular Imaging, Inc.
REFERENCES
- Received for publication September 24, 2015.
- Accepted for publication February 17, 2016.


Jump to section
Related Articles
Cited By...
- Changes in Diffuse Optical Tomography Images During Early Stages of Neoadjuvant Chemotherapy Correlate with Tumor Response in Different Breast Cancer Subtypes
- Theranostics Using Antibodies and Antibody-Related Therapeutics
- A Comparison of Near-Infrared Diffuse Optical Imaging and 18F-FDG PET/CT for the Early Prediction of Breast Cancer Response to Neoadjuvant Chemotherapy