


Abstract
The purpose of this study was to evaluate the value of an 18F-FDG PET/CT–based interpretation system (Hopkins criteria) to assess the therapy response and survival in lung cancer. Methods: This is an Institutional Review Board–approved, retrospective study. A total of 201 patients with biopsy-proven lung cancer, who underwent therapy assessment 18F-FDG PET/CT within 6 mo (mean, 7.5 wk) of completion of treatment, were included. Patients were primarily treated with surgical resection, chemotherapy, radiation therapy, or a combination of these treatments. PET/CT studies were interpreted by 2 nuclear medicine physicians, and discrepancies were resolved by a third interpreter. The studies were scored using a qualitative 5-point scale for the primary tumor, mediastinum, distant metastatic site, if present, and overall assessment. Scores 1, 2, and 3 were considered negative and scores 4 and 5 were considered positive for residual disease. Patients were followed for a median of 12 mo (up to 128 mo). Kaplan–Meier plots with a Mantel–Cox log-rank test were performed considering death as the endpoint. Results: Overall, the PET/CT studies were positive in 144 (71.6%) and negative in 57 (28.4%) patients. There was substantial agreement between 2 interpreters (R1, R2), with a κ of 0.78 (P < 0.001). The sensitivity, specificity, positive predictive value, negative predictive value, and accuracy of the Hopkins scoring system were 89%, 80%, 92.8%, 71.4%, and 86.7%, respectively. Overall, PET/CT resulted in starting a new treatment plan in 70.8% of patients with positive residual disease on therapy assessment PET/CT. There was a significant difference in overall survival (OS) between patients who were categorized as positive in comparison to those who were categorized as negative (hazard ratio [HR] = 2.12; 95% confidence interval = 1.44–3.12), which remained significant after adjustment for disease stage, prior clinical suspicion, and primary treatment. Subgroup analysis according to the tumor histology showed that positive Hopkins scoring could significantly predict the OS in both small cell lung cancer (HR = 2.88; log-rank, P = 0.02) and non–small cell lung cancer (HR = 2.01; log-rank, P = 0.001). Similarly, there was a significant difference in OS between patients with positive and negative Hopkins score both in those who had surgical resection as part of the primary treatment (HR = 6.09; log-rank, P < 0.001) and in those who were treated with chemotherapy with or without radiation (HR = 1.60; log-rank, P = 0.02). Conclusion: The 5-point qualitative therapy response interpretation for lung cancer has substantial interinterpreter agreement and high accuracy and could significantly predict survival in lung cancer, irrespective of tumor histology and treatment modality.
Lung cancer accounts for about 13% of all cancer diagnoses in the United States. The American Cancer Society estimated that 221,200 new cases of lung cancer would occur in 2015. An estimated 158,040 deaths were expected to occur due to lung cancer in 2015, accounting for about 27% of all cancer deaths, making lung cancer accountable for more deaths than any other cancer in both men and women (1,2). The 5-y survival rate in lung cancer patients is less than 15% (2).
18F-FDG PET/CT is well integrated in the routine staging of lung cancer patients. The use of 18F-FDG PET/CT could provide more accurate staging of nodal and metastatic sites than CT and has a high negative predictive value (3–5). Studies have also shown that preoperative staging PET/CT leads to change in the treatment planning and reduces the frequency of futile thoracotomies and the total number of thoracotomies (6,7). PET-based quantitative parameters have been proposed as reliable indicators of survival in patients with lung cancer in both pretreatment and posttreatment settings (8–12). In the posttherapy setting, several studies point to the usefulness of monitoring the treatment response based on decreased SUVs on serial 18F-FDG PET imaging of the primary tumor (4,8). Higher volume of residual metabolically active tumor after definitive treatment appears to be associated with poorer survival (13,14). However, the routine use of PET/CT for response evaluation in lung cancer is currently not recommended in the guidelines (4).
A qualitative therapy response assessment system that is simple and easily reproducible that can predict treatment response and outcome will be of great help in this setting. Our previous work has shown that employment of such a criterion for PET/CT therapy response assessment in patients with head and neck squamous cell carcinoma has substantial interinterpreter agreement and could serve as a surrogate marker for prediction of outcome (15). The objective of this study was to validate the Hopkins criteria for therapy response assessments for 18F-FDG PET/CT and establish its predictive value for survival outcome in lung cancer.
MATERIALS AND METHODS
Eligible Patients and Follow-up
This was an Institutional Review Board–approved retrospective study performed under the waiver of informed consent. The guidelines of the Health Insurance Portability and Accountability Act were followed. Two hundred one histopathology-confirmed lung cancer patients who were evaluated and treated at our institution from May 2000 to January 2013 were included. The patients were treated with surgical resection, chemotherapy, radiation therapy, or a combination of any of these treatment modalities. Patients underwent posttherapy 18F-FDG PET/CT within 24 wk of treatment completion. The posttreatment 18F-FDG PET/CT studies were requested at the treating clinician’s discretion for therapy response assessment. 18F-FDG PET/CT studies performed after 24 wk of treatment completion were considered as a follow-up study rather than a posttreatment assessment and were excluded. Patients with a second primary malignancy were also excluded.
Image Analysis
Posttherapy Assessment PET/CT Interpretation Criteria (Hopkins Criteria)
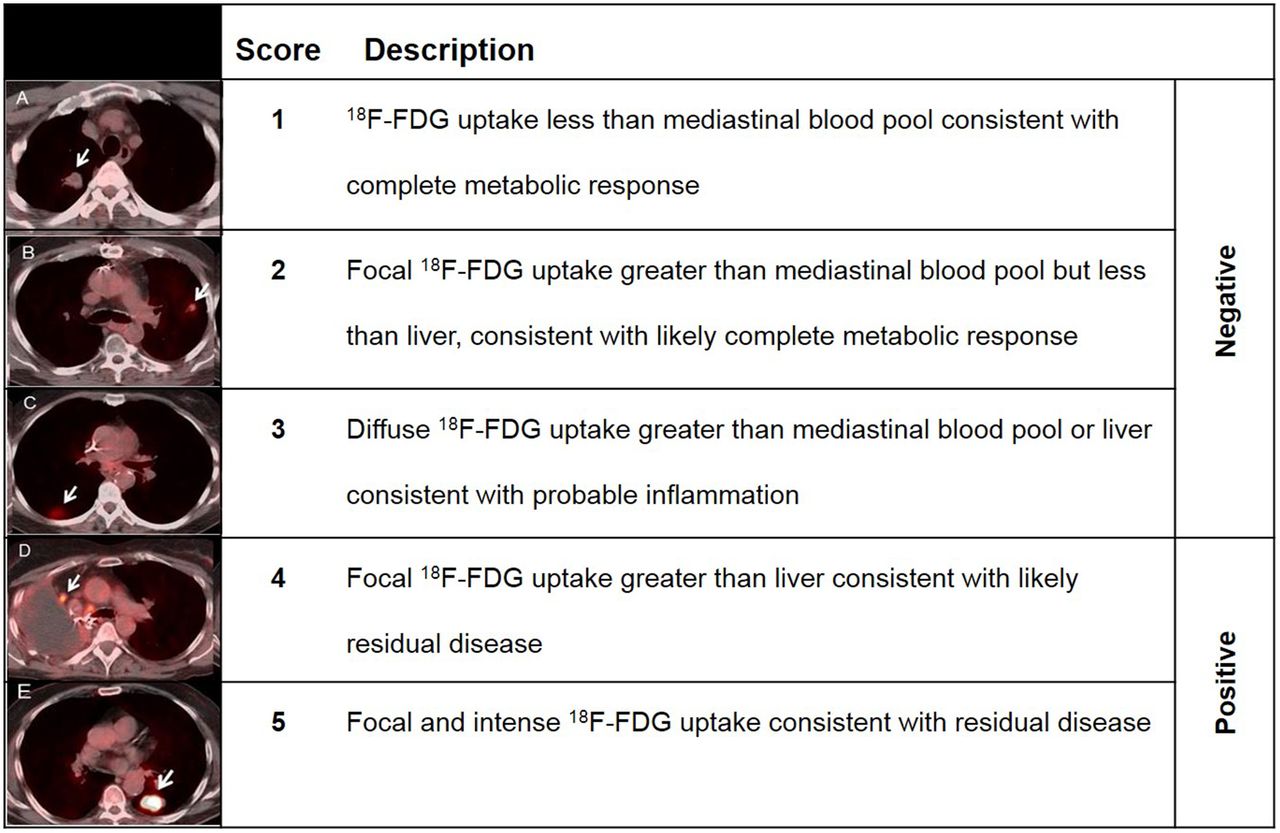
The studies were scored using a qualitative 5-point scale, for the primary tumor, locoregional disease in the mediastinum, and distant metastatic sites. The activity in the mediastinal blood pool was taken as background blood pool for reference. Focal 18F-FDG uptake less than or equal to mediastinal blood pool was scored as 1, consistent with complete metabolic response. Focal 18F-FDG uptake greater than mediastinal blood pool but less than liver was scored 2, likely complete metabolic response. Diffuse 18F-FDG uptake greater than mediastinal blood pool or liver was scored 3, likely inflammatory changes. Focal 18F-FDG uptake greater than liver was scored 4, likely residual tumor. Focal and intense 18F-FDG uptake greater (2–3 times) than liver was scored 5, consistent with residual tumor (Fig. 1).

Five-point qualitative posttherapy assessment scoring system (Hopkins criteria) for lung cancer.
Definition of Positive and Negative PET/CT Studies
On the basis of the qualitative 5-point scale, the studies were grouped as positive or negative for the primary tumor, mediastinum, and distant metastatic lesions. Overall assessment is denoted by the overall score, which is the highest score among the scores for the primary tumor and locoregional and distant metastatic lesions, if present. Scores 1, 2, and 3 were considered negative and scores 4 and 5 were considered positive for residual tumor.
Interpreter Qualifications
The PET/CT studies were retrieved from an institutional archiving system (Johns Hopkins Hospital PACS) and reviewed using the MimVista viewing platform (version 6.3.2; MimVista Software Inc.). All images were interpreted independently by 2 board-certified nuclear medicine physicians (interpreter 1, interpreter 2) masked to patients’ outcome and scored according to the 5-point Hopkins scoring criteria (Table 1). Interpreter 1 is completing a 2-y PET/CT fellowship after nuclear medicine board certification. Interpreter 2 is a current T32 PET/CT research fellow after nuclear medicine residency and board certification. Any discrepancies were adjudicated by a third interpreter who is an associate professor of radiology, dual-board-certified in nuclear medicine and radiology. The final scan report was determined if all interpreters or 2 of the 3 interpreters agreed on the dichotomous classification (i.e., positive or negative scores).
Characteristics of 201 Patients Included in Study
Outcome Measures
Histopathologic confirmation of the lesions identified on the PET/CT, alternative imaging modalities such as CT/MRI, or clinical follow-up of 6 mo after PET/CT were considered as the reference standard. The sensitivity and specificity, positive predictive value, negative predictive value, and accuracy of the posttherapy PET/CT assessment criteria along with 95% confidence intervals (CIs) were calculated by constructing the 2 × 2 contingency table (cross-relating PET/CT results of the reference standards). Overall survival (OS) was defined as the time (mo) interval between the date of the posttherapy 18F-FDG PET/CT study and the date of death. The date of the scan was recorded from the electronic medical record of each patient, and the date of death was extracted from the electronic medical records or a public registry of death (16). The survival data for patients who were alive were censored at the last follow-up date at our institution.
Statistical Analysis
Descriptive values are presented as mean (SD) or median (25th, 75th range) if the data were not in a normal distribution. Categoric variables were presented as frequency (percentage). The Cohen κ coefficient (κ) was calculated to measure interinterpreter agreement. Survival probabilities were generated using Kaplan–Meier survival curves and compared using the Mantel–Cox log-rank test. Univariate and multivariate Cox regression analyses were performed considering death as the endpoints. Subgroup analysis was performed to assess the impact of tumor histology and prior treatment on the prognostic value of Hopkins scoring. The statistical significance level was set at a P value of less than 0.05. Statistical analysis was performed using IBM SPSS Statistics 22.0.
RESULTS
Patient Characteristics and Follow-up
Two hundred one patients were included in the study (116 men, 85 women; mean age ± SD, 63 ± 11 y). A history of smoking was present in 156 patients (77.6%). The histology of the primary lung malignancy was identified as small cell lung cancer in 34 patients (16.9%) and non–small cell lung cancer in 167 patients (83.1%). The demographic details of the 201 patients included in the study have been summarized in Table 1. The median follow-up of these patients was 12 mo (range, 0–128 mo) after completion of the posttherapy assessment PET/CT.
Time Interval of Posttherapy PET/CT
Therapy assessment 18F-FDG PET/CT was performed between 1 and 24 wk after completion of treatment. The average interval between the date of completion of treatment and the posttreatment 18F-FDG PET/CT study was 7.5 wk (median, 5 wk; range, 1–24 wk). Of the 201 studies, 129 (64.2%) were performed within 8 wk, 18 (9.0%) were performed between 8 and 12 wk, and 54 (26.9%) were performed between 12 and 24 wk of treatment completion. Of 201 patents with posttherapy 18F-FDG PET/CT, 114 (56.7%) also underwent baseline 18F-FDG PET/CT before the initiation of treatment. There was no significant difference between the ratio of each Hopkins criteria score in patients who underwent both baseline and posttherapy PET/CT scanning (n = 114) compared with those with only posttherapy scanning (n = 87) (trend P = 0.33).
Interpreter Classification of PET/CT Studies
The Cohen κ coefficient (κ) analysis indicated that there was substantial agreement (17) between 2 interpreters (R1, R2), with a κ of 0.78 (P < 0.001). Any discrepancies between the 2 interpreters (29 of 201 studies, 14.4%) were resolved by a third interpreter (R3). On the basis of the final scores, 144 studies (71.6%) were categorized as positive, and 57 studies (28.4%) were categorized as negative for residual disease by overall assessment. Of the positive PET/CT studies, the residual disease was identified in the primary site (89 studies, 61.8%), the mediastinum (37 studies, 25.7%), and the distant metastatic sites (17 studies, 11.8%) and in 1 (0.7%) study in both mediastinum and distant sites. Of the PET/CT studies that were categorized as negative, 38 studies (66.7%) were scored 1 or 2, and 19 studies (33.3%) were scored 3.
According to the original retrospective report of the 18F-FDG PET/CT in electronic medical records, PET/CT findings were considered positive in 146 patients, negative in 42 patients, and indeterminate in 13 patients. When the indeterminate studies were considered negative, the Cohen κ coefficient (κ) analysis showed substantial agreement between the original retrospective PET/CT report and Hopkins-based conclusion (positive/negative), with a κ of 0.78 (P < 0.001).
Accuracy of Scoring System
Six of the 201 studies (3%) did not have reference standard data for comparison required for diagnostic accuracy estimation. The reference standards were histopathology in 35.4% (69/195) and clinical or alternative imaging follow-up 6 mo after PET/CT in 64.6% (126/195) of studies. Table 2 summarizes the 2 × 2 table. The sensitivity, specificity, positive predictive value, negative predictive value, and accuracy of the scoring system were 89% (82.7%–93.6%), 80% (66.3%–90%), 92.8% (87.3%–96.04%), 71.4% (58.5%–81.6%), and 86.7%, respectively.
Diagnostic Accuracy Estimation of 5-Point Qualitative Posttherapy Assessment Scoring System (Hopkins Criteria) for Lung Cancer Follow-up
PET/CT Results
Added Value to Prior Clinical Assessment
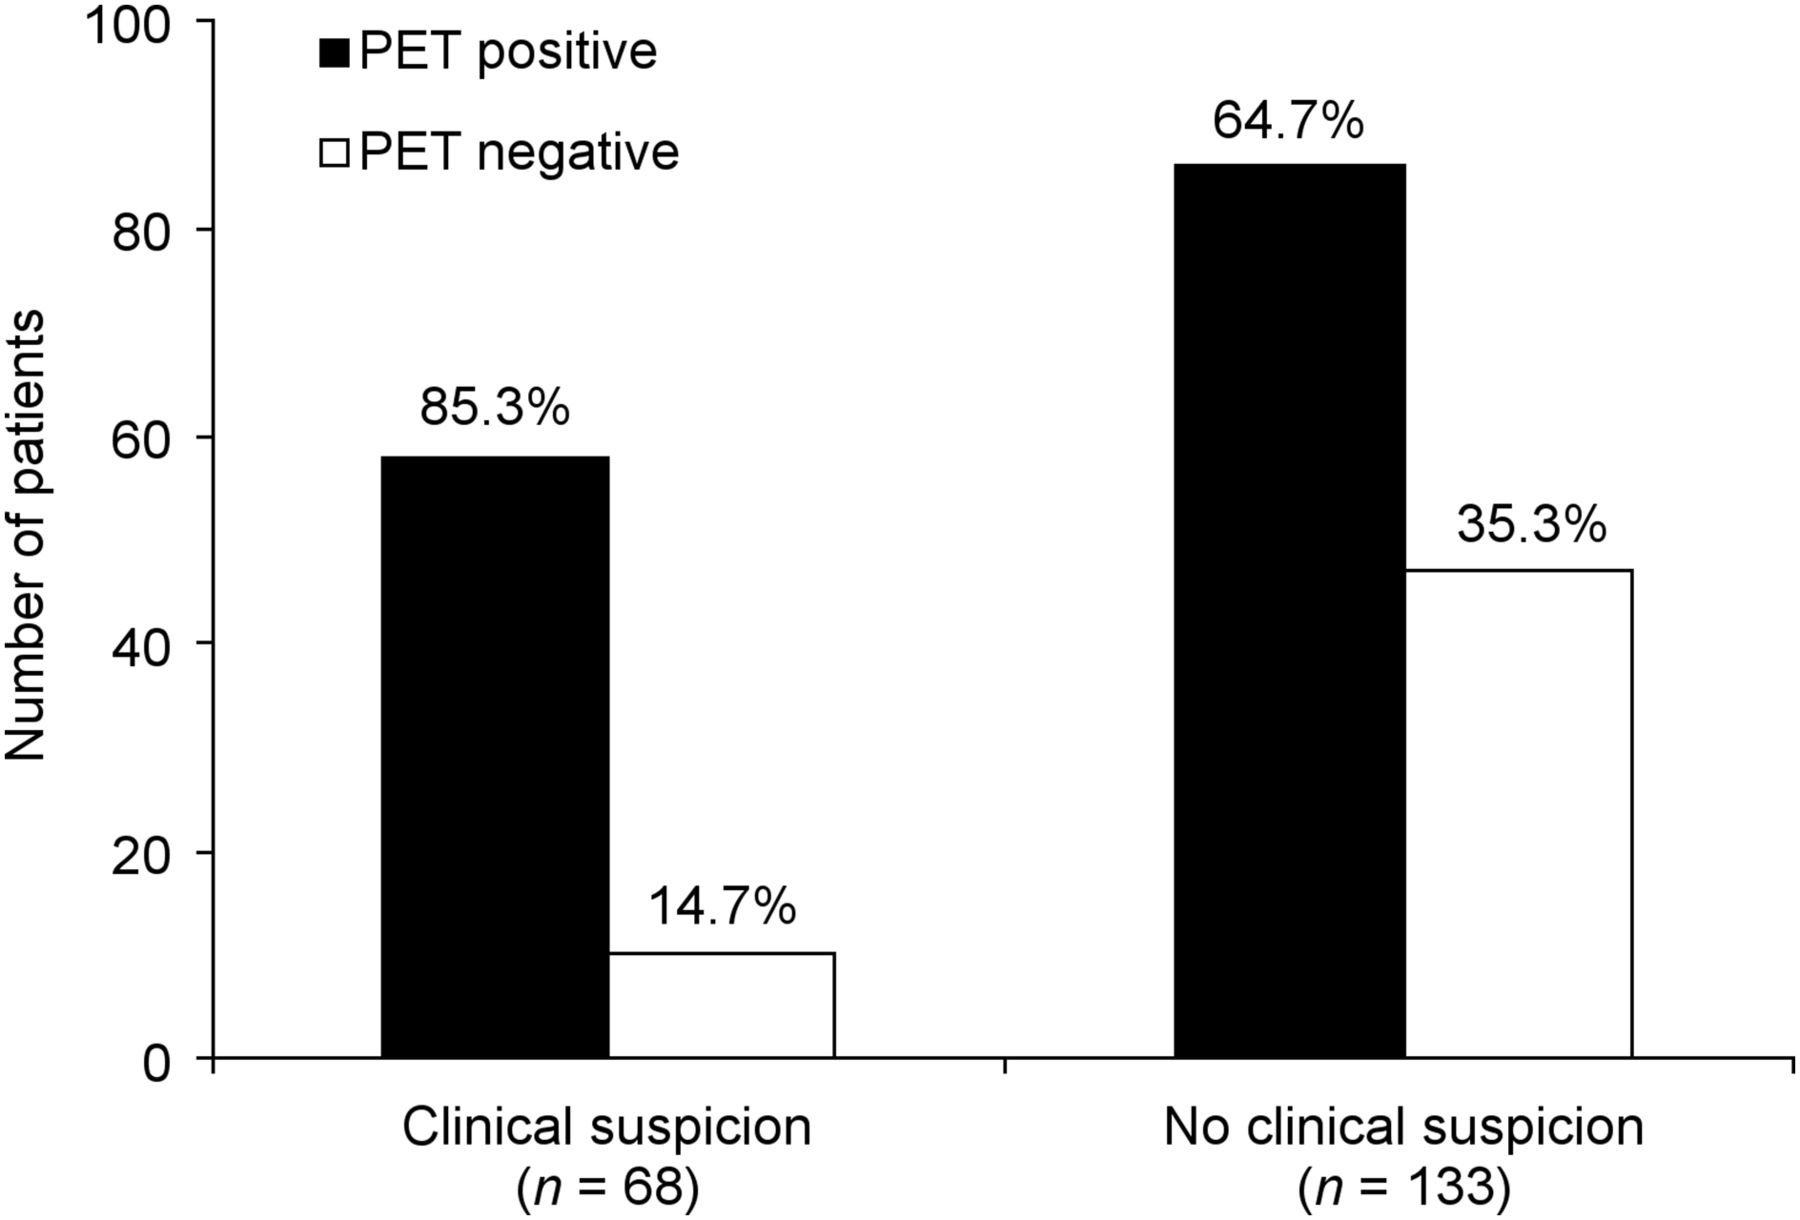
Of the 201 therapy assessment scans, 133 were obtained without prior clinical or imaging suspicion of progression, and 68 were obtained with prior clinical or imaging suspicion. In the context of prior clinical assessment, PET/CT identified a potential site of residual disease or metastases in 64.7% (86/133) of scans requested with no prior clinical suspicion, of which 95.1% (78/82, 4 missing data) were confirmed through histopathology or a clinical/imaging follow-up of 6 mo after PET/CT study.
Among the patients who underwent PET/CT to evaluate for clinically suspected residual disease, PET/CT identified a potential site of residual disease in 85.3% (58/68) of scans, which were confirmed by reference standard in 94.4% (51/57, 1 missing data). PET/CT ruled out residual disease (showed complete metabolic response to treatment) in 14.7% (10/68) of scans requested with prior clinical or imaging suspicion (Fig. 2).

Added value of PET/CT to clinical assessment. PET/CT was helpful in excluding tumors in 14.7% (10/68) of scans ordered with clinical or imaging suspicion of recurrence and identifying recurrence in 64.7% (86/133) of scans ordered with no prior clinical or imaging suspicion.
Overall, PET/CT resulted in starting a new treatment plan in 70.8% of patients (102/144) with positive residual disease on posttreatment PET/CT. Of those, 26 patients (25.5%) underwent surgical tumor resection, 44 patients (43.2%) received palliative or new chemotherapeutic regimen, 24 patients (23.5%) underwent radiation therapy, and 8 patients (7.8%) received combined chemoradiation therapy. Eighteen percent of patients (26/144) with positive posttreatment PET/CT did not undergo new treatment (continue the previous chemotherapy regimen or undergo watchful follow-up). The treatment stopped in 4.2% of patients (6/144) because of patients’ preference (4 patients) and poor tolerance to systemic therapy (2 patients). The treatment impact was unknown in 7% of patients (10/144).
Therapy Assessment Score and Survival Outcome in All Patients (n = 201)
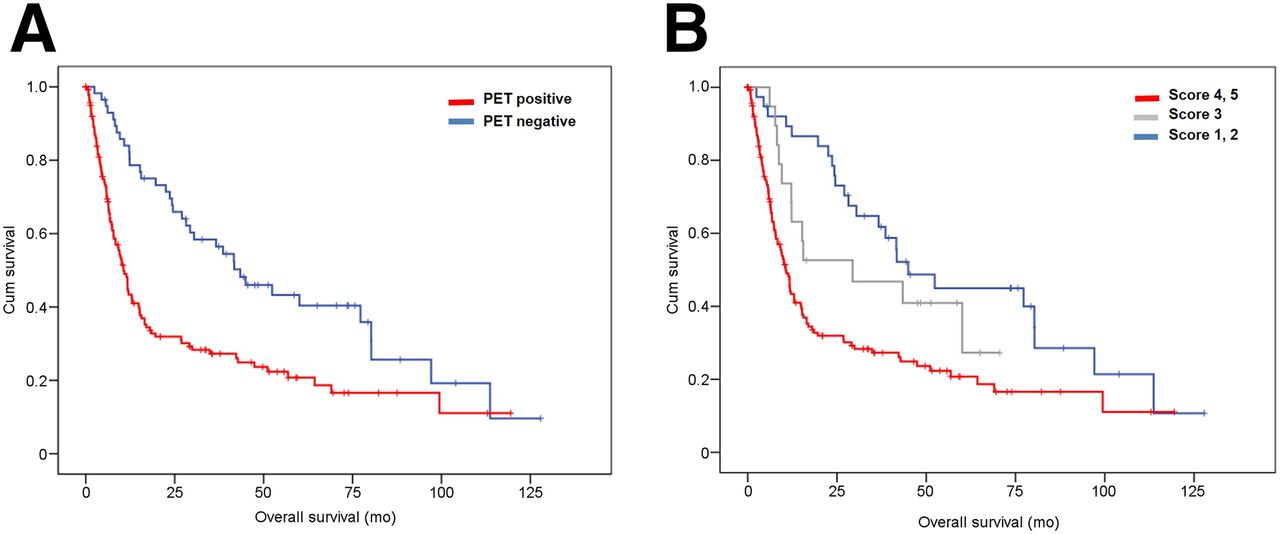
The median follow-up of the study population was 12 mo (range, 0–128 mo) from the date of the PET/CT, and 137 (68.2%) patients died within the period of the study. The median survival in the PET-positive group was 9 mo (range, 0–119 mo), and 101 (70.1%) patients died in this group. In contrast, in the PET-negative group the median survival was 37.3 mo (range, 2–128 mo; P < 0.001), and 36 (63.2%) patients died in this group. The Kaplan–Meier survival analysis showed a significant difference in the OS between patients who were categorized as positive by the 5-point interpretation scale, compared with those who were categorized as negative (log-rank, P < 0.001), with a hazard ratio (HR) of 2.12 (95% CI, 1.44–3.12) (Fig. 3A). The result remained significant in multivariate Cox regression analysis after adjustment for potential confounders including disease stage, prior clinical suspicion, and primary treatment modality (P = 0.002) (Table 3).

Kaplan–Meier survival plot by PET/CT 5-point interpretation criteria. (A) OS (mo) between patients who were categorized as positive (red line) and negative (blue line) differed significantly (n = 201; log-rank, P < 0.001; HR = 2.12 [95% CI = 1.44–3.12]). (B) OS (mo) differed significantly between patients who were scored as 4 or 5 (red line) versus 3 (gray line) versus 1 or 2 (blue line) by 5-point posttherapy interpretation criteria (log-rank, P < 0.001).
Univariate and Multivariate Cox Regression Analysis
In overall assessment by the 5-point interpretation scale, a significant trend in the difference in OS between patients who were scored 1 or 2 (n = 38) versus those who were scored 3 (n = 19) versus those who were scored 4 or 5 (n = 144) was observed (log-rank, P < 0.001) (Fig. 3B).
Survival Outcomes: Impact of Tumor Histology and Treatment Modality
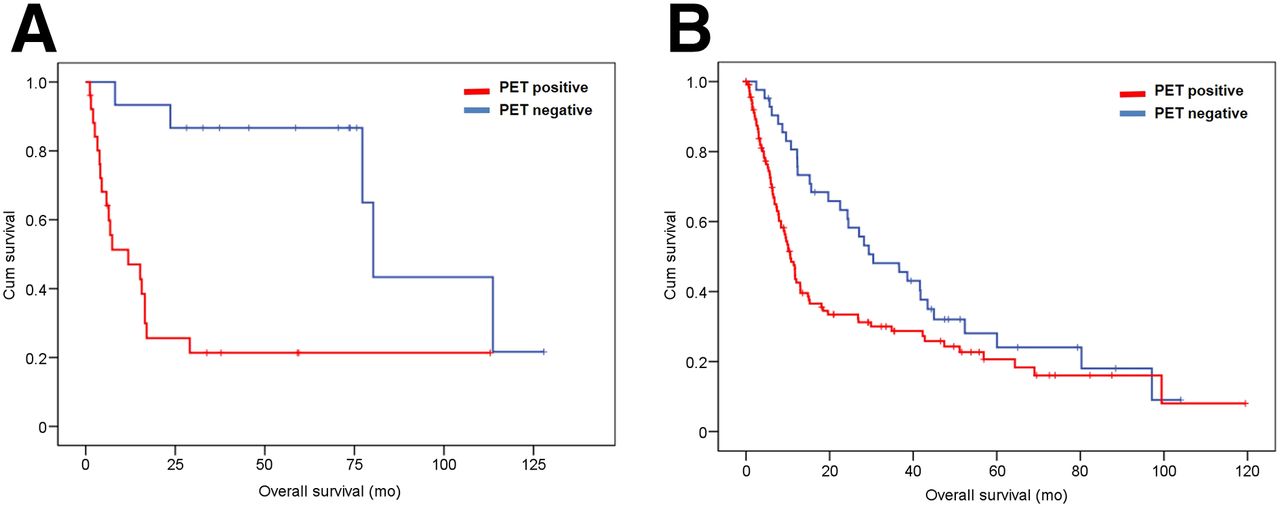
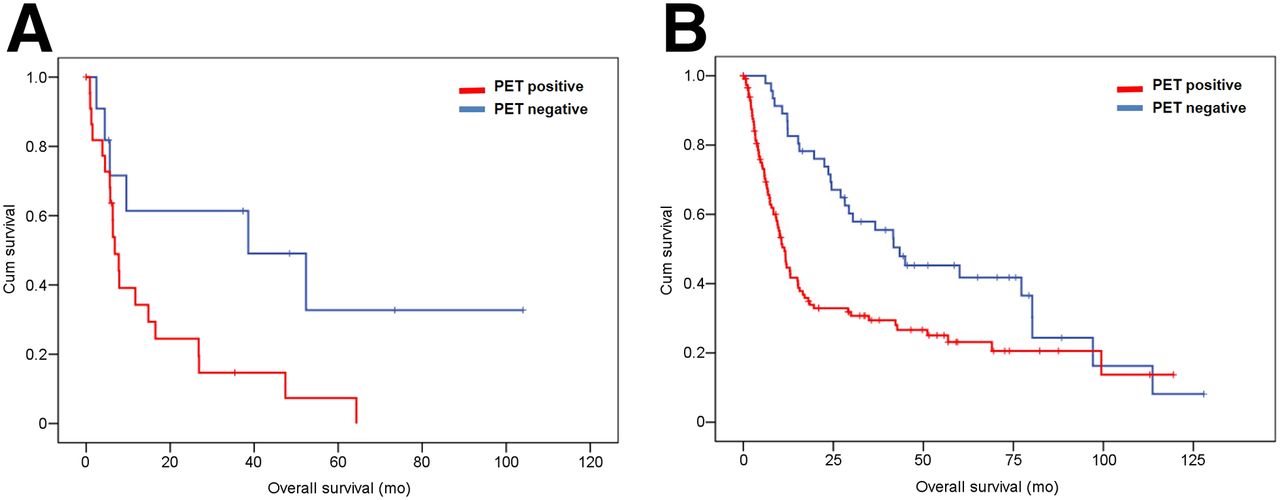
According to the tumor histology, 34 patients were diagnosed with small cell lung cancer and 167 patients had non–small cell lung cancer. The Kaplan–Meier analysis showed a significant difference in OS of small cell lung cancer patients who had a positive PET/CT result (median survival, 6.4 mo; 20 deaths) and those who had a negative result (median survival, 37.3 mo; 6 deaths) (log-rank, P = 0.022), with an HR of 2.88 (95% CI, 1.12–7.39). Similarly, in patients with non–small cell lung cancer, OS was significantly lower in patients with a positive PET/CT result (median survival, 9.6 mo; 81 deaths) than in those with a negative PET/CT result (median survival, 38.05 mo; 30 deaths) (log-rank, P = 0.001), with an HR of 2.01 (95% CI, 1.31–3.07) (Fig. 4).

Kaplan–Meier survival plot by PET/CT result and tumor histology. OS (mo) between patients who were PET-positive (red line) and PET-negative (blue line) was significantly different between patients with small cell lung cancer (n = 34; log-rank, P = 0.022; HR = 2.88 [95% CI = 1.12–7.39]) (A) and those with non–small cell lung cancer (n = 167; log-rank, P = 0.001; HR = 2.01 [95% CI = 1.31–3.07]) (B).
Among the 41 patients who had surgical resection as part of their primary treatment, 15 had negative (median survival, 70.5 mo; 5 deaths) and 26 had positive (median survival, 7.1 mo; 19 deaths) postoperative PET/CT scan results. Among 160 patients who were treated with chemo- or radiation therapy, posttherapy PET/CT results were negative in 42 patients (median survival, 28.8 mo; 31 deaths) and positive in 118 patients (median survival, 9.1 mo; 82 deaths). Positive Hopkins scoring could significantly predict the OS both in patients who had surgical resection as part of their primary intervention (log-rank, P < 0.001) and in patients who did not undergo surgery (n = 160) (log-rank, P = 0.025), with an HR of 6.09 (95% CI, 2.02–18.33) and 1.60 (95% CI, 06–2.43), respectively (Fig. 5).
Kaplan–Meier survival plot by PET/CT result and treatment. OS (mo) between patients who were PET-positive (red line) and PET-negative (blue line) were significantly different between patients who were treated with surgical resection as part of primary intervention (n = 41; log-rank, P < 0.001; HR = 6.09 [95% CI = 2.02–18.33]) (A) and those who did not have surgical resection as part of primary intervention (n = 160; log-rank, P = 0.025; HR = 1.60 [95% CI = 1.06–2.43]) (B).
DISCUSSION
The objective of the study was to validate the qualitative therapy response assessment PET/CT interpretation criteria (Hopkins criteria) in lung cancer patients and establish their diagnostic performance and predictive value for survival outcome. Our study showed that the Hopkins criteria for posttherapy response assessment interpretation added value to clinical assessment, resulted in the start of a new treatment in more than two thirds of patients, and could predict the OS of lung cancer patients.
Treatment response assessment plays a vital role in the management algorithm of patients with lung carcinoma. Studies have shown that there is a need for new strategies for therapy response assessment beyond that of established criteria such as the RECIST and World Health Organization criteria (18). A uniform strategy for therapy response assessment has been of importance in the recent past. Anatomic imaging–based criteria such as World Health Organization criteria and RECIST have been shown to have limitations, particularly in assessing the activity of cancer therapies that stabilize the disease.
The use of qualitative and quantitative PET methods to assess therapy response has gained interest in different solid tumors, wherein the 18F-FDG uptake in tumor foci is compared with tracer uptake in normal structures such as the blood pool and liver (19). This approach has been widely tested and validated in lymphoma (20,21). The introduction of simple qualitative criteria with good interinterpreter reliability, easy reproducibility, and good diagnostic performance, which can also provide prognostic information, will be of immense value. Our previous work on head and neck squamous cell carcinoma patients has shown that the interpretation criteria for therapy response assessment have substantial interinterpreter agreement and could predict survival outcomes (15). Multiple studies have shown that quantitative PET parameters provide valuable prognostic information in lung cancer (10,13,22,23). To our knowledge, the prognostic significance of qualitative PET strategies has not been clearly evaluated in lung cancer. Our study shows that there is a significant difference in the OS between patients who were categorized as positive by the 5-point interpretation scale, compared with those who were categorized as negative. This observation holds true among patient groups that undergo different treatment interventions and histology.
A common pitfall of a qualitative approach is intermediate patterns of tracer uptake. One of these patterns has been described as minimal residual uptake by Mikhaeel et al. (24) in their study of 102 patients with aggressive lymphoma and showed that there was a difference in the survival between patients who were classified PET-negative, PET-positive and by studies that demonstrated minimal residual uptake, with observed survival rates for the minimal residual uptake group falling between the PET-positive and PET-negative groups. In routine evaluation of PET/CT studies, this classification of 18F-FDG uptake that falls in the gray zone is challenging (24). In line with the above findings, our study has also shown a significant difference in OS between patients who were scored 1 or 2 versus score 3 versus score 4 or 5.
Recent study on locally advanced non–small cell lung cancer patients who received curative chemotherapy suggested that PET/CT scanning 9 mo after the start of radiation therapy increased the probability of early detection of disease progression and could detect the progression in 48% of asymptomatic patients without any clinical symptom (25). Previous studies also suggested that follow-up and surveillance PET/CT could add value to clinical assessment and excluded malignancy in about 50% and 15% of scans obtained with prior clinical suspicion, in head and neck cancer and lung cancer patients, respectively (26,27). This study further demonstrated the added value of therapy assessment PET/CT in lung cancer patients. PET/CT identified potential residual or metastasis in about 65% of the scans obtained as a routine therapy assessment without prior clinical suspicion and excluded malignancy in about 15% of the scans obtained in the presence of prior clinical or imaging suspicion.
We acknowledge a few limitations to our study. Enrollment of patients over 13 y in a retrospective manner can be associated with inherent unavoidable biases. We did not measure any semiquantitative parameters such as SUVmax or SUVpeak, because we focused on a standardized qualitative method. This was to minimize the effect of longitudinal variability of the scans acquired over a decade and to provide a simple method of qualitative therapy assessment for lung tumors. There may be underestimation of prior clinical assessment given that clinical judgment was collected retrospectively and the exact perspective of the treating physician was not collected prospectively. The survival data were obtained from a public registry and the patient records at our hospital. There may be a time lag between death and the public registry update.
CONCLUSION
The proposed therapy response interpretation system is a simple, qualitative method with substantial interinterpreter agreement and high accuracy, which adds value to prior clinical assessment. In addition, the method can predict OS in patients with lung cancer, irrespective of the primary treatment or histology of the tumor.
Footnotes
Published online Feb. 2, 2016.
- © 2016 by the Society of Nuclear Medicine and Molecular Imaging, Inc.
REFERENCES
- Received for publication August 12, 2015.
- Accepted for publication January 7, 2016.


Jump to section
Related Articles
Cited By...
- RESISTing the Need to Quantify: Putting Qualitative FDG-PET/CT Tumor Response Assessment Criteria into Daily Practice
- What 18F-FDG PET Response-Assessment Method Best Predicts Survival After Curative-Intent Chemoradiation in Non-Small Cell Lung Cancer: EORTC, PERCIST, Peter Mac Criteria, or Deauville Criteria?
- Clinical Indications and Impact on Management: Fourth and Subsequent Posttherapy Follow-up 18F-FDG PET/CT Scans in Oncology Patients