


Abstract
AMG 110, a bispecific T cell engager (BiTE) antibody construct, induces T cell–mediated cancer cell death by cross-linking epithelial cell adhesion molecule (EpCAM) on tumor cells with a cluster of differentiation 3 ε (CD3ε) on T cells. We labeled AMG 110 with 89Zr or near-infrared fluorescent dye (IRDye) 800CW to study its tumor targeting and tissue distribution. Methods: Biodistribution and tumor uptake of 89Zr-AMG 110 was studied up to 6 d after intravenous administration to nude BALB/c mice bearing high EpCAM-expressing HT-29 colorectal cancer xenografts. Tumor uptake of 89Zr-AMG 110 was compared with uptake in head and neck squamous cell cancer FaDu (intermediate EpCAM) and promyelocytic leukemia HL60 (EpCAM-negative) xenografts. Intratumoral distribution in HT-29 tumors was studied using 800CW-AMG 110. Results: Tumor uptake of 89Zr-AMG 110 can be clearly visualized using small-animal PET imaging up to 72 h after injection. The highest tumor uptake of 89Zr-AMG 110 at the 40-μg dose level was observed at 6 and 24 h (respectively, 5.35 ± 0.22 and 5.30 ± 0.20 percentage injected dose per gram; n = 3 and 4). Tumor uptake of 89Zr-AMG 110 was EpCAM-specific and correlated with EpCAM expression. 800CW-AMG 110 accumulated at the tumor cell surface in viable EpCAM-expressing tumor tissue. Conclusion: PET and fluorescent imaging provided real-time information about AMG 110 distribution and tumor uptake in vivo. Our data support using 89Zr and IRDye 800CW to evaluate tumor and tissue uptake kinetics of bispecific T cell engager antibody constructs in preclinical and clinical settings.
Cancer remains a major cause of death worldwide and one of the key disease areas with the greatest unmet medical needs. Therefore, new treatment strategies are eagerly awaited. The use of T cells, especially cytotoxic T cells, in the battle against cancer has shown promising results using several approaches (1). However, most of these strategies are sensitive to inhibitory or escape mechanisms, such as major histocompatibility complex class I downregulation or induction of T cell tolerance, which can limit antitumor efficacy (2,3).
Bispecific T cell engager (BiTE) antibody constructs are created to circumvent such inhibitory or escape mechanisms. They comprise 2 single-chain variable antibody fragments (scFv) that are covalently linked by a peptide linker and bind cluster of differentiation 3 ε (CD3ε) as well as a surface target antigen on cancer cells (4). The activation of T cells by BiTE antibody constructs is independent of matching major histocompatibility complex class I or costimulatory molecules (5,6). Furthermore, BiTE antibody constructs engage a polyclonal population of T cells, including CD4+ and mainly CD8+ T cells (7). Binding of tumor cells and T cells by BiTE antibody constructs results in the formation of a cytolytic synapse between tumor and T cells, which is followed by a release of pore-forming and pro-apoptotic components of cytotoxic T cell granules, mediating cancer cell death (5,7). The activation of T cells occurs only in the presence of a target cell (8). To date, 4 BiTE antibody constructs, blinatumomab, BAY2010112/AMG 212, MT111/AMG 211, and MT110/AMG 110, are or have been tested in clinical trials. Blinatumomab has been approved by the U.S. Food and Drug Administration to treat patients with Philadelphia chromosome–negative precursor B-cell acute lymphoblastic leukemia.
Epithelial cell adhesion molecule (EpCAM) is expressed on many epithelial tumors and cancer stem cells (9) and is therefore an attractive target for BiTE antibody constructs. An EpCAM-targeting BiTE called solitomab (AMG 110, formerly known as MT110) has been developed (10). AMG 110 mediates lysis of cancer cells by the activation of T cells in vitro and showed pharmacologic activity at doses administered of at least 24 μg/d in the clinic (11).
To support clinical development of AMG 110 and other BiTE antibody constructs, molecular imaging can be used as a powerful noninvasive tool to obtain valuable information on tumor uptake, biodistribution, and pharmacokinetics. In a clinical setting, this information can potentially be used to support patient-tailored drug dosing. Because of its long radioactivity decay half-life of 3.27 d, 89Zr is well suited for capturing the in vivo pharmacokinetics of large molecules, such as antibodies (12). In addition, labeling antibodies with the near-infrared (NIR) fluorescent dye 800CW can be used to study their intratumoral tumor distribution with NIR fluorescence imaging and to enable molecular characterization of tumor and tissue sections ex vivo (13). We therefore labeled AMG 110 with 89Zr or IRDye 800CW to study its tumor targeting and tissue distribution via noninvasive small-animal PET and fluorescence imaging.
MATERIALS AND METHODS
BiTE Antibody Constructs and Cell Lines
AMG 110 is a BiTE antibody construct targeting human EpCAM and human CD3ε. The nonspecific control BiTE Mec14 shares the same anti-CD3ε single-chain antibody arm but targets a haptene (mecoprop) with the second arm. Both BiTE antibody constructs, 55 kDa or more in size, were provided by Amgen. Two human EpCAM-positive tumor cell lines, the colorectal adenocarcinoma HT-29 cell line and the head and neck squamous cell cancer FaDu cell line, and a human EpCAM-negative promyelocytic leukemia HL-60 cell line were used. We used HT-29 xenografts to study dose- and time-dependent tumor uptake of 89Zr-AMG110 because this cell line highly expresses EpCAM (14). We additionally used this cell line to compare EpCAM-dependent tumor uptake of 89Zr-AMG110 with 89Zr-Mec14. All cell lines were obtained from American Type Culture Collection and screened for microbial contamination and tested negative. Cell lines were authenticated by Baseclear using short tandem repeat profiling. This was repeated once a cell line had been passaged for more than 6 mo after previous short tandem repeat profiling. HT-29 and HL-60 were routinely cultured in RPMI-1640 medium (Invitrogen) containing 10% fetal calf serum (Bodinco BV). FaDu cells were cultured in Dulbecco modified Eagle medium (Invitrogen) supplemented with 10% fetal calf serum and 2 mM L-glutamine (Invitrogen). All cells were cultured under humidified conditions (37°C, 5% CO2).
Animal Experiments
All animal experiments were approved by the Institutional Animal Care and Use Committee of the University of Groningen and conducted in male nude BALB/c mice (BALB/cOlaHsd-Foxn1nu; Harlan). After 1 wk of acclimatization, 6- to 8-wk-old mice were subcutaneously injected with 10 × 106 HT-29 cells in 0.1 mL of phosphate-buffered saline, with 5 × 10⁶ FaDu cells in 0.1 mL of phosphate-buffered saline, or with 2 × 10⁶ HL-60 cells in 0.1 mL of phosphate-buffered saline. Tumor growth was monitored by caliper measurements. Penile vein tracer injection was performed 3 wk after inoculation of HT-29 cells, 4 wk after inoculation of FaDu cells, and 5 wk after inoculation for HL-60 cells. All scans and invasive proceedings were performed with isoflurane/medical air inhalation anesthesia (5% induction, 2.5% maintenance) for a maximum of 90 min.
PET Acquisition
Two mice were placed above each other in a Focus 220 rodent scanner (CTI Siemens), with the tumor in the field of view. Mice were kept warm on heating mats. Acquisition times differed between 10 min (0.5-h time point) and 75 min (144-h time point). A transmission scan of 515 s was obtained using a 57Co point source to correct for tissue attenuation.
In Vivo PET Imaging and Ex Vivo Biodistribution
For determining the time point for optimal tumor visualization, small-animal PET images were obtained 0.5, 3, 6, 24, 48, and 72 h after injection of 20 μg of 89Zr-AMG 110 (5 MBq). Data up to 24 h were obtained from 6 mice, and data at 48 and 72 h were obtained from 2 mice.
For ex vivo biodistribution, animals were sacrificed at designated time points. Subsequently, organs and tissues were excised and weighed. Samples and prime standards were counted for radioactivity in a calibrated well-type γ-counter. Ex vivo tissue activity was expressed as percentage injected dose per gram of tissue (%ID/g).
A dose escalation biodistribution study was performed with 20 (n = 5), 40 (n = 4), and 500 μg (n = 3) of 89Zr-AMG 110 (1 MBq) at 24 h after injection. Tumor weights did not differ significantly between the dose groups (0.23 ± 0.09, 0.33 ± 0.27, and 0.47 ± 0.62 g, respectively) (Supplemental Fig. 1A; supplemental materials are available at http://jnm.snmjournals.org). Doses higher than 20 μg were supplemented with nonradiolabeled AMG 110. For the 40-μg protein dose, 89Zr-AMG 110 (1 MBq) time-dependent tumor uptake was also determined. Biodistribution studies were performed at 6 (n = 3), 24 (n = 4), 72 (n = 4), and 144 (n = 5) h after tracer injection. Tumor weights did not differ significantly between different groups (0.20 ± 0.01, 0.33 ± 0.27, 0.33 ± 0.10, and 0.35 ± 0.15 g, respectively) (Supplemental Fig. 1B).
To determine nonspecific tumor uptake, 40 μg (1 MBq) of 89Zr-Mec14 (n = 6) or 89Zr-AMG 110 (n = 4) were administered intravenously to mice harboring HT-29 tumors. Tumor weights did not differ significantly between the 2 groups (0.32 ± 0.11 and 0.33 ± 0.27 g, respectively) (Supplemental Fig. 1C). Small-animal PET scans and ex vivo biodistribution were performed 24 h after tracer injection, at the time when tumor uptake of 89Zr-AMG 110 would be high and blood levels relatively low. The biologic half-life of 89Zr-AMG 110 in whole blood and tumor was calculated using either %ID per cubic centimeter (%ID/cm3) (20-μg tracer dose, as used for determining optimal time point) based on small-animal PET scans or %ID/g (40-μg protein dose) by nonlinear regression (1-phase exponential decay) using GraphPad Prism (GraphPad Software).
EpCAM-specific uptake in relation to EpCAM expression was assessed with small-animal PET imaging 24 h after injection of 40 μg of 89Zr-AMG 110 in xenografted mice (n = 4–6 per group) bearing HT-29, FaDu, or HL-60 tumors. Thereafter, mice were sacrificed for ex vivo biodistribution analysis. Tumor weights did not differ significantly between the tumor models (0.33 ± 0.27, 0.20 ± 0.13, and 0.34 ± 0.10 g, respectively) (Supplemental Fig. 1D).
PET Reconstruction
PET data were reconstructed using a 2-dimensional ordered-subset expectation maximization reconstruction algorithm with Fourier rebinning, 4 iterations, and 16 subsets. After reconstruction, images were quantified using AMIDE Medical Image Data Examiner software (version 1.0.4; Stanford University). Regions of interest were drawn for tumor and blood (heart). The level of 89Zr-AMG 110 or 89Zr-Mec14 was calculated as %ID/cm3.
Ex Vivo Fluorescent Imaging
For NIR fluorescence imaging, mice bearing HT-29 xenografts (n = 4) were coinjected with 40 μg of 800CW-AMG 110 and 40 μg of 680RD-Mec14. At 24 h after injection mice, were sacrificed and tumor tissue was excised, formalin-fixed, and paraffin-embedded. Tumor slices were stained immunohistochemically for EpCAM (D9S3P; Cell Signaling) and with hematoxylin and eosin. Overview images of intratumoral 680RD-Mec14 and 800CW-AMG 110 distribution were obtained with the Odyssey infrared imaging system (LI-COR Biosciences). For fluorescence microscopy, an inverted Leica DMI600B fluorescence microscope equipped with a Lumen Dynamics X-Cite 200DC light source was used. Nuclei were stained with 4′,6-diamidino-2-phenylindole (DAPI; Sigma-Aldrich).
Statistical Analysis
Data are presented as mean ± SD. Statistical analysis between 2 groups was performed using the Mann–Whitney U test (GraphPad Prism 5). To test whether differences between multiple groups were significant, we used a Kruskal–Wallis test (GraphPad Prism 5). A Bonferroni-corrected Mann–Whitney U test was subsequently used to compare differences between 2 groups. P values of 0.05 or less were considered significant.
RESULTS
In Vivo Evaluation of 89Zr-AMG 110 and 800CW-AMG 110
Small-animal PET images of the 20-μg 89Zr-AMG 110 dose showed time-dependent tumor accumulation, with a maximum of 3.25 ± 0.24 %ID/cm3 at 6 h after injection (Figs. 1A and 1B) and decreasing subsequently. Following the same pattern, kidneys showed the highest tissue uptake across time points, reaching a maximum of 60.26 ± 4.01 %ID/cm3 at 6 h, indicating renal clearance. Blood levels of 89Zr-AMG 110 dropped rapidly (biologic half-life, 1.51 h; Supplemental Fig. 4A). The washout of the tumor was relatively slow (biologic half-life, 99.9 h; Supplemental Fig. 4B), starting at 6 h after injection. This resulted in increasing tumor-to-blood ratios over time, reaching 1.13 ± 0.29, 3.67 ± 0.29, 4.10 ± 0.42, and 3.53 ± 1.03, respectively, at 6, 24, 48, and 72 h.

Biodistribution of 89Zr-AMG 110 at 20-μg dose level. (A) Representative serial small-animal PET imaging at 0.5, 3, 6, 24, 48, and 72 h after injection in 1 HT-29–bearing mouse. Yellow arrows indicate tumor. (B) In vivo quantification of tumor and blood levels of 89Zr-AMG 110 in time as presented in %ID/cm3. Data up to 24 h were obtained from 6 mice, and data at 48 and 72 h were obtained from 2 mice. Data are mean ± SD.
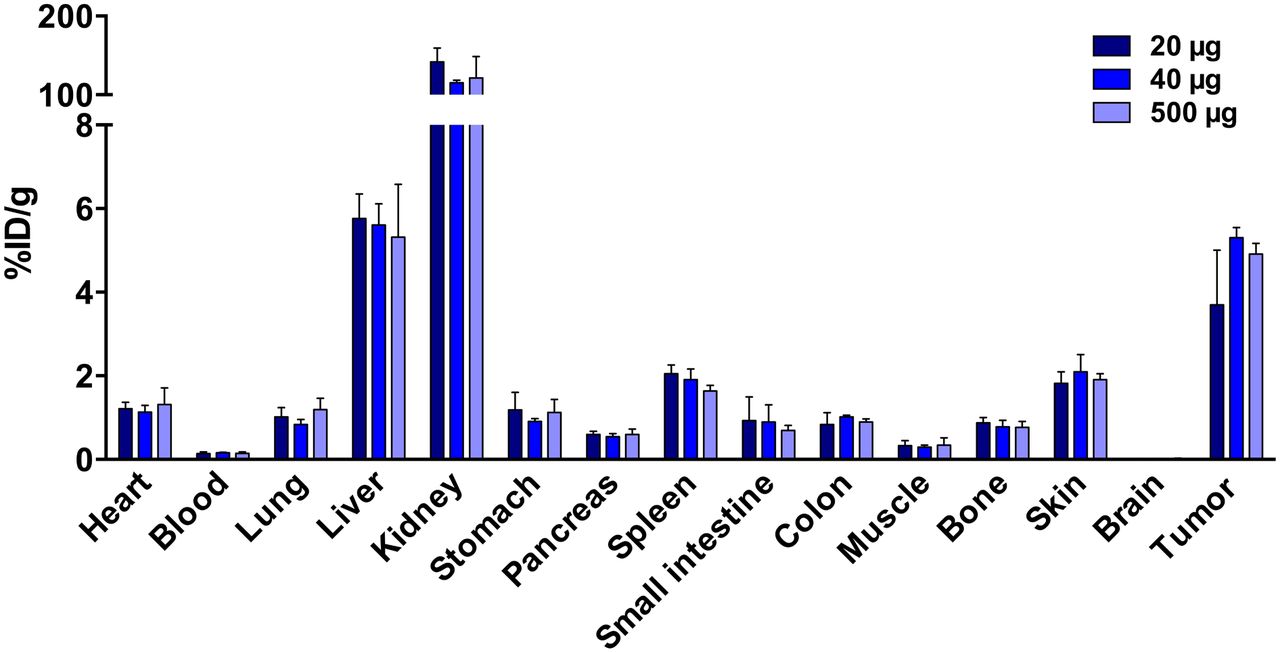
A 40- and 500-μg protein dose resulted in a higher (not statistically significant) and more reproducible tumor uptake of 89Zr-AMG 110 than 20 μg (5.30 ± 0.21 and 4.9 ± 0.21 vs. 3.6 ± 1.2 %ID/g; P = 0.57 and 0.75, respectively, Fig. 2A). No statistically significant differences were found in tumor-to-blood or tumor-to-muscle ratios among the different protein doses tested (Supplemental Figs. 5A and 5B). All organs showed similar 89Zr-AMG 110 levels at all protein doses. Highest 89Zr-AMG 110 levels were found in the kidneys, followed by liver and tumor. Because of a more reproducible tumor uptake, the remainder of the study was performed with a 40- instead of a 20-μg dose level.

Dose-dependent 89Zr-AMG 110 biodistribution in HT-29–tumor bearing mice at 24 h after tracer injection. Mice were injected with 20- (n = 5), 40- (n = 4), or 500-μg (n = 3) protein doses. No significant differences were observed in organ and tumor uptake between dose groups. Data are mean ± SD.
The duration and level of 89Zr-AMG 110 tumor exposure was protein-dose-dependent and differed from blood. Biodistribution of 40 μg of 89Zr-AMG 110 in time resulted in a maximum tumor uptake at 6 and 24 h after injection of 5.4 ± 0.2 and 5.3 ± 0.3 %ID/g, respectively (Fig. 3A), declining subsequently. In contrast, tumor uptake after injection of 20 μg of 89Zr-AMG 110 already peaked at 6 h and declined steadily thereafter (Fig. 1B). The biologic half-life of 89Zr-AMG 110 after injection of a protein dose of 40 μg in blood was 4.1 h compared with 1.5 h for the 20-μg protein dose (Supplemental Fig. 4C). Washout of signal from the tumor was relatively slow compared with blood (half-life, 40.2 h; Supplemental Fig. 4D). The prolonged tumor retention of 40 μg of 89Zr-AMG 110 resulted in increasing tumor-to-blood ratios over time, reaching 65.1 ± 15.5 at 144 h (Fig. 3B). The maximal tumor-to-muscle ratio was reached at 24 h (18.6 ± 3.6).

Time-dependent 89Zr-AMG 110 (40 μg) biodistribution in HT-29–bearing mice. (A) Ex vivo biodistribution of 89Zr-AMG 110 was performed at 6 (n = 3), 24 (n = 4), 72 (n = 4), and 144 h (n = 5) after injection. (B) Corresponding tumor-to-blood ratios increased significantly. Data are mean ± SD. Significance has been calculated for differences in tumor uptake and tumor-to-blood ratios. *P ≤ 0.05.
HT-29 xenografts specifically retained 89Zr-AMG 110 but not the non-EpCAM binding 89Zr-Mec14 BiTE. Biodistribution of 89Zr-Mec14 showed low tumor uptake of 0.7 ± 0.1 %ID/g compared with 5.3 ± 0.3 %ID/g for 89Zr-AMG 110 at 24 h (Fig. 4A; P < 0.01). Accumulation of 89Zr-Mec14 in blood and all organs except the kidneys was lower (≤2.4 %ID/g) than 89Zr-AMG 110 (≤5.6 %ID/g). 89Zr-Mec14 tumor uptake was comparable to nonspecific uptake in other organs. As a result, a higher tumor-to-blood (33.4 ± 3.1 vs. 7.3 ± 1.2; P < 0.01; Fig. 4B) and a higher tumor-to-muscle ratio (18.6 ± 3.6 vs. 6.7 ± 0.8; P < 0.01) were observed for 89Zr-AMG 110. In line with these results, small-animal PET images showed lower tumor uptake of 89Zr-Mec14 than 89Zr-AMG 110 (Fig. 4C).
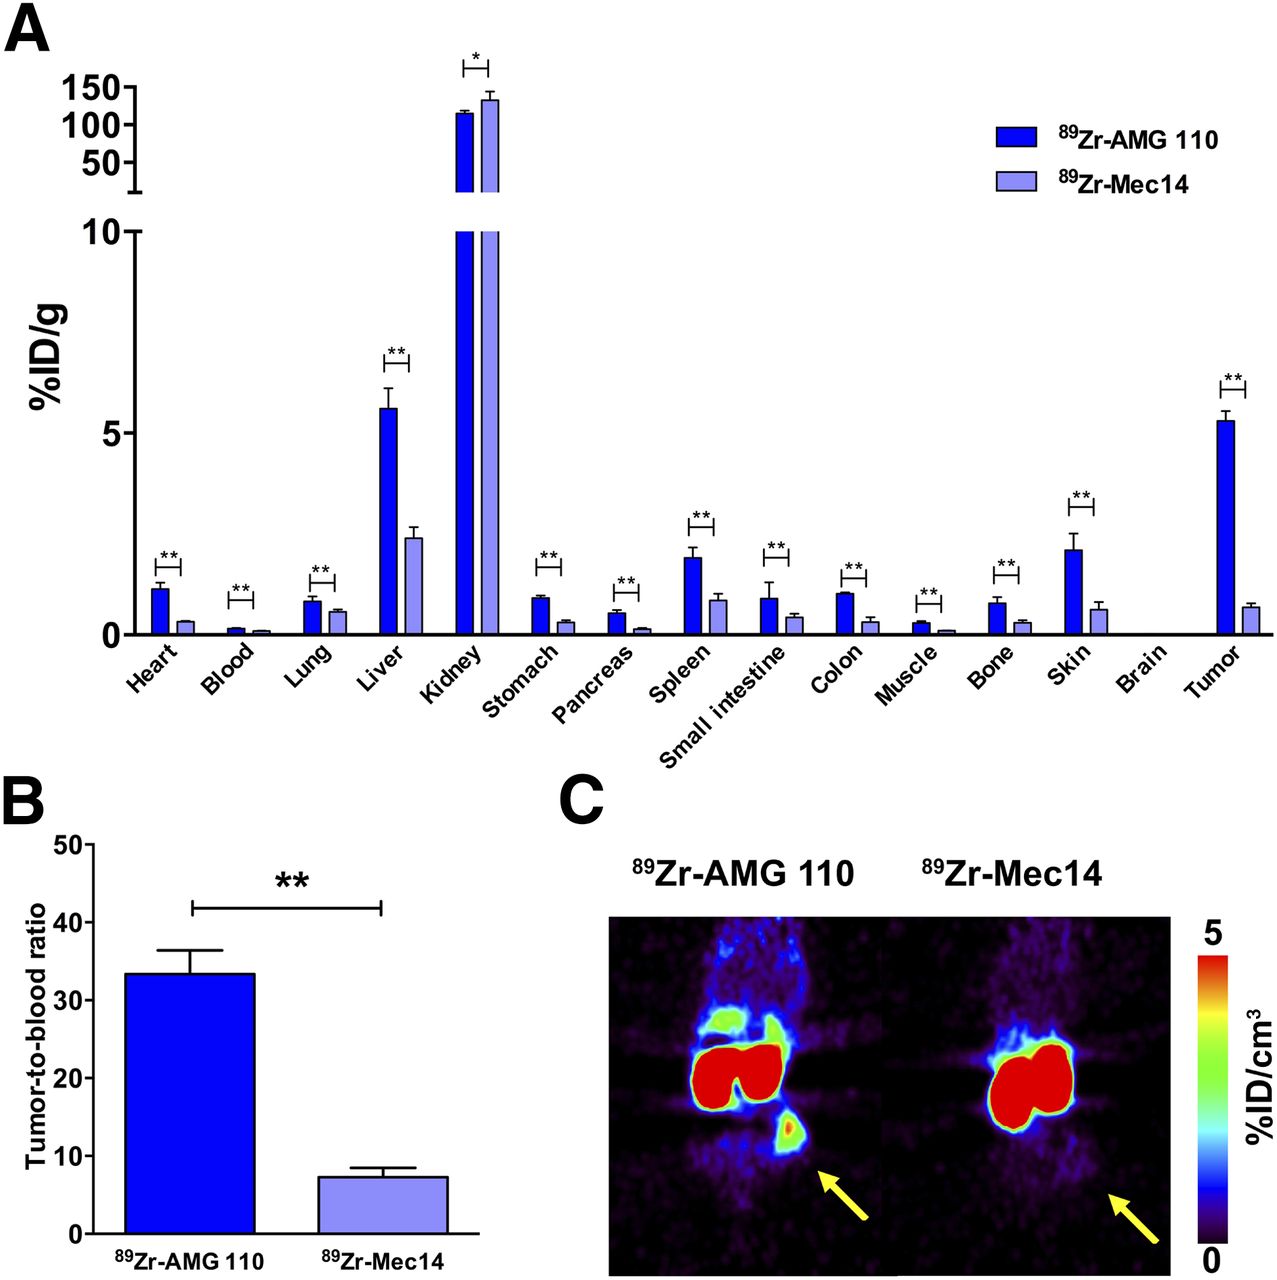
(A) Ex vivo biodistribution 24 h after injection of 89Zr-AMG 110 (40 μg, n = 4) or 89Zr-Mec14 (40 μg, n = 6) in HT-29–tumor bearing mice. (B) Corresponding tumor-to-blood ratios were significantly higher for 89Zr-AMG 110 than for 89Zr-Mec14. (C) Representative coronal small-animal PET images of 89Zr-AMG 110 and 89Zr-Mec14 visualize difference in tumor uptake. Yellow arrow indicates tumor. Data are mean ± SD. *P ≤ 0.05. **P ≤ 0.01.
Tumor uptake of 89Zr-AMG 110 was correlated with the level of cell surface EpCAM expression (Fig. 5). It was highest in HT-29 tumors (5.3 ± 0.3 %ID/g) followed by FaDu (2.7 ± 0.6 %ID/g) and HL-60 (0.8 ± 0.2 %ID/g), whereas no differences were observed in uptake of normal organs in mice bearing the different tumor xenografts (Fig. 5A). Difference in tumor uptake could be clearly visualized by small-animal PET (Fig. 5B).

Correlation between 89Zr-AMG 110 tumor uptake and EpCAM expression on tumor cells. (A) Ex vivo biodistribution of 89Zr-AMG 110 (40 μg) 24 h after tracer injection in mice bearing HT-29 (n = 4; high EpCAM), FaDu (n = 5; intermediate EpCAM), or HL-60 (n = 6; EpCAM-negative) cells. (B) Representative coronal small-animal PET images. Yellow arrows indicate tumor. (C) Differences in EpCAM expression on HT-29 (n = 5), FaDu (n = 5), and HL-60 (n = 4) cells correlated with tumor uptake of 89Zr-AMG 110. Data are mean ± SD. *P ≤ 0.05.
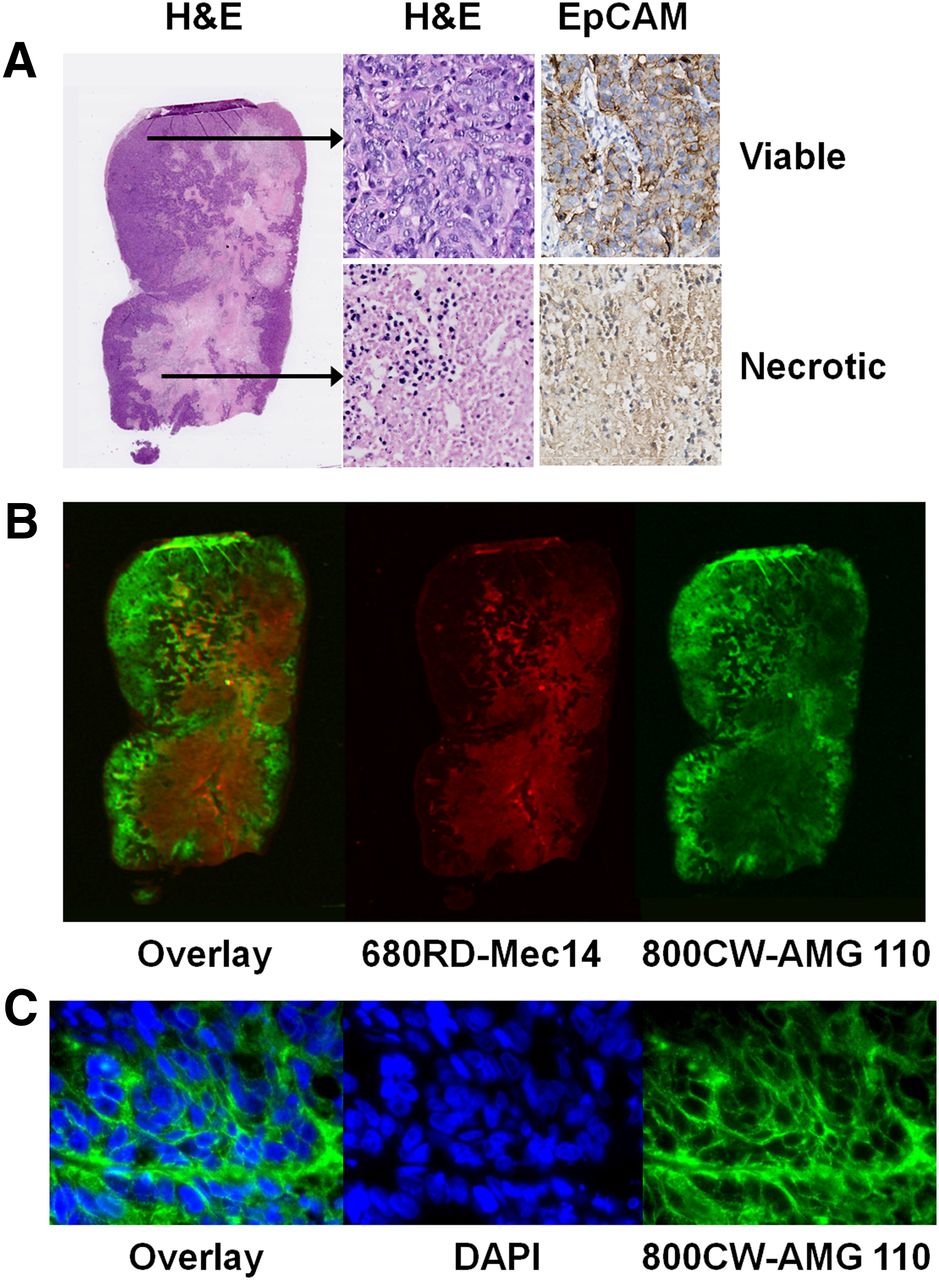
In vivo and ex vivo fluorescence imaging confirmed AMG 110–specific cell surface binding of HT-29 xenografts. Similar to 89Zr-AMG 110, in vivo imaging showed HT-29 retention of 800CW-AMG 110 but not 680RD-Mec14 (Supplemental Fig. 6A). In accordance with low tumor levels found for 89Zr-Mec14 at biodistribution 24 h after tracer injection, 680RD-Mec14 was cleared rapidly, with a level detectable only ex vivo by 24 h (Supplemental Fig. 6B). Ex vivo macroscopic fluorescence imaging of HT-29 tumor slices showed 800CW-AMG 110 colocalizing with viable EpCAM-expressing tumor tissue, as shown by hematoxylin and eosin and EpCAM staining (Figs. 6A and 6B). Fluorescence microscopy also showed presence of 800CW-AMG 110 on the tumor cell surface (Fig. 6C). In contrast, non-EpCAM binding 680RD-Mec14 mostly localized in necrotic tumor tissue.

Intratumoral distribution of coinjected 800CW-AMG 110 (40 μg) and 680RD-Mec14 (40 μg) in HT-29 tumors. (A) EpCAM was predominantly expressed on healthy tumor tissue as visualized with hematoxylin and eosin (H&E) and EpCAM immunohistochemical staining. (B) Corresponding macroscopic fluorescent imaging of 800CW-AMG 110 (green) and 680RD-Mec14 (red) distribution, with minor overlapping signal (yellow). (C) Fluorescence microscopy images (630×), visualizing membrane localization of 800CW-AMG 110 (green) and DAPI stained nuclei (blue).
DISCUSSION
We present the first, to our knowledge, noninvasive preclinical imaging study in which a bispecific T cell–engaging antibody construct targeting EpCAM is labeled with a radionuclide, or a fluorophore, to visualize and quantify tumor uptake, tissue accumulation, and clearance kinetics in vivo. In this study, 89Zr-AMG 110 showed consistent tumor uptake in xenografts that is correlated with EpCAM expression. It also showed prolonged tumor retention that is unusual for a reversible extracellular binder exhibiting rapid renal clearance.
Remarkably, HT-29 tumor uptake of 89Zr-AMG 110 remained visible up to 72 h after injection, despite minimal cellular internalization. Both tumor uptake and organ uptake of 89Zr-AMG 110 was higher than those of 89Zr-Mec14, likely the result of faster clearance of 89Zr-Mec14, because blood levels of 89Zr-Mec14 were also lower. NIR fluorescent imaging with 800CW-AMG 110 confirmed AMG 110 localization at the tumor cell membrane in viable HT-29 tumor tissue. Minor accumulation of 680RD-Mec14 was observed in necrotic tumor tissue, which is likely due to nonspecific binding. Together, these findings clearly demonstrate the advantage of using immune-PET to determine the dose level of BiTE antibody constructs necessary for tumor targeting, to assess the presence of target, and to study in vivo tissue exposure in real time.
AMG 110 showed favorable tumor uptake and retention compared with a similar EpCAM binding agent. The EpCAM-targeting radiopharmaceutical 68Ga-scFv429 also comprises 2 scFv fragments and has a molecular weight (51.2 kDa) similar to 89Zr-AMG 110 (15). Furthermore, it exhibits monospecific bivalent binding and higher EpCAM affinity than AMG 110 (dissociation constant = 0.24 vs. 170–230 nM, respectively, as determined by plasmon resonance analysis) (10). Despite bivalent binding and higher affinity, the highest tumor uptake (in %ID/g) of 68Ga-scFv429 in HT-29 tumors was 2.8-fold lower than 89Zr-AMG110 (16). Maximum tumor uptake of 68Ga-scFv429 was reached at 1 h, whereas maximum tumor uptake of 89Zr-AMG110 was reached at 6 h after injection. At these time points, the observed tumor-to-blood ratios were comparable (∼1 and 1.1 ± 0.30, respectively). The higher tumor uptake of 89Zr-AMG 110 is most likely due to its longer circulating half-life (1.4–4.1 h) than that of 68Ga-scFv429 (0.97 h).
In addition to differences in tumor uptake kinetics and circulating half-life, preclinical imaging studies also showed that different tracers also vary in the ability to saturate tumor uptake. In contrast to membrane tumor targets c-MET and human epidermal growth factor receptor 3, saturation of EpCAM binding on HT-29 was not observed even when the 89Zr-AMG 110 total protein dose was increased to 500 μg (17,18). Thurber et al. also observed no saturation of EpCAM binding in HT-29 xenografts after injection of an EpCAM antibody labeled with a NIR dye (VivoTag 680) at a total protein dose of 180 μg (14). One possible explanation might be related to the abundance of cell surface EpCAM on HT-29 cells (2.3 × 10⁶ receptors/cell) (14). Another example supporting this hypothesis was illustrated by the lack of tumor saturation observed for 89Zr-trastuzumab, up to 500 μg in SKOV3-xenografted mice (19). Similar to the high level of EpCAM expression on HT-29 cells, expression of the human epidermal growth factor receptor 2 on SKOV3 cells is also high (6.6 × 10⁶ receptors/cell) (20). The inability to saturate human epidermal growth factor receptor 2 and EpCAM suggest that it may be difficult to saturate receptors when their cell surface expression exceeds approximately 2 × 10⁶ receptors/cell at the dose levels evaluated. Alternatively, saturation of tumor targets may also depend on other in vivo properties of the antibodies including binding on/off kinetics, degree of tumor penetration, and access to targets at different protein dose levels. Additional radioactive- and optical-labeled antibody imaging studies, particularly those in the clinical setting, will help further elucidate mechanisms for driving uptake in tumors and tissues of interest.
Although the current preclinical study examined only the tumor antigen binding component of AMG 110, preclinical and clinical imaging studies showed that it is feasible to image tumor uptake of tumor-targeting CD3-bispecific antibodies in the presence of circulating T cells. A T cell–mediated increase in tumor uptake has been observed with a tetravalent bispecific tandem antibody (TandAb), directed at mouse CD3ε and fibronectin extra domain B, in immunocompetent mice (21). 125I-labeled TandAb with CD3ε affinity similar to that of AMG 110 showed that potential T cell binding outside of the tumor did not block tumor uptake or change its biodistribution (21). The mice in our study were immunodeficient, so tumor uptake of 89Zr-AMG 110 was not affected by T cells. Because AMG110 does not bind mouse CD3ε, the effect of T cell binding on 89Zr-AMG 110 distribution and tumor uptake could not be studied in immune competent mice. In a clinical setting, the presence of T cells might influence biodistribution and lead to a higher tumor uptake. Furthermore, 123I-OC/TR F(ab′)2, targeting folate receptor and CD3, has been used successfully to image malignant tumor lesions in ovarian cancer patients (22).
CONCLUSION
Given its overexpression by many tumor types, EpCAM is an interesting drug target. Different EpCAM-targeted drugs have been developed, including monoclonal antibodies, antibody fragments, bispecific antibodies, and antibody–drug conjugates. Similar to these other experimental drugs, EpCAM expression on tumor cells is a prerequisite for effective treatment with AMG 110. Because EpCAM-dependent 89Zr-AMG 110 tumor uptake has been demonstrated preclinically, this tracer, applied clinically, can potentially facilitate patient selection for AMG 110 treatment by providing information on drug access across all lesions. Moreover, 89Zr-AMG 110 or other radiolabeled BiTE antibody constructs could potentially support clinical BiTE development, because they could give additional information about tissue pharmacokinetics and uptake in tumors to support optimal dosing and about uptake in critical organs to anticipate toxicity.
DISCLOSURE
The costs of publication of this article were defrayed in part by the payment of page charges. Therefore, and solely to indicate this fact, this article is hereby marked “advertisement” in accordance with 18 USC section 1734. This work was supported by Amgen and ERC advanced grant 293445 (OnQview). Matthias Friedrich, Petra Deegen, Sabine K. Stienen, Pete C. Pieslor, and Hung K. Cheung are employed by Amgen and have ownership interest (including patents) in AMGEN. No other potential conflict of interest relevant to this article was reported.
Footnotes
↵* Contributed equally to this work.
Published online Feb. 4, 2016.
- © 2016 by the Society of Nuclear Medicine and Molecular Imaging, Inc.
REFERENCES
- Received for publication November 3, 2015.
- Accepted for publication January 13, 2016.


Jump to section
Related Articles
Cited By...
- Longitudinal evaluation of the biodistribution and cellular internalization of the bispecific CD3xTRP1 antibody in syngeneic mouse tumor models
- Imaging the pharmacokinetics and therapeutic availability of the bispecific CD3xTRP1 antibody in syngeneic mouse tumor models
- Mesothelin/CD3 Half-Life-Extended Bispecific T-Cell Engager Molecule Shows Specific Tumor Uptake and Distributes to Mesothelin and CD3-Expressing Tissues
- The Biodistribution of a CD3 and EpCAM Bispecific T-Cell Engager Is Driven by the CD3 Arm
- Preclinical PET imaging of bispecific antibody ERY974 targeting CD3 and glypican 3 reveals that tumor uptake correlates to T cell infiltrate
- Molecular Imaging of Radiolabeled Bispecific T-Cell Engager 89Zr-AMG211 Targeting CEA-Positive Tumors
- CARs versus BiTEs: A Comparison between T Cell-Redirection Strategies for Cancer Treatment
- Relative Target Affinities of T-Cell-Dependent Bispecific Antibodies Determine Biodistribution in a Solid Tumor Mouse Model
- Dual-Targeted Molecular Imaging of Cancer
- Immune Modulation Therapy and Imaging: Workshop Report
- Theranostics Using Antibodies and Antibody-Related Therapeutics
- Oncolytic Adenoviral Delivery of an EGFR-Targeting T-cell Engager Improves Antitumor Efficacy