


Abstract
Noninvasive imaging of cell death can provide an early indication of the efficacy of tumor treatment, aiding clinicians in distinguishing responding patients from nonresponding patients early on. 99mTc-duramycin is a SPECT tracer for cell death imaging. In this study, our aim was to validate the use of 99mTc-duramycin for imaging the early response of tumors to treatment. Methods: An in vitro binding assay was performed on COLO205 cells treated with 5-fluorouracil (3.1, 31, or 310 μM) and oxaliplatin (0.7 or 7 μM) or radiation (2 or 4.5 Gy). 99mTc-duramycin cell binding and the levels of cell death were evaluated after treatment. In vivo imaging was performed on 4 groups of CD1-deficient mice bearing COLO205 human colorectal cancer tumors. Each group included 6 tumors. The first group was given irinotecan (100 mg/kg), the second oxaliplatin (5 mg/kg), the third irinotecan (80 mg/kg) plus oxaliplatin (5 mg/kg), and the fourth vehicle (0.9% NaCl and 5% glucose). For radiotherapy studies, COLO205 tumors received 4.5 Gy, 2 fractions of 4.5 Gy in a 24-h interval, pretreatment with an 80 mg/kg dose of irinotecan combined with 2 fractions of 4.5 Gy in a 24-h interval, or no treatment (n = 5–6/group). Therapy response was evaluated by 99mTc-duramycin SPECT 24 h after the last dose of therapy. Blocking was used to confirm tracer specificity. Radiotracer uptake in the tumors was validated ex vivo using γ-counting, cleaved caspase-3, and terminal deoxynucleotidyl transferase–mediated deoxyuridine triphosphate nick-end labeling (TUNEL) histology. Results: Chemotherapy and radiotherapy increased 99mTc-duramycin binding to COLO205 cells in a concentration/dose- and time-dependent manner, which correlated well with cell death levels (P < 0.05) as analyzed by annexin V and caspase 3/7 activity. In vivo, 99mTc-duramycin uptake in COLO205 xenografts was increased 2.3- and 2.8-fold (P < 0.001) in mice treated with irinotecan and combination therapy, respectively. Blocking with unlabeled duramycin demonstrated specific binding of the radiotracer. After tumor irradiation with 4.5 Gy, 99mTc-duramycin uptake in tumors increased significantly (1.24 ± 0.07 vs. 0.57 ± 0.08 percentage injected dose per gram in the unirradiated tumors; P < 0.001). γ-counting of radioactivity in the tumors positively correlated with cleaved caspase-3 (r = 0.85, P < 0.001) and TUNEL (r = 0.81, P < 0.001) staining. Conclusion: We demonstrated that 99mTc-duramycin can be used to image induction of cell death early after chemotherapy and radiotherapy. It holds potential to be translated into clinical use for early assessment of treatment response.
Objective and accurate evaluation of tumor response to therapy represents one of the biggest challenges in oncology. Tailoring the choice of therapy to the individual patient will help clinicians match patients with the appropriate therapies, enabling a personalized-medicine approach. An early assessment of therapeutic effectiveness will avoid treatment-related toxicity to the patient and can lead to improved patient survival by allowing early intensification of treatment, discontinuation of ineffective therapy, or initiation of more effective second-line therapy. There is, however, a lack of validated biomarkers for treatment response evaluation, despite the active research in this area (1). Currently in clinical practice, the evaluation of response focuses on volumetric and morphometric changes in the tumor based on RECIST (2). The major drawback of treatment response evaluation based on RECIST is that it usually takes a few weeks after treatment before tumor shrinkage becomes apparent. Because molecular events precede gross morphologic changes, tumor response assessment based on the molecular effects of therapy may show sensitivity and specificity superior to that of anatomic imaging techniques.
Most anticancer therapies, such as chemotherapy and radiation therapy, induce tumor cell death through several pathways (3,4). Consequently, failure of therapy frequently is a result of resistance against cell death (5). At a clinical level, noninvasive imaging of cell death will allow identification of nonresponding tumors at an early stage after the start of treatment, leading to a timely change in the individualized treatment plan that increases the probability of response and, ultimately, patient survival. Noninvasive molecular imaging of therapy-induced cell death can be achieved using PET or SPECT radiotracers that specifically target the hallmarks of the cell death process. Several different radiotracers have been developed over the past few years targeting specific events of apoptosis (6). During the apoptotic process, existing cell death–imaging PET and SPECT tracers target externalized aminophospholipids, such as phosphatidylserine (99mTc-annexin V, 99mTc-labeled C2A domain of synaptotagmin I) and phosphatidylethanolamine (99mTc-labeled duramycin), apoptotic cell membrane imprinting (18F-2-(5-fluoropentyl)-2-methyl malonic acid), and intracellular caspase-3 activation (18F-(S)-1-((1-(2-fluoroethyl)-1H-[1,2,3]-triazol-4-yl)methyl)-5-(2(2,4-difluorophenoxymethyl)-pyrrolidine-1-sulfonyl)isatin [18F-ICMT-11], 18F-caspase–sensitive nanoaggregation tracer [18F-C-SNAT]). Among these, 99mTc-annexin V is the most widely studied apoptosis-imaging tracer, and its use in the imaging of treatment-induced cell death has been extensively explored in clinical trials of lung cancer, lymphoma, and breast cancer (7). Nevertheless, 99mTc-annexin V failed to reach clinical usefulness because its slow clearance rate from nontargeted tissues contributes to low tumor-to-background ratios (6). In this context, the phosphatidylethanolamine-binding radiotracer 99mTc-duramycin has recently gained attention for detecting cell death in animal models of disease (8–10), exploiting its high affinity and selectivity for phosphatidylethanolamine and its optimal biodistribution profile for in vivo SPECT imaging of cell death. Recently, we demonstrated favorable dosimetry estimates together with the usefulness of 99mTc-duramycin for the early detection of irinotecan-induced tumor cell death in a proof-of-concept study (11).
In the present study, our purpose was to further validate the utility of 99mTc-duramycin for imaging the early response of tumor to various chemotherapy and radiation therapy schemes, with an eye toward the clinical translation of this cell death–targeting SPECT radiotracer. Blocking studies and ex vivo biodistribution studies were performed to validate the SPECT data and confirm the specificity of 99mTc-duramycin in imaging therapy-induced tumor cell death.
MATERIALS AND METHODS
Radiolabeling of Duramycin
99mTc-duramycin was prepared by adding 1,480 MBq of 99mTc-pertechnetate to a duramycin kit (15 μg) and heating at 80°C for 20 min. The obtained 99mTc-duramycin was purified using high-performance liquid chromatography as previously described (11).
In Vitro Binding Assay
COLO205 human colorectal adenocarcinoma cells (ATCC-CCL-222; Perkin Elmer) were grown in complete RPMI 1640 medium supplemented with 2 mM l-glutamine, 1 mM sodium pyruvate, 10% fetal bovine serum, and penicillin (100 U/mL) plus streptomycin (100 mg/mL) (Life Technologies) at 37°C in a humidified atmosphere containing 5% CO2. For in vitro experiments, 2 d after plating (6-well plates; 5.3 × 10³ cells/cm2), COLO205 cells were treated with 5-fluorouracil (3.1, 31, or 310 μM [Fluracedyl; Teva]) or oxaliplatin (0.7 or 7 μM [Eloxatin; Sanofi]) or were left untreated (control group). For irradiation experiments, tumor cells were irradiated with 2 and 4.5 Gy (XRAD 320; Precision X-Ray) directly in 6-well cell-culture plates at room temperature or were left unirradiated (control group). Forty hours after chemotherapy and 7, 24, or 48 h after irradiation, COLO205 cells were incubated with 99mTc-duramycin (0.19 MBq in complete medium) at 37°C for 30 min. After trypsinization, cells were collected by centrifugation (150g; 5 min), washed with Dulbecco phosphate-buffered saline, resuspended in fresh RPMI 1640, and counted. Cell-bound decay-corrected radioactivity was determined by automatic γ-counting (Wizard2 2480; Perkin Elmer). Radioactivity (counts per minute) per 103 cells was calculated, and radiotracer binding was expressed as a percentage of the control cells. The levels of drug/irradiation-induced cell death were determined (Muse Annexin V and Dead Cell Assay and Muse Caspase 3/7 Assay; Millipore) for correlation to cell-bound radioactivity.
Animal Model
All experimental procedures and protocols involving animals (Fig. 1) were approved by the local ethical committee (2013-36, University of Antwerp) and were in accordance with European Directive 86/609/EEC on the Welfare and Treatment of Animals. CD1-deficient nude female mice (aged 6–8 wk; Charles River Laboratories) were subcutaneously inoculated in both hind flanks with luciferase-transfected COLO205 cells (2 × 10⁶ in 100 μL of Dulbecco phosphate-buffered saline). Baseline and posttreatment tumor volumes were measured daily using a digital caliper, with tumor volumes calculated according to the formula (length × width2)/2. Additionally, tumor growth was followed up using whole-body bioluminescence imaging.

Schematic representation of experimental protocol using 99mTc-duramycin SPECT imaging in tumor-bearing mice treated with chemotherapy (A) or radiotherapy (B). H&E = hematoxylin and eosin; IHC = immunohistochemistry.
Approximately 2 wk after inoculation, the tumors were size-matched (405 ± 40 mm3), and mice were treated using chemotherapy or radiotherapy. Relative tumor volume (RTV) was calculated as (mean tumor volume during treatment)/(mean tumor volume before treatment start). Percentage of tumor growth inhibition was calculated as [1 − (mean RTV of treatment group/mean RTV of vehicle group) × 100].
Treatment Regimens
For chemotherapy (Fig. 1A), tumor-bearing mice were assigned to 4 treatment groups (n = 6 tumors per group). The first group was given irinotecan (100 mg/kg), the second oxaliplatin (5 mg/kg), the third irinotecan (80 mg/kg) plus oxaliplatin (5 mg/kg), and the fourth vehicle (0.9% NaCl or 5% glucose). All drugs and vehicles were administered by intraperitoneal injection: irinotecan or oxaliplatin was injected every other day for 1 wk, and irinotecan was alternated with oxaliplatin for 1 wk in the combination therapy. Control tumor-bearing mice received vehicle solution (0.9% NaCl or 5% glucose) on alternating days for 1 wk. Treatment response was assessed by 99mTc-duramycin SPECT imaging 24 h after the last course of treatment.
To confirm the binding specificity of 99mTc-duramycin, a blocking study was performed. For this, tumor-bearing mice (n = 6 tumors) were treated with irinotecan (80 mg/kg) in combination with oxaliplatin (5 mg/kg), as described above. Unlabeled duramycin (0.1 μg in 0.9% NaCl; Sigma-Aldrich) was injected via the tail vein 30 min before 99mTc-duramycin injection.
For radiotherapy studies (Fig. 1B), before tumor irradiation, all mice (including mice receiving mock irradiation) were anesthetized with ketamine (80 mg/kg) and xylazine (5 mg/kg) and positioned on a dedicated tray, and the whole body was shielded using lead protection except for the area of the tumor to be irradiated. x-rays were delivered using a self-contained x-ray system (XRAD320, Precision X-Ray) at a rate of 100 cGy/min with 320-kV x-rays. Tumor-bearing mice were assigned to 4 treatment groups (n = 5–6 tumors per group) and received a single dose of 4.5 Gy, 2 fractions of 4.5 Gy in a 24-h interval, or pretreatment with irinotecan (80 mg/kg) combined with 2 fractions of 4.5 Gy in a 24-h interval. In the control group, the tumors were not irradiated (mock irradiation). The response to radiation therapy was evaluated 24 h after the last treatment.
In Vivo SPECT/CT Imaging
COLO205 tumor-bearing mice received an injection of about 37 MBq of 99mTc-duramycin via the lateral tail vein, 24 h after the last course of treatment. Static whole-body SPECT images were acquired 4 h after radiotracer injection using a micro-SPECT/CT scanner (VECTor/CT; MILabs) equipped with a rat multipinhole SPECT collimator, followed by CT acquisition (45 kV and 615 μA), as described previously (11). Mice were kept under approximately 2% isoflurane anesthesia and a constant body temperature during SPECT/CT imaging. SPECT images were reconstructed with ordered-subsets expectation maximization (10 iterations, 16 subsets) and a 1.2-mm3 voxel size and smoothed with a 3-dimensional isotropic gaussian filter of 1.5 mm for visualization purposes. A 20% energy window centered on the 140-keV photopeak was used. CT scans were acquired for attenuation correction and anatomic coregistration with SPECT images. Volumes of interest for the whole tumor, heart (a measure of the blood pool), and muscle (for background measurements) were defined using PMOD, version 3.3 (PMOD Technologies) based on CT images. 99mTc-duramycin uptake as percentage injected dose (%ID) per milliliter was quantified from the delineated volumes of interest as [total radioactivity concentration in tumor at time of scan (kBq/mL)/total radioactivity injected (kBq)] × 100.
Ex Vivo Analysis
After the SPECT/CT scans, the mice were euthanized by cervical dislocation for ex vivo biodistribution analysis. After the tumors had been harvested, the organs and tissues were rinsed in Dulbecco phosphate-buffered saline and weighed, and the radioactivity in the samples was measured in a γ-counter using an energy window of 140 ± 19 keV. Uptake levels of 99mTc-duramycin were expressed as %ID per gram of tissue.
Immediately after the γ-counting, the tumors were embedded, snap-frozen in optimal-cutting-temperature compound (tissue-Tek; VWR), sectioned (100 μm), and exposed overnight to phosphor screen plates (Fujifilm). The exposed plates were imaged in a phosphor imager system (FLA7000; GE Healthcare). These sections were subsequently stained with hematoxylin and eosin after radioactive decay.
In addition, adjacent frozen tumor sections (10 μm) were taken at regular intervals across the entire tumor volume and used for histologic analysis of apoptosis. The sections were stained with cleaved caspase-3 (CC3, Cell Signaling Technology) and terminal deoxynucleotidyl transferase–mediated deoxyuridine triphosphate nick-end labeling (TUNEL) assay (Promega), according to the manufacturer’s instructions. For CC3 staining, the appropriate horseradish peroxidase–conjugated secondary antibody (EnVision; DAKO) was used. The nuclei of the tissue sections were counterstained using Mayer hematoxylin (Sigma-Aldrich). CC3- and TUNEL-positive cells were counted by 2 independent operators—one of whom was a board-certified pathologist—in a masked way using an upright microscope at ×400 magnification (CX31; Olympus). Three nonsequential whole-tumor sections were analyzed per tumor (n = 5–6 tumors per treatment), excluding extensive necrotic areas from the analysis. Apoptosis levels were expressed as the number of apoptotic cells per high-power field (×400) and correlated to the corresponding radiotracer uptake in the tumor.
Statistical Analysis
Data were expressed as mean ± SE of the mean. Statistical analysis was performed using Prism, version 6.01 (GraphPad Software). Statistical differences between groups were analyzed by 1- or 2-way repeated-measures ANOVA (time by treatment) followed by Bonferroni adjustment. Differences between groups were considered statistically significant if the P value was less than 0.05. For correlation analysis, the Pearson correlation coefficient was computed, with a P value of less than 0.05 considered statistically significant.
RESULTS
Cell-Binding Assay
Chemotherapy
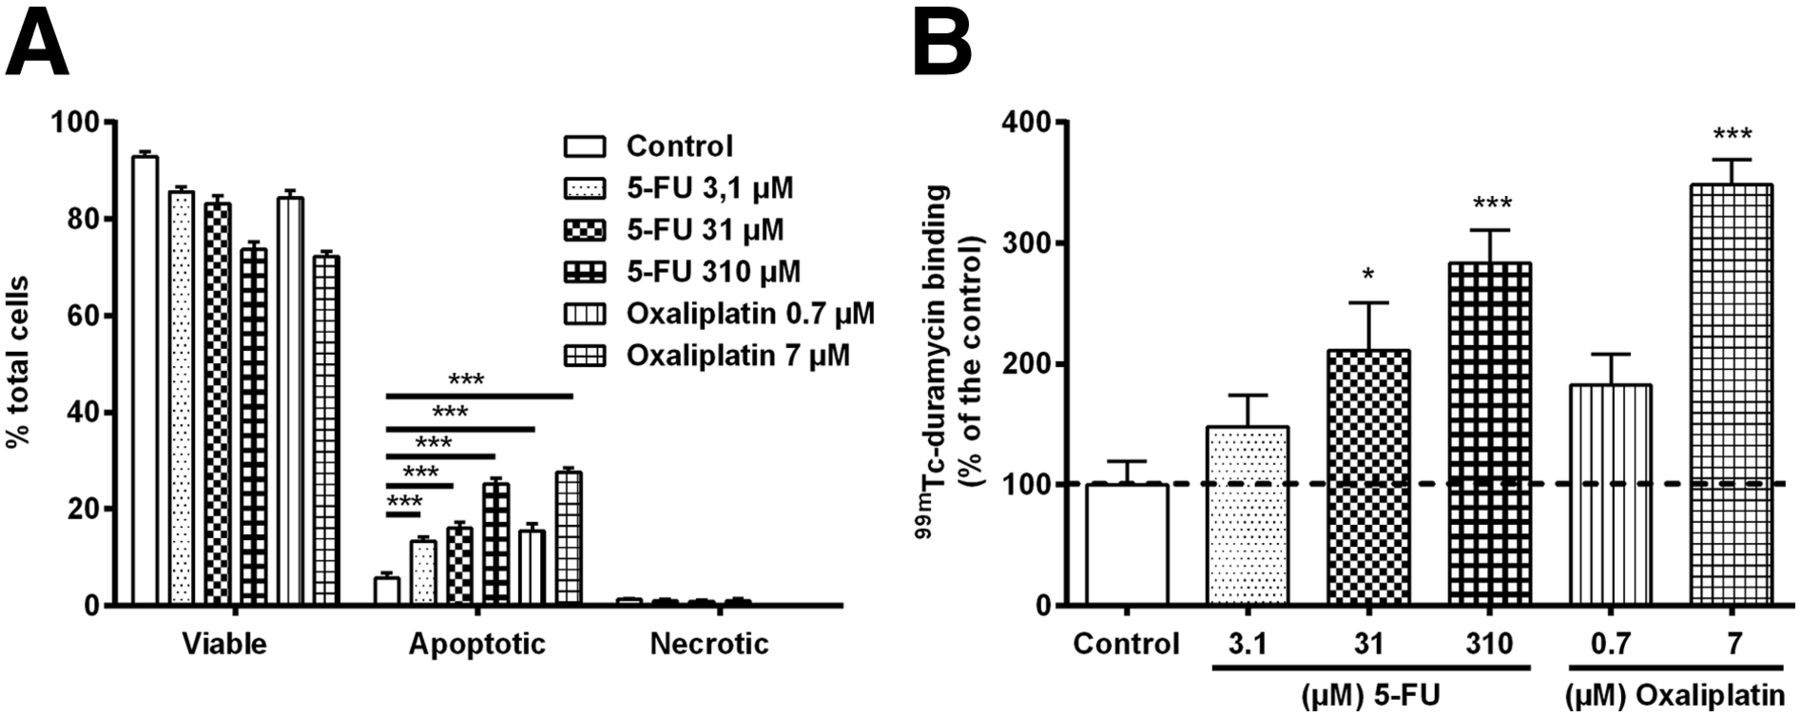
Cell death levels were higher with treatment with increasing concentrations of 5-fluorouracil or oxaliplatin than without treatment, as determined by annexin-V binding and executioner caspase activation (Fig. 2A and Supplemental Fig. 1A, respectively [supplemental materials are available at http://jnm.snmjournals.org]). Accordingly, 99mTc-duramycin cell binding (Fig. 2B) increased significantly after treatment with 310 μM 5-fluorouracil (283.6% ± 27.3%; P < 0.001; n = 6) and 7 μM oxaliplatin (348.2% ± 20.5%; P < 0.001; n = 6), when compared with control (100.0% ± 19.1%; n = 6).

(A) Cell death detection in COLO205 cells 40 h after treatment with vehicle or chemotherapy by annexin V assay. (B) In vitro binding of 99mTc-duramycin. *P < 0.05. ***P < 0.001. 5-FU = 5-fluorouracil.
Radiotherapy
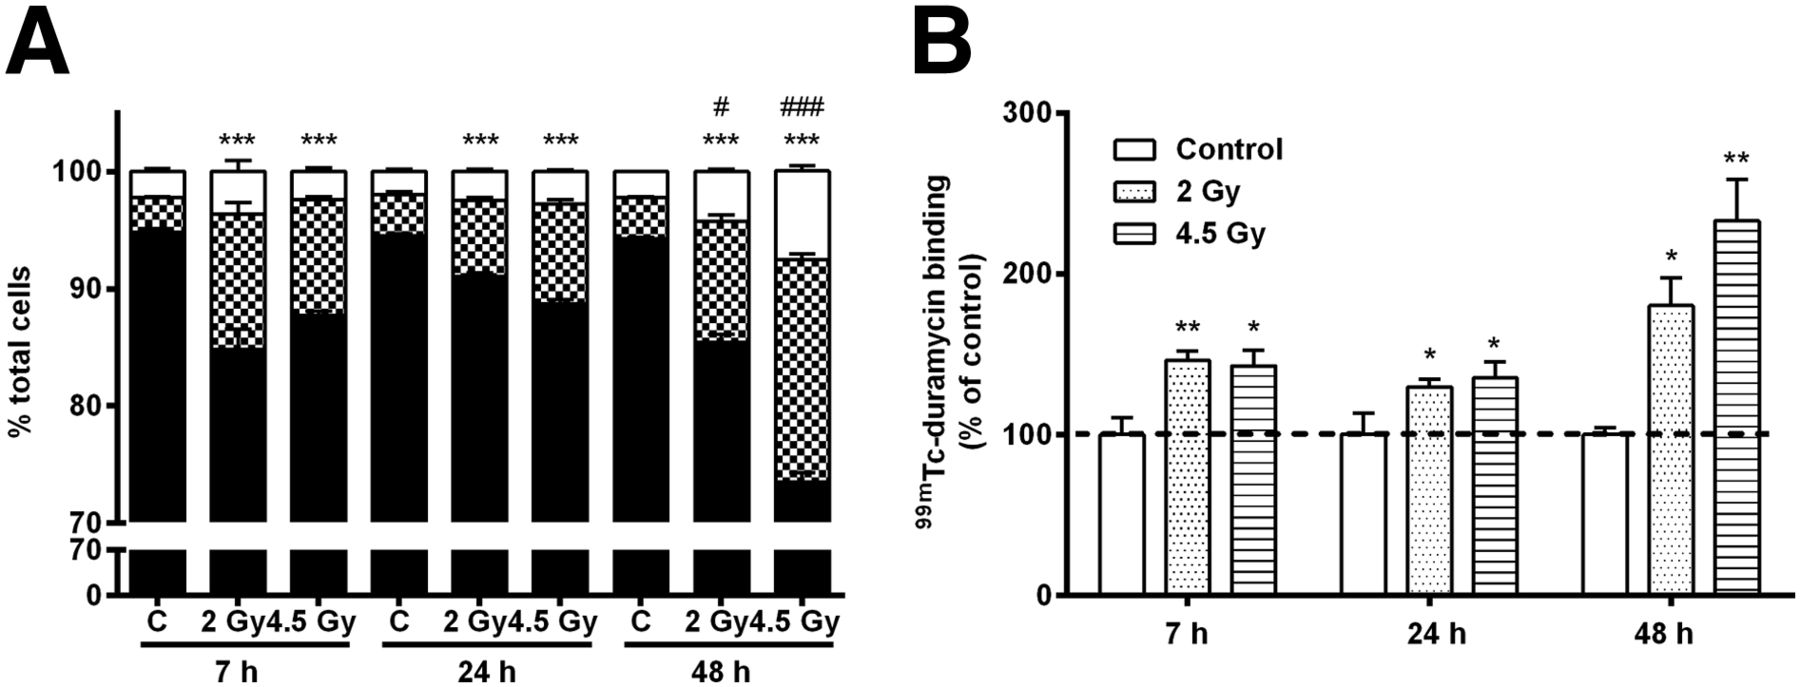
Temporal 99mTc-duramycin cell binding and the levels of cell death were measured at 7, 24, and 48 h after irradiation (Fig. 3). High radiotracer binding was evident at 7 h after tumor irradiation, being 146.0% ± 6.0% (n = 6) and 142.7% ± 9.8% (n = 6) after 2 and 4.5 Gy of x-irradiation, respectively. Significantly lower binding was found in nonirradiated control cells (100.0% ± 10.4%; P = 0.011 and P = 0.007 compared with 2 and 4.5 Gy, respectively; n = 4). Cell-associated radioactivity was highest at 48 h after 2 Gy (180.1% ± 17.5%; P = 0.043; n = 6) and 4.5 Gy (232.9% ± 25.7%; P = 0.002; n = 6) of irradiation (Fig. 3B). Importantly, the levels of cell death were increased in irradiated cells at all time points studied, when compared with control cells (Fig. 3A and Supplemental Fig. 1B) and in good correlation with radiotracer cell binding (P < 0.001; Pearson r = 0.76 and 0.80 for annexin-V and caspase-3/7, respectively). A significant increase in necrosis occurred at 48 h after doses of 2 and 4.5 Gy (Fig. 3A).

(A) Temporal changes in cell death after irradiation measured with annexin V assay. (B) Time course of 99mTc-duramycin binding in irradiated and control COLO205 cells. For levels of necrosis significantly different from control: *P < 0.05, **P < 0.01, ***P < 0.001, #P < 0.05, and ###P < 0.001.
Evaluation of Treatment Response in Tumors
Chemotherapy
All chemotherapy caused a decrease in body weight (<20% from that on the day therapy began). Compared with control, treatment with oxaliplatin did not inhibit tumor growth by day 5 (RTV = 1.62 ± 0.21; P = 0.212; n = 6). By contrast, irinotecan significantly inhibited tumor growth by day 5 (27.6% ± 5.8% inhibition, which corresponds to an RTV of 1.45 ± 0.11; P = 0.027; n = 6). Combination therapy (RTV = 1.10 ± 0.19 and 1.18 ± 0.22 on days 5 and 6, respectively; n = 6) further inhibited tumor growth (45.3% ± 10.2%), when compared with control on days 5 (RTV = 1.98 ± 0.24; P = 0.002; n = 6) and 6 (RTV = 2.18 ± 0.19; P < 0.001; n = 6) (Supplemental Fig. 2A). Similarly, the bioluminescence imaging signal of the tumors of mice treated with irinotecan and combination therapy was significantly lower than that of the vehicle group (Supplemental Fig. 2B). Accordingly, ex vivo γ-counting of excised tumors (Fig. 4A) revealed an increased 99mTc-duramycin uptake in tumors treated with irinotecan (1.75 ± 0.12 %ID/g; P < 0.001) and combination therapy (2.10 ± 0.25 %ID/g; P < 0.001) but not in tumors treated with oxaliplatin alone (1.07 ± 0.11 %ID/g; P = 0.425), in comparison to vehicle-treated animals (0.74 ± 0.04 %ID/g). Figure 4B shows representative micro-SPECT/CT images 4 h after tumor-bearing mice had been injected with vehicle or combination therapy. The distribution of 99mTc-duramycin was characterized by high uptake in the treated tumors and a low general background uptake in nontargeted organs (Fig. 4B), with positive tumor-to-blood and tumor-to-muscle ratios (Table 1).

Evaluation of 99mTc-duramycin uptake in tumors treated with chemotherapy. (A) Ex vivo 99mTc-duramycin uptake in tumors. (B) Representative coronal SPECT/CT images 24 h after last course of treatment showing 99mTc-duramycin uptake in mice bearing COLO205 xenografts on lower right and left flanks. Tumors are encircled. ***P < 0.001 (significantly different from vehicle). ##P < 0.01 (significantly different from nonblocked tumors).
99mTc-Duramycin Tumor Uptake and Tumor-to-Background Ratios in Mice Bearing COLO205 Tumors After Chemotherapy
The radiotracer’s specificity for cell death was evaluated in a blocking study. Preinjection of unlabeled duramycin blocked radiotracer uptake in tumors treated with combination chemotherapy (1.09 ± 0.07 %ID/g; P = 0.009; n = 6), when compared with nonblocked equally treated tumors (2.10 ± 0.25 %ID/g; Fig. 4B). Also, semiquantification of the SPECT images showed no significant difference in 99mTc-duramycin uptake between the posttherapy blocked tumors (0.89 ± 0.09 %ID/mL) and the vehicle-treated tumors (0.92 ± 0.06 %ID/mL; P > 0.999; n = 6).
Radiotherapy
The cell death–targeting properties of 99mTc-duramycin were also evaluated in colorectal cancer–bearing mice treated with radiotherapy (Fig. 5). No body weight loss was observed after radiotherapy. Although radiotherapy did not inhibit tumor growth as determined by caliper measurements (results not shown) and bioluminescence imaging (Supplemental Fig. 2C), radiotracer uptake was increased 24 h after a single dose of radiotherapy (1.24 ± 0.07 %ID/g; P < 0.001; n = 6), fractionated radiotherapy (0.87 ± 0.08 %ID/g; P = 0.026; n = 6), and concomitant fractionated chemoradiotherapy (0.98 ± 0.06 %ID/g; P = 0.004; n = 5), when compared with mock-irradiated tumors (0.57 ± 0.08 %ID/g; n = 6) (Fig. 5B).
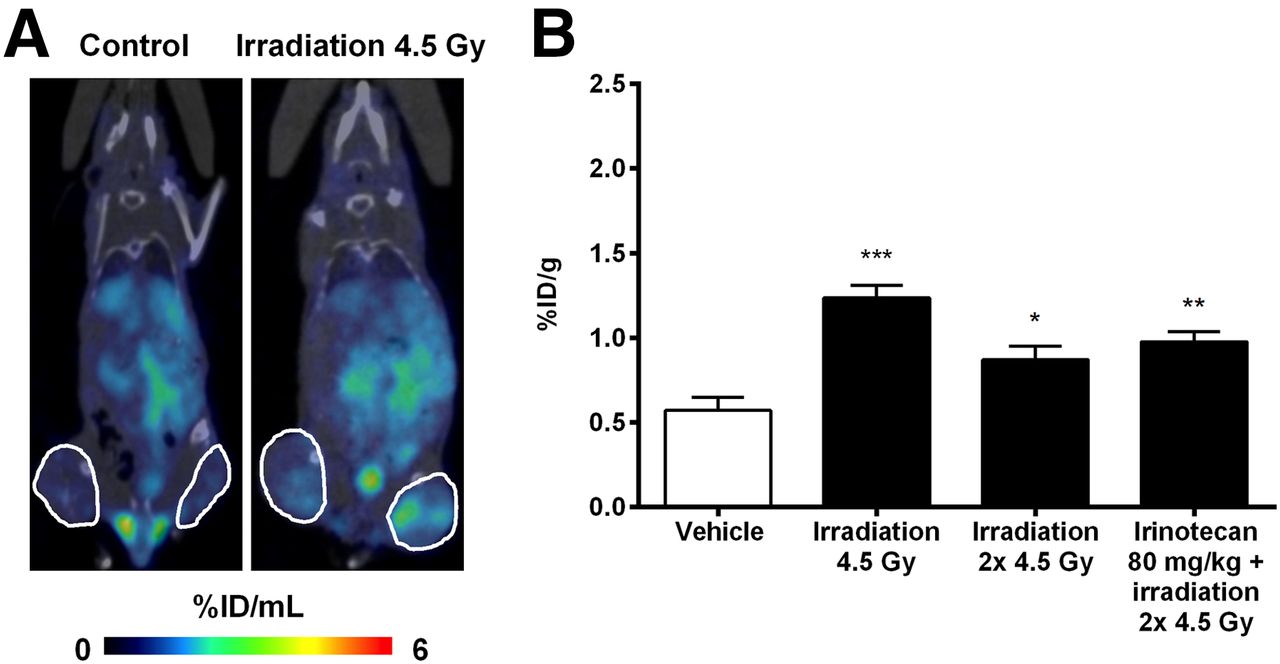
Evaluation of tumor response to radiotherapy. (A) Representative coronal SPECT/CT images 24 h after irradiation showing 99mTc-duramycin uptake in mice bearing COLO205 tumors. Tumors are encircled. (B) Ex vivo 99mTc-duramycin uptake in tumors. *P < 0.05. **P < 0.01. ***P < 0.001.
Correlation Between Radiotracer Uptake and Histology
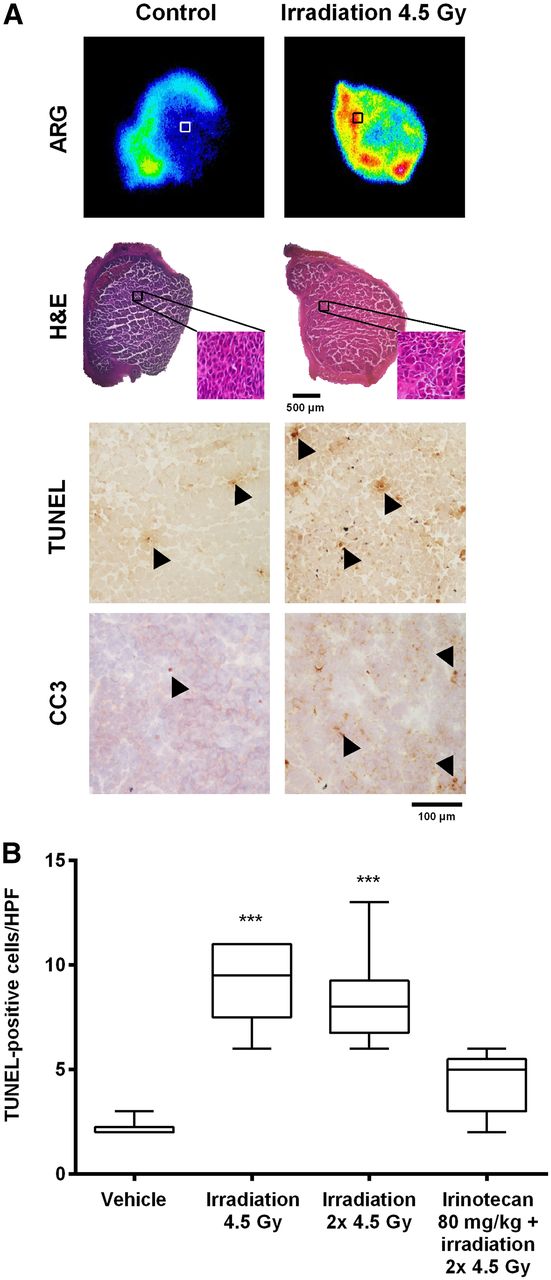
Radiotracer uptake correlated with levels of therapy-induced tumor cell death. Drug-treated tumors were characterized by the presence of shrunk apoptotic cells with condensed cytoplasm, pyknotic nuclei, and apoptotic bodies, as determined by histochemical analysis (Fig. 6). Tumors of mice treated with irinotecan (12 ± 1 TUNEL-positive cells [P = 0.043] and 11 ± 1 CC3-positive cells [P < 0.001]; n = 6) and combination therapy (14 ± 4 TUNEL-positive cells [P = 0.008] and 15 ± 2 CC3-positive cells [P < 0.001]; n = 6) showed increased levels of apoptosis, in comparison with tumors of vehicle-treated mice (4 ± 1 TUNEL-positive cells and 2 ± 1 CC3-positive cells; n = 6) (Fig. 6B and Supplemental Fig. 3A). Compared with vehicle, oxaliplatin treatment resulted in a moderate increase in the number of CC3-positive cells (8 ± 1; P = 0.014) and did not increase the number of TUNEL-positive cells (8 ± 1; P = 0.347; n = 6). Most importantly, 99mTc-duramycin uptake in the tumors correlated strongly with apoptotic response (P < 0.001; Pearson r = 0.81 and 0.85 for TUNEL and CC3, respectively). Although preinjection of duramycin blocked radiotracer uptake in tumors treated with combination chemotherapy, the level of apoptotic cells in these tumors was increased (15 ± 1 TUNEL-positive cells [P < 0.001] and 14 ± 1 CC3-positive cells [P < 0.001]; n = 6), and similar to that of nonblocked treated tumors. Autoradiography of the tumors (Fig. 6A, upper panel) showed a regional intratumoral localization of 99mTc-duramycin and colocalization of cold spots and hot spots with tumor areas having a low number and a high number of apoptotic cells, respectively (Supplemental Fig. 4). Tracer uptake in the autoradiographs was visibly blocked in tumors of mice pretreated with duramycin. For irradiated tumors, the levels of TUNEL (9 ± 1 and 8 ± 1 TUNEL-positive cells; P < 0.001 for 4.5 Gy and 2 × 4.5 Gy) and CC3-positive cells (5 ± 1 [P < 0.001] and 4 ± 1 CC3-positive cells [P < 0.05 for 4.5 Gy and 2 × 4.5 Gy]) were increased compared with the controls (2 ± 1 TUNEL-positive cells and 2 ± 1 CC3-positive cells) and correlated well (P < 0.001; Pearson r = 0.73 and 0.88, respectively) with 99mTc-duramycin uptake in the tumors (Fig. 7 and Supplemental Fig. 3B).
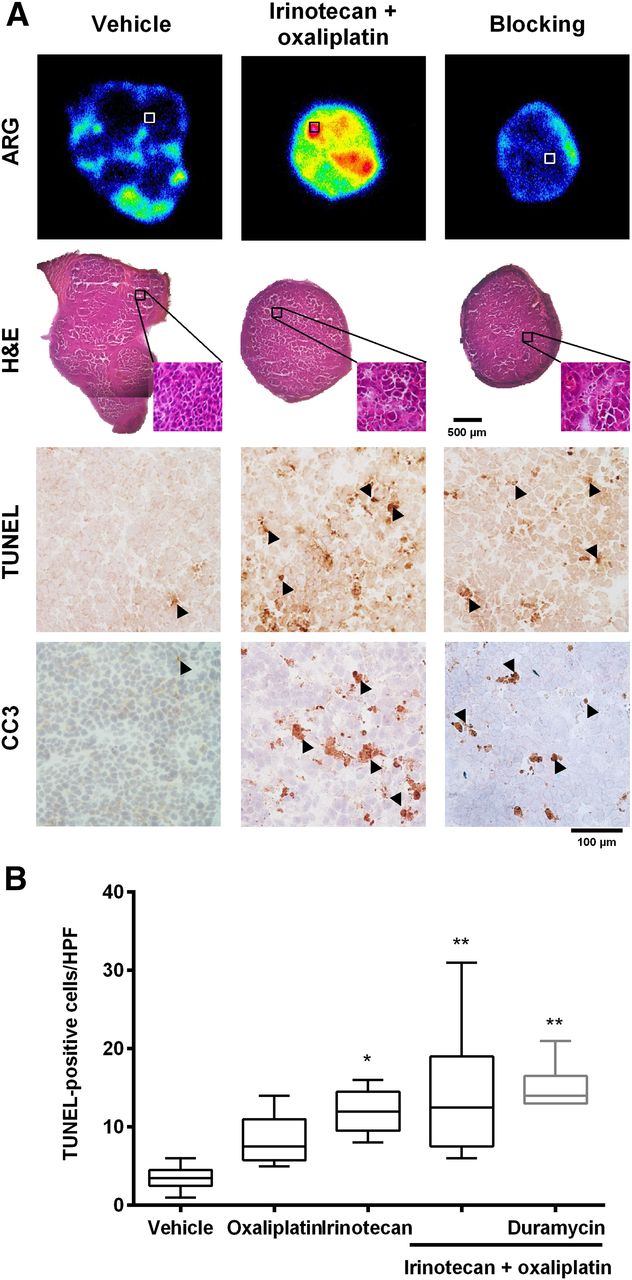
Histologic and autoradiographic analysis of COLO205 tumors. (A) Representative autoradiography and microscopy images of adjacent histologic COLO205 tumor slices stained with hematoxylin and eosin (H&E), CC3, and TUNEL. Cells in brown were positive for caspase-3 and TUNEL staining (arrowheads). (B) Quantitative analysis of levels of TUNEL-positive cells in tumors 24 h after last dose. *P < 0.05. **P < 0.01. HPF = high-power field.

(A) Representative autoradiographic and microscopy images of adjacent histologic COLO205 tumor slices stained with hematoxylin and eosin (H&E), CC3, and TUNEL. Cells in brown were positive for caspase-3 and TUNEL staining (arrowheads). (B) Quantitative analysis of levels of TUNEL-positive cells in tumors 24 h after irradiation. ***P < 0.001. HPF = high-power field.
DISCUSSION
The in vivo avidity of 99mTc-duramycin for cell death has previously been demonstrated in animal models of whole-body irradiation and cerebral and myocardial ischemia and reperfusion (8,10,12). We recently demonstrated the usefulness of 99mTc-duramycin in an oncology setting showing ability to detect irinotecan-induced tumor apoptosis early (11). In the same study, we showed that the administration of 99mTc-duramycin is safe from a dosimetry perspective and compatible with SPECT imaging in humans (11). The goal of the current study was to further validate its potential for early monitoring of treatment response, using a human colorectal cancer xenograft treated with chemotherapy and radiotherapy.
We found marked increases in 99mTc-duramycin uptake in tumors during the 24 h after conventional chemotherapy and radiotherapy regimens, accurately reflecting induction of cell death as validated by ex vivo histology. Drug treatment and radiotherapy in vivo induced nuclear condensation, cytoplasm shrinkage and formation of apoptotic bodies, caspase-3 activation, and DNA damage in the tumors, as evidenced by hematoxylin and eosin, CC3, and the clinical gold standard, TUNEL staining. The combination of irinotecan plus oxaliplatin induced the highest apoptotic response in the tumors. Importantly, there was a good correlation between 99mTc-duramycin tumor uptake and histologic proof of apoptotic cell death. The increase in 99mTc-duramycin accumulation in treated tumors versus the vehicle group was in the range of other cell death–imaging radiotracers (1.5- to 2.8-fold). For example, in a systematic study comparing different apoptosis imaging agents, Whitney et al. found a 1.4- to 2.1-fold increase in 99mTc-annexin V and 18F-C-SNAT uptake in lymphoma tumors of mice treated with etoposide (13). In our study, the increase in 99mTc-duramycin uptake was restricted to the tumors; there was no relevant background uptake in nontargeted organs (11). The pharmacokinetic profile of a radiotracer is a decisive parameter for its clinical translation. In the past, 99mTc-annexin V proceeded to clinical trials, where it was used to predict and evaluate tumor response to chemotherapy (7,14) and radiotherapy (15,16) in cancer patients. Besides low and nonspecific tumor uptake of 99mTc-annexin V, these clinical studies showed that the usefulness of this radiotracer for apoptosis imaging was limited to only specific tumor types, such as head and neck squamous cell carcinoma (15), and when using cancer therapies that have minor effects on the tumor vasculature, such as conventional chemotherapy and radiotherapy (17). Additional reasons for the failure of 99mTc-annexin V to reach clinical practice include an inadequate biodistribution profile and low target-to-background ratio (18) resulting from the large protein structure of annexin V (36 kDa) and the fact that the list of chemical alternatives to improve the pharmacokinetics of this SPECT tracer is almost exhausted. By contrast, the small size of duramycin (2 kDa) grants it fast blood clearance and low accumulation in nontargeted organs, contributing to more optimal imaging properties (11).
The specificity of 99mTc-duramycin for imaging therapy-induced tumor cell death was demonstrated through blocking of radiotracer uptake in the tumors with cold duramycin. The ability to displace 99mTc-duramycin from the phosphatidylethanolamine-binding sites in tumors of mice treated with combination therapy supports the specific binding of the radiotracer to phosphatidylethanolamine in apoptotic cells.
Because phosphatidylethanolamine also becomes accessible in necrotic cells because of cell membrane disruption, duramycin might not be able to discriminate between necrotic and apoptotic cell death. Consequently, radiation-induced necrosis at 48 h after cell irradiation might have further contributed to an increase in radiotracer uptake, when compared with earlier time points. In vivo, despite the presence of small necrotic tumor areas, radiotracer uptake correlated well with the levels of apoptosis in the tumors. Caspase-3–directed radiotracers might take advantage of the fact that caspase activation is limited to apoptosis and in this way are specific for apoptosis imaging. However, current challenges include cell entry and efficient accumulation in the cytoplasm. These cell permeability issues have been addressed in the development of a novel apoptosis imaging tracer, 18F-C-SNAT, that undergoes cyclization after cleavage by caspase-3, leading to enhanced accumulation and retention of the tracer in doxorubicin-treated tumors (19). This probe has not, however, been tested in humans and requires further preclinical testing. Another class of PET tracers is based on caspase-3 inhibitors, of which one, 18F-ICMT-11, has been preclinically evaluated for imaging apoptosis in treated lymphoma, colon cancer, breast cancer (20), and lung cancer (21) models. Limitations of this class of tracer include low absolute uptake in treated tumors, nonspecific binding due to the high reactivity of the dicarbonyl moiety, metabolic degradation, and high abdominal background uptake in the PET images (22).
The success of treatment of cancer patients by radiotherapy depends largely on tumor radiosensitivity. The response of a tumor to treatment can vary between individuals because of inherent biologic variations such as tumor heterogeneity; availability and accessibility of treatment targets; and expression of genes that govern the resistance of tumors, the immunologic function of the host, and the oxygenation of tumors (23). In addition, the rate and extent of apoptosis induction depend on the treatment modality, tumor phenotype, and treatment protocol applied. Therefore, the optimal time point of apoptosis imaging that yields the most predictive information varies accordingly. An increase in 99mTc-duramycin uptake in the tumors was observed 24 h after the last radiotherapy session, which corresponded to low absolute radiotracer uptake (<1.5 %ID/g) and mild apoptotic response. The good correlation found between radiotracer uptake and the levels of cell death demonstrates the sensitivity of this radiotracer to detect even a minor tumor response to therapy. Nevertheless, as was demonstrated in vitro, the apoptotic response and also 99mTc-duramycin uptake might increase in a dose- and time-dependent way. Therefore, longitudinal as well as baseline monitoring will be included in further studies.
CONCLUSION
We found increased and specific uptake of 99mTc-duramycin in apoptotic human colorectal cancer xenografts early after the onset of chemotherapy and radiotherapy. Taken together, the results support the usefulness of 99mTc-duramycin SPECT imaging as a valuable method for in vivo detection of apoptotic response to anticancer therapy. In a clinical context, longitudinal imaging of cell death has great significance in the assessment of therapeutic response in individual patients and has the potential to assist in the design of an optimized, cost-effective therapy.
DISCLOSURE
The costs of publication of this article were defrayed in part by the payment of page charges. Therefore, and solely to indicate this fact, this article is hereby marked “advertisement” in accordance with 18 USC section 1734. This work was supported by GOA (G.0135.13). Brian Gray and Koon Pak are employees of Molecular Targeting Technologies, Inc. No other potential conflict of interest relevant to this article was reported.
Acknowledgments
We thank Philippe Joye and Caroline Berghmans for their technical assistance.
Footnotes
Published online Feb. 2, 2016.
- © 2016 by the Society of Nuclear Medicine and Molecular Imaging, Inc.
REFERENCES
- Received for publication October 16, 2015.
- Accepted for publication November 29, 2015.


Jump to section
Related Articles
Cited By...
- Molecular Imaging of Apoptosis in Atherosclerosis by Targeting Cell Membrane Phospholipid Asymmetry
- Noninvasive Whole-Body Imaging of Phosphatidylethanolamine as a Cell Death Marker Using 99mTc-Duramycin During TNF-Induced SIRS
- 99mTc-Duramycin SPECT Imaging of Early Tumor Response to Targeted Therapy: A Comparison with 18F-FDG PET