


Abstract
The combined α-, γ-, and x-ray emitter 213Bi (half-life, 46 min) is promising for radionuclide therapy. SPECT imaging of 213Bi is challenging, because most emitted photons have a much higher energy (440 keV) than common in SPECT. We assessed 213Bi imaging capabilities of the Versatile Emission Computed Tomograph (VECTor) dedicated to (simultaneous) preclinical imaging of both SPECT and PET isotopes over a wide photon energy range of 25–600 keV. Methods: VECTor was equipped with a dedicated clustered pinhole collimator. Both the 79 keV x-rays and the 440 keV γ-rays emitted by 213Bi could be imaged. Phantom experiments were performed to determine the maximum resolution, contrast-to-noise ratio, and activity recovery coefficient for different energy window settings. Additionally, imaging of [213Bi-DOTA,Tyr3]octreotate and 213Bi-diethylene triamine pentaacetic acid (DTPA) in mouse models was performed. Results: Using 440 keV γ-rays instead of 79 keV x-rays in image reconstruction strongly improved the resolution (0.75 mm) and contrast-to-noise characteristics. Results obtained with a single 440 keV energy window setting were close to those with a combined 79 keV/440 keV window. We found a reliable activity recovery coefficient down to 0.240 MBq/mL with 30-min imaging time. In a tumor-bearing mouse injected with 3 MBq of [213Bi-DOTA,Tyr3]octreotate, tumor uptake could be visualized with a 1-h postmortem scan. Imaging a nontumor mouse at 5-min frames after injection of 7.4 MBq of 213Bi-DTPA showed renal uptake and urinary clearance, visualizing the renal excretion pathway from cortex to ureter. Quantification of the uptake data allowed kinetic modeling and estimation of the absorbed dose to the kidneys. Conclusion: It is feasible to image 213Bi down to a 0.75-mm resolution using a SPECT system equipped with a dedicated collimator.
New opportunities for high linear energy transfer radionuclide therapy with the α-particle emitters 225Ac and 213Bi are increasingly being investigated (1–3). The research for peptide receptor radionuclide therapy with α-particles is mostly focused on labeling peptides with 213Bi. Not only is the short half-life of 46 min for 213Bi in good accordance with the rapid targeting to receptor-positive tumors and the rapid clearance of peptides, it also raises less concern for detrimental effects because of the absence of nonspecific uptake by daughters detached from its peptide or linker due to α-decay recoil (4).
213Bi offers the best imaging opportunities through its 440 keV γ-ray and is therefore important for biodistribution and dosimetry studies (5). All other γ-rays and x-rays emitted by 213Bi and its daughters are too low either in abundance or in energy to be suitable for imaging, possibly with the exception of the x-rays from 213Bi at 77 and 79 keV if appropriate correction methods for down-scatter of the 440 keV γ-rays are applied (Supplemental Table 1; supplemental materials are available at http://jnm.snmjournals.org (6)). Patient imaging of the uptake pattern of 213Bi-labeled antibody HuM195, targeted to CD33 leukemia, and 213Bi-DOTATOC targeting neuroendocrine tumors has been performed by imaging the 440 keV γ-ray with high-energy collimators (7–9).
Preclinical biodistribution studies with 213Bi are challenging because of its short half-life. Typically 213Bi-labeled peptide biodistributions have been determined at 1 and 3 h in rats and mice, thereby missing essential information on the kinetics in the uptake phase (2). Dynamic imaging of this uptake phase will show the kinetic pattern but usually lacks good quantification. Imaging of the high-energy (440 keV) photons is severely compromised for most small-animal SPECT systems, because of the penetration of pinhole edges and the collimator wall. Recently, however, a new dedicated small-animal SPECT system based on use of many clustered pinholes has been developed that enables imaging over an energy range from 25 to 600 keV (10). This system has shown to be able to, for example, image SPECT and PET tracers simultaneously at 0.5- and 0.75-mm resolution, respectively (11).
The aim of the study was to investigate the capability to (dynamically) image 213Bi in small animals, for example, using 213Bi-labeled peptides. Resolution, contrast-to-noise ratio, and activity recovery coefficient (RC) for different energy window settings and combinations thereof were optimized in phantom studies. Subsequently, imaging of 213Bi-diethylene triamine pentaacetic acid (DTPA) and [213Bi-DOTA,Tyr3]octreotate in mice was performed.
MATERIALS AND METHODS
Radiochemistry
213Bi was eluted from a standard 225Ac/213Bi generator (European Commission, Institute for Transuranium Elements). For phantom experiments, the elution was not chemically altered. 213Bi was labeled with DTPA for renal function imaging. 213Bi eluate was added directly into a ready-for-use solution containing, 0.15 M Tris and 64 μM DTPA, at a total volume of 800 μL and a pH of 8.5. For tumor imaging, 213Bi was labeled to [DOTA,Tyr3]octreotate according to the labeling procedure described earlier (12); the incorporation of the radioactivity was greater than 99% and radiochemical purity was greater than 85%. Specific activity was 14.8 MBq/nmol.
Small-Animal Imaging System
The VECTor (MILabs B.V.) uses 3 γ-cameras in a triangular setup. It enables high-energy γ-photon imaging including single 511 keV photons using a tungsten collimator with clustered pinholes with relatively small opening angles. This reduces the image-degrading effects of pinhole edge penetration by these high-energy photons. The collimator contains 162 pinholes with a diameter of 0.7 mm grouped in clusters of 4. All clustered pinholes together observe a field of view that has the shape of an hourglass with a diameter of 44 mm and an average longitudinal length of 33 mm (10). Total-body images are obtained by moving the animal through the scanner along a spiral trajectory (13). Data are collected in list-mode.
Image Reconstruction
SPECT images were reconstructed using projections from all bed positions simultaneously (14) using pixel-based ordered-subset expectation maximization (15). Three photopeak energy window settings were tested: a window set at the 440 keV photopeak, a window set at 79 keV, or both energy windows simultaneously. Scatter and background were corrected for with the triple-energy-window method (16). The 440 and 79 keV photopeak windows had 2 adjacent background windows each (Supplemental Fig. 1). For reconstruction, the standard SPECT system matrix was used (17) for the 79 keV energy window and a 511 keV system matrix for the 440 keV or the combined energy windows.
Phantom Experiments
A 5-mL syringe (internal diameter, 12.06 mm) was filled with 86.2 MBq of 213Bi in a volume of 2.0 mL (fill height, 17.7 mm) for determining the ability to recover different amounts of activity. A volume of interest (VOI) was drawn around the activity in the reconstructed image. On a dynamic scan (20 frames of 30 min), the activity concentration at the start of the acquisition was 36.2 MBq/mL of 213Bi and 0.0062 MBq/mL at the start of the last frame.
A second dynamic scan (90 frames of 5 min) of a 213Bi-filled syringe was obtained. The initial activity concentration in 2.0 mL within the 5-mL syringe was 25.1 MBq/mL of 213Bi and 0.0352 MBq/mL at the start of the last frame.
Reconstructions of both experiments were done with 4 subsets and 30 iterations; voxel size was 0.8 mm. A postreconstruction filter (3-dimensional gaussian) with 0.4 mm full width at half maximum (FWHM) was applied. All data were corrected for decay. The system performance was characterized with the RC, defined as the measured apparent radioactivity concentration divided by the true radioactivity concentration. For large objects and sufficient imaging times, RC should equal 1.
Spatial resolution was determined using a Jaszczak resolution phantom (HR-micro phantom; Vanderwilt Techniques) with hollow channels of 0.7-, 0.8-, 0.9-, 1.0-, 1.2-, and 1.5-mm diameters. The phantom was filled with 119 MBq of 213Bi (activity concentration, 198 MBq/mL) and scanned for 45 min. Images were reconstructed using 32 subsets, 60 iterations, and a voxel size of 0.4 mm. No postreconstruction filters were used. Profiles were determined from 5 single slices through the measured signal over a 0.4-mm cross-hair line drawn over the rods. Gaussian curves were fitted to these profiles and averaged, and their FWHM values were reported.
To assess the impact of lower numbers of counts on resolution, we also reconstructed this dataset using only 20%, 5%, and 1% of the counts from the list-mode data. This reconstruction emulates scans with shorter scan times or lower activities. We reconstructed the lowest activity scan with 4 subsets and 30 iterations on 0.4-mm voxels, which are the same reconstruction settings as used for the mouse scans. For the higher activities, more iterations were needed to recover finer details and thus we chose the same reconstruction settings as for the high-count reconstructions. Images were postfiltered with a 3-dimensional gaussian with 0.6, 0.9, and 1.0 mm FWHM for scans with 20%, 5%, and 1% of the counts, respectively.
An analysis of contrast-noise characteristics was performed similar to that by Walker et al. (18). Resolution phantom images were resampled to a fine 0.05-mm grid, and regions of interest (ROIs) with a diameter of 90% of the rod diameter were placed on top and in between the rods (Supplemental Fig. 2C). This was repeated over 20 slices. The mean activity inside the ROIs placed over the rods (hd) and in between the rods (bd) was determined. The contrast Cd for rod size d is then defined to be (Eq. 1)The variability between the ROI mean values was characterized by the noise parameter Nd:
 (Eq. 2)The SD σ of hd and bd were calculated over all ROIs in one third of the 20 slices to reduce inter-ROI covariance. The denominator
  indicates the mean value taken over all ROIs. The contrast-to-noise ratio was defined as Cd/Nd.
The quantification calibration procedure and determination of the calibration factors are described in the supplemental data and based on the method given in Wu et al. (19).
Ex Vivo Experiment
A nu/nu mouse bearing a CA20948 tumor xenograft was injected intravenously in the tail with 3.0 MBq of [213Bi-DOTA,Tyr3]-octreotate. The mouse was euthanized 38 min after injection and immediately imaged for 1 h. A CT scan was obtained after SPECT with the integrated CT scanner (acquisition parameters 55 kV and 615 μA and reconstructed with filtered backprojection), which was used only as an anatomic reference. SPECT reconstruction parameters comprised 4 subsets, 30 iterations, and a voxel size of 0.4 mm. A postreconstruction filter (3-dimensional gaussian) of 1.5 mm FWHM was applied. Tumor volume was determined by drawing VOIs in the CT images. The radioactivity uptake was based on the VOIs drawn in the SPECT images. Organs and tumor tissue were counted for 60 s in a Wallac Wizard γ-counter (PerkinElmer). Counting started 2.3 h after injection.
In Vivo Experiment
In an in vivo experiment, a BALB/c mouse was injected intravenously in the tail with 7.4 MBq of 213Bi-DTPA under isoflurane anesthesia. Dynamic acquisition of the abdominal region was started 3 min after injection over a total of nine 5-min frames. Equal reconstruction parameters were used as for the ex vivo experiment. SPECT-based VOIs were drawn over the urinary bladder and over both kidneys to determine their kinetics. The absorbed dose to the kidneys was determined using the sphere model within the Olinda/EXM code (20) and calculated for an average single kidney mass of 0.286 mg, determined from the mouse of the ex vivo experiment.
All animal studies were conducted in accordance with the guidelines and after approval of the Animal Welfare Committee of the Erasmus MC.
Statistics
Statistical analysis of the syringe experiments was performed with the GraphPad Prism software (GraphPad Software, Inc.). Average values of the RC from 213Bi-filled syringes, normalized to the initial value, were determined for each frame. Deviations from the horizontal line were analyzed according to the D’Agostini and Pearson normality test. Additionally, the Runs test was performed to decide whether the residuals followed a random pattern. The cutoff value for the linearity of RC was determined by the 3 σ outlier criterion on the moving average.
RESULTS
Quantitative Properties
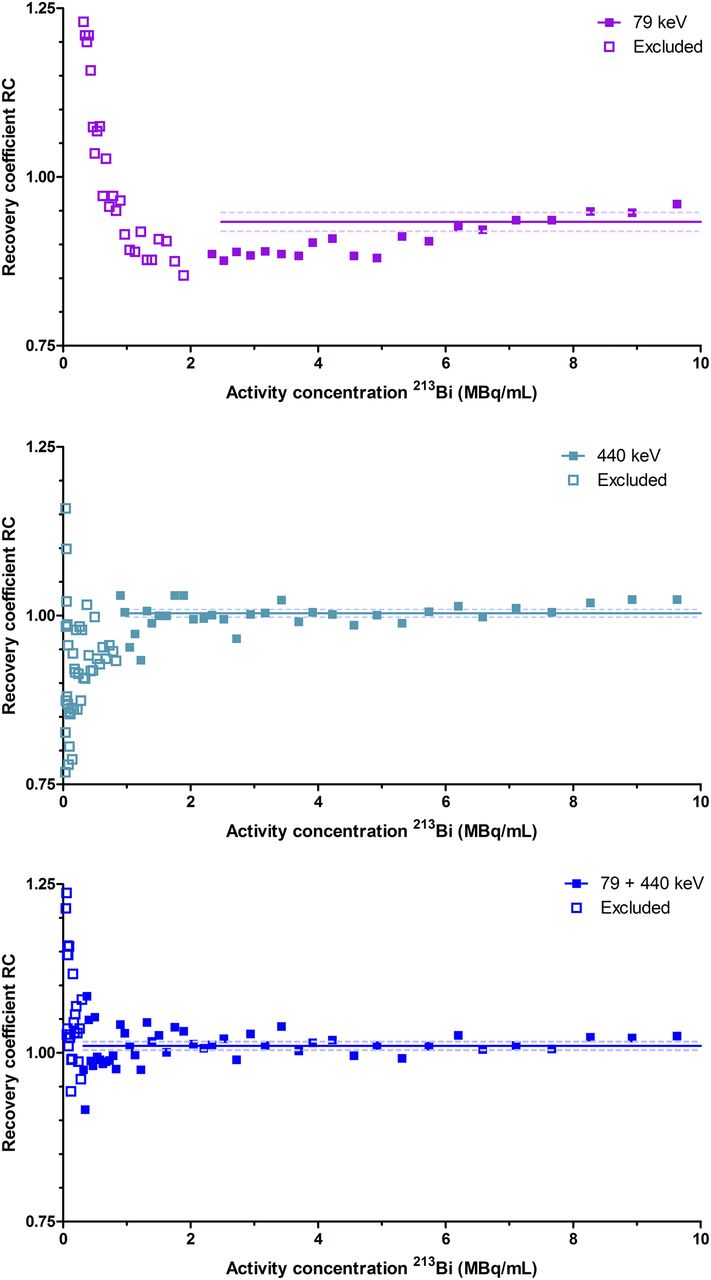
On the 30-min dynamic series, the RC was averaged over the linear range (Fig. 1). Cutoff values or lower limits for linearity found are indicated in Table 1. The RC was comparable for all energy window settings. The single 440 keV window setting showed the largest linearity range (lower limit, 0.24 MBq/mL).

RCs for syringe initially filled with 86.2 MBq of 213Bi (in 2.0 mL) scanned in 15 frames of 30 min. Results were fitted with a horizontal line when both residuals were normally distributed (D’Agostini–Pearson test) and showed no significant systematic deviation (Runs test). Open symbols indicate excluded RC values. Some data points at low-activity concentrations did not fall within y-axis boundaries.
Results from Measurements of 213Bi-Filled Phantoms
For the 5-min dynamic scans, the RC for the 79 keV/440 keV–combined energy peaks showed the best results as it remained constant down to 0.32 MBq/mL (Fig. 2). Below 2 MBq/mL, a more scattered pattern of the data points was visible, but this was not a statistical deviation due to the equal variations in the signal above and under the average RC line. The RC for the 79 keV photopeak on the 5-min dynamic scans did not meet all statistical tests. Therefore, the RC line in this graph can serve only as an indication. In general, the quantitative properties for activity recovery for images using the 440 keV peak and the combined peaks are comparable. Especially in the 5-min scans, these 2 settings have better quantitative properties than the single 79 keV peak setting. There was no difference in results when a 0.4- or 0.8-mm voxel size was applied in the reconstruction settings (data not shown).

RCs for syringe initially filled with 67.69 MBq of 213Bi (in 2.0 mL) scanned in 45 frames of 5 min. Results were fitted with horizontal line when both residuals were normally distributed (D’Agostini–Pearson test) and showed no significant systematic deviation (Runs test). Open symbols indicate excluded RC values. Some data points at low-activity concentrations did not fall within y-axis boundaries. Data for first 13 frames were omitted from graph but were included in averaging.
Spatial Resolution
Resolution phantom images are shown in Figure 3. Visually, images using the single 440 keV or the combined 79 keV/440 keV energy window setting appear to be much less noisy and have better resolution than the images using the single 79 keV energy window; on the reconstructions, 0.7-mm rods could be distinguished for the combined 79 keV/440 keV setting and for the single 440 keV window. Profiles are shown in Figure 4, and the mean FWHMs for the 3 energy windows are indicated in Table 1. These values showed a significant difference for the combined 79 keV/440 keV setting compared with the single 79 keV setting. Differences between the 440 keV and the combined 79 keV/440 keV setting were small, but the combined setting resulted in a slightly lower variation, indicating the most stable settings. Contrast and contrast-to-noise curves for all 3 energy window settings are shown in Figure 5 and are in agreement with the visual assessment; both contrast and contrast-to-noise are much better for the 440 keV or the 79 keV/440 keV window settings than the single 79 keV energy window. Although 0.7-mm rods could be distinguished in reconstructions, profiles revealed that these were really at the resolution limit. The contrast for these rods was found to be C0.7 = 0.34 for the 79 keV/440 keV combined window setting. To emulate lower activities, we also reconstructed resolution phantom images with only part of the list-mode data used (Supplemental Fig. 3). When only 20%, 5%, or 1% of the counts were used, respectively, rods that could still be distinguished were 0.8, 0.9, and 1.2 mm.

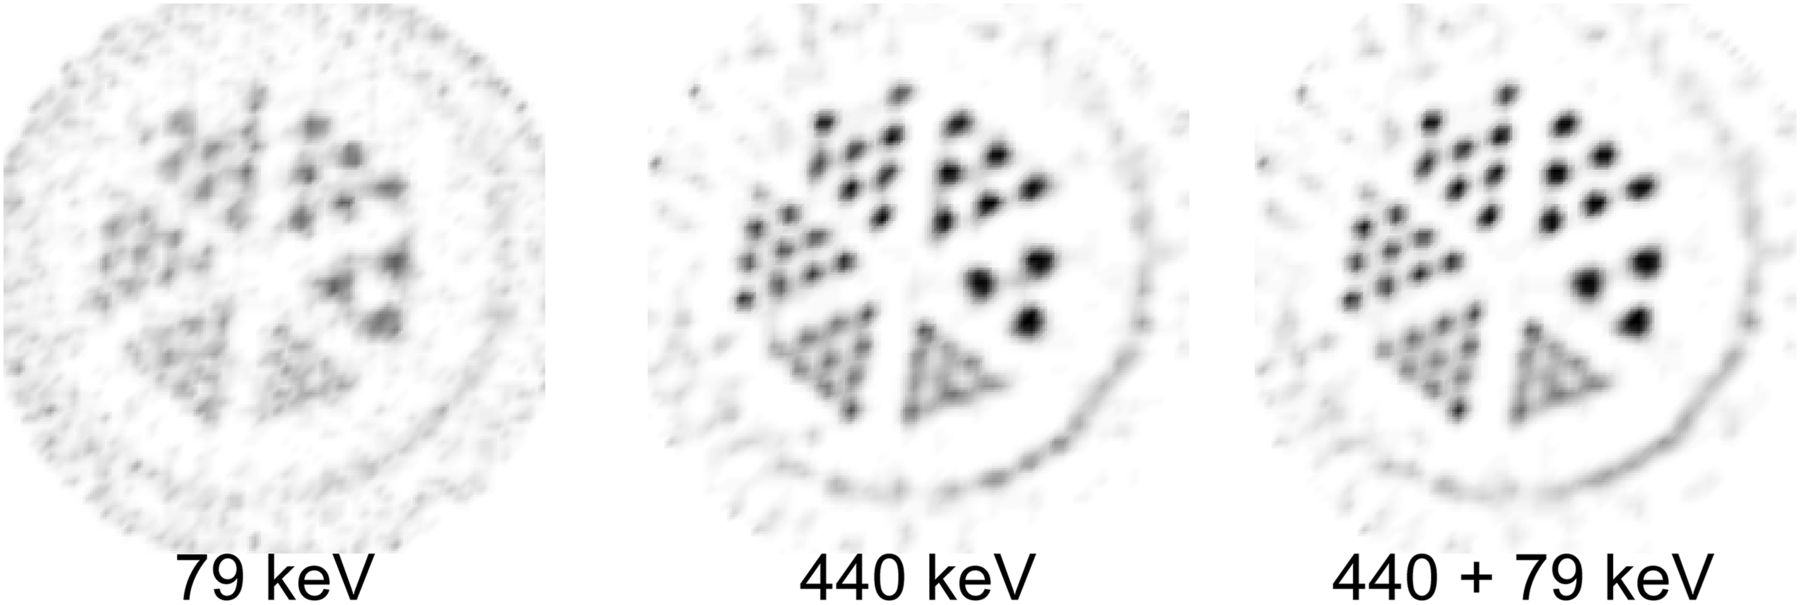
Resolution phantom images of 213Bi SPECT. Phantom has 6 segments containing capillary diameters of 1.5, 1.2, 1.0, 0.9, 0.8, and 0.7 mm. Images show reconstructions for different energy window settings summed over 5 slices (2 mm in total).
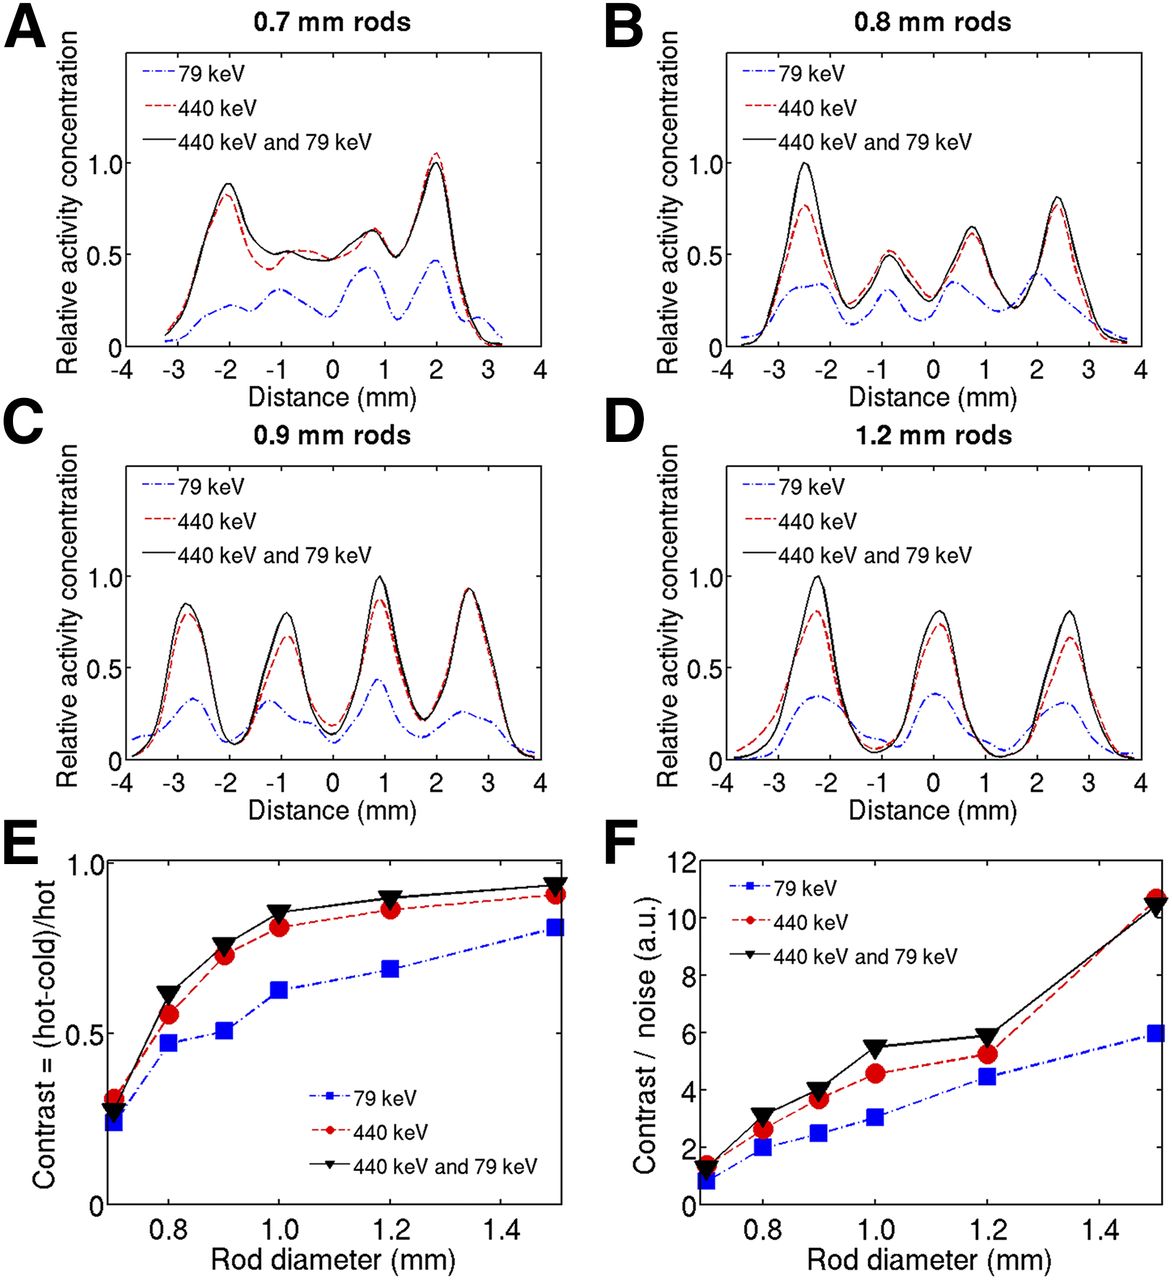
(A–D) Profiles through 0.7-, 0.8-, 0.9-, and 1.2-mm rods for single 79 and 440 keV and combined 79 keV/440 keV energy windows. (E and F) Contrast and contrast-to-noise curves for different rod sizes.

Ex vivo image of 3.0 MBq of [213Bi-DOTA,Tyr3]-octreotate injected in nude mouse. (Top to bottom) Maximum-intensity-projection images reconstructed at 79 keV, 440 keV, and both energy windows. Numbers in color table indicate radioactivity concentration in MBq/mL.
Ex Vivo Experiment
Tumor uptake by [213Bi-DOTA,Tyr3]-octreotate in the euthanized mouse was clearly visualized with the 440 keV and the combined 79 keV/440 keV energy window setting but not with the 79 keV setting (Fig. 5); 213Bi uptake in the kidneys was not visible though. The uptake in the xenograft amounted to 38 kBq, corresponding to a concentration of 0.42 MBq/mL for the 90-mm volume tumor. The activity in the abdomen below the tumor corresponded to 0.16 MBq/mL. A region within the mouse on the contralateral side of the tumor, not clearly linked to physiologic uptake, showed an uptake of 0.12 MBq/mL. The biodistribution assay of this mouse showed a tumor uptake of 5.3% of the injected activity (%IA) and with activity concentration of 0.36 MBq/g. The uptake in the left kidney was 1.9%IA (0.48 MBq/g).
In Vivo Experiment
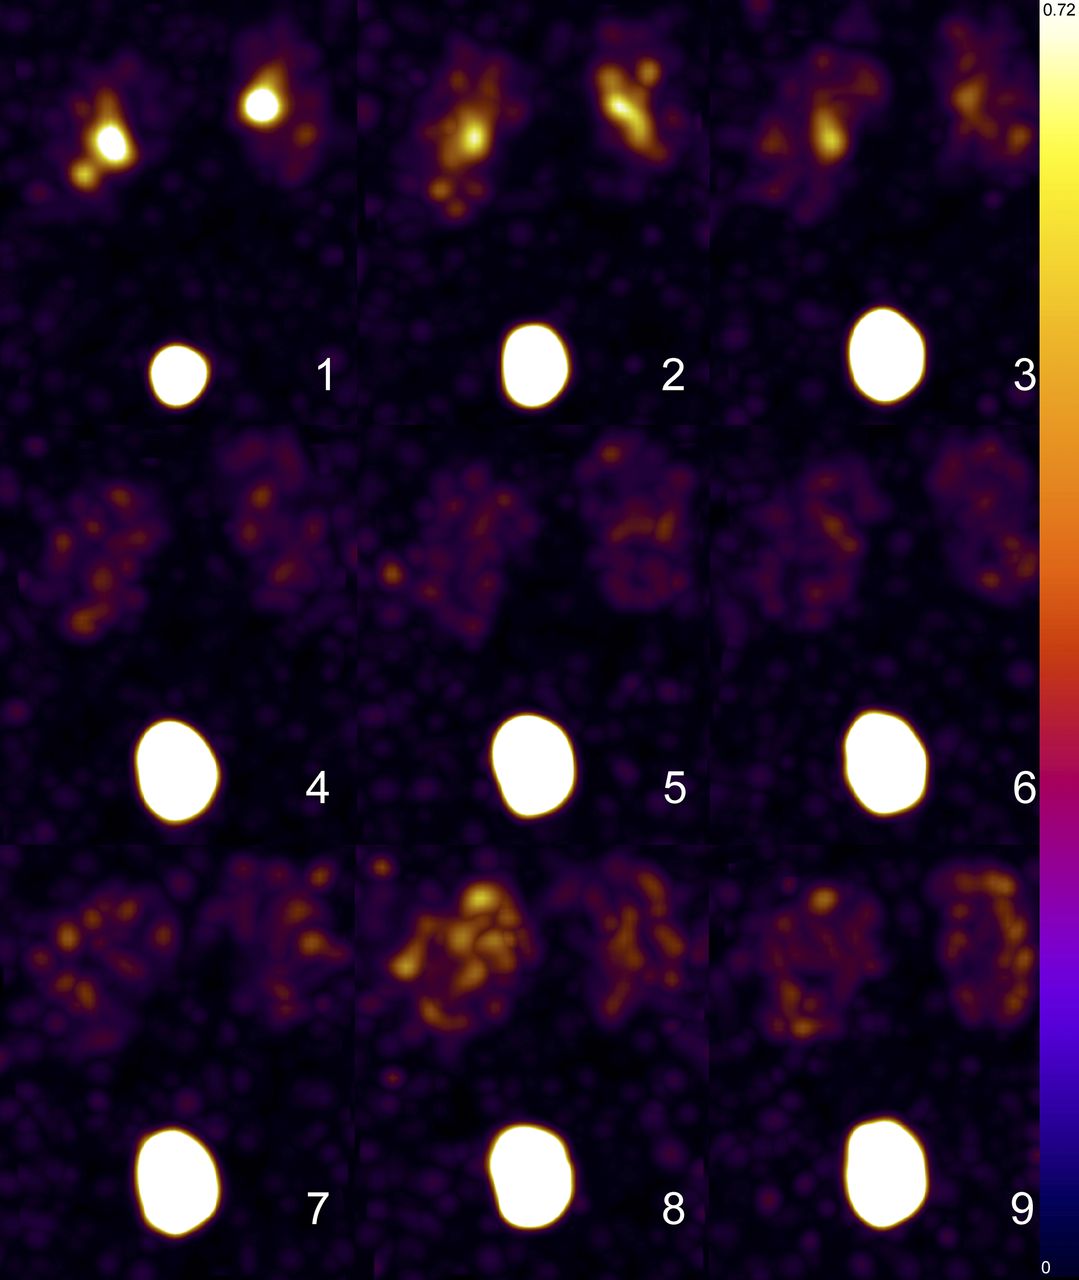
In vivo mouse maximum-intensity-projection images are shown in Figure 6 for the combined energy window as this setting was generally found to be optimal. The first frame in Figure 6 shows activity in both kidneys and bladder after injection with 7.4 MBq of 213Bi-DTPA. The filling of the urinary bladder was also visible by its enlargement over time, and in the first frame already exceeded the maximum displayed intensity. The activity in the kidneys gradually accumulated in the renal medulla as visualized in the maximum-intensity-projection image of Figure 6 and the quantitative VOI-based results in Figure 7. The peak uptake of 213Bi-DTPA in the kidneys was 18%IA. The kidney radioactivity uptake ranged between 0.34 and 0.66 MBq (1.2 and 2.3 MBq/mL). These SPECT-based activity concentrations in the kidneys were found to be well above the 0.32 MBq/mL threshold for linear response.

In vivo mouse maximum-intensity-projection images with 7.4 MBq of 213Bi-DTPA. Images were reconstructed using combined 79 keV/440 keV photopeak setting. In 9 consecutive 5-min frames, kidneys show up in each frame, initially showing ureters at top of image with gradually distribution to renal cortices and filling of bladder. Numbers in color table indicate radioactivity concentration in MBq/mL.

Kinetic modeling of 213Bi-DTPA in urinary bladder and kidneys. In decay-corrected data (A), bladder activity is fit by single exponential with half-life of 11 ± 2 min (effective half-life [Teff] = 15 min). Kidneys did not show clearance, whereas in uncorrected data (B) renal clearance proceeded with Teff of 52 ± 10 min. Images were reconstructed from combined 79 keV/440 keV photopeaks.
The decay-corrected radioactivity accumulation in the urinary bladder followed a single-exponential build-up pattern, with an 11 ± 2 min half-life. The non–decay-corrected uptake data of the kidneys could be fitted with a single exponential curve with an effective clearance half-life of 52 min (95% confidence interval, 36–96 min). A horizontal line was the preferred fit through the decay-corrected kidney data. The residence time for the 213Bi DTPA uptake in the kidneys was 11.7 ± 0.4 min, leading to an absorbed dose of 26 ± 2 Gy by 7.4 MBq. The largest part (94%) of this dose was delivered by the 213Po α-particles.
DISCUSSION
Direct imaging of the 440 keV γ-rays from 213Bi is possible with dedicated high-energy SPECT, despite the low activity injected to avoid an undesirably high dose to the animal. We found that including the 440 keV setting in image reconstruction is essential; using only 79 keV x-rays has a strong negative effect on image quality. Generally, the results for the 440 keV and the combined 440 keV/79 keV setting are close. Resolution and contrast-noise properties were slightly better for the combined setting, which also showed better quantification properties for short time frames. However, on longer time frames 440 keV alone performed slightly better. For low-count studies, the combined window performs better as it contains more counts, whereas for higher count levels the down-scatter of 440 keV gammas in the 79 keV photopeak adversely affects quantification.
Quantification sensitivity of the camera in the 5-min frame setting was high enough to allow kinetic modeling of the kidney uptake and bladder filling, which is apparent when comparing the results from the 5-min phantom scan and the results of the in vivo 213Bi-DTPA scan. Tumor and pancreas modeling should also be possible for most DOTA-conjugated somatostatin analogs as their uptake in mice is in the order of approximately 10%IA/mL (2) to even 225%IA/g for Exendin (21). With an injected activity of 5–10 MBq, this will lead to activities in these organs that enable 5-min frame scanning, but results will become uncertain when the activity concentration will drop below 0.32 MBq/mL. In those cases, longer time frames should be used with the risk of missing essential fast kinetic effects.
The maximum resolution reported here was achieved with a static scan and relatively high activity compared with that injected in mice. This was done to test (maximum) system performance for 213Bi imaging and to investigate optimal energy window settings, which is easiest on almost-noiseless data. As common in SPECT and shown in the supplemental data, the resolution that can be obtained depends on the number of detected counts, and thus increasing system sensitivity may be beneficial for 213Bi imaging in mice. Such sensitivity improvements have already been realized in practice through increasing crystal thickness, which makes the system 2.5 times more efficient. Furthermore, new high-energy collimators with larger sensitivities have been developed. The choice of collimator depends on the imaging task, and these higher sensitivity collimators may be suitable for 213Bi imaging. The VECTor system used in this paper is a first-generation scanner and could not benefit yet from these improvements.
Ex vivo and in vivo mouse experiments were performed as proof of principle, to investigate the feasibility to image the tumor and physiologic uptake using 213Bi. The reported kidney dose of 26 Gy by 213Bi-DTPA is, however, high and most probably would lead to renal toxicity at a later stage. Renal toxicity has been observed after scanning 111In-labeled peptides with cumulative kidney doses of 20–40 Gy (20). Considering the high linear energy transfer nature of its radiation, 26 Gy by 213Bi will be at least as equitoxic as 20–40 Gy by 111In.
The biodistribution assay for [213Bi-DOTA,Tyr3]-octreotate showed an absolute tumor uptake of 5.3%IA and 1.9%IA in the kidney. The renal uptake was therefore too low to be detectable on SPECT. These uptake values are higher than found from the SPECT data. It is not clear what caused this discrepancy.
The uptake of 111In-DTPA in rat kidneys has been reported to be 0.9% ± 0.2%/mL at 38 min after injection (22). Initially (at 2–4 min) the peak activity in the renal cortex is 5–7 times higher by perfusion with radioactive blood. The uptake of 213Bi-DTPA in the kidneys seems to be much higher than that observed with 111In-DTPA, possibly the result of the persistent uptake of 213Bi in the kidneys, independent of the compound administered (23). Species-specific differences in DTPA uptake by mice and rats could also cause this difference, but the reported renal uptake of 111In DTPA in dogs was found to be comparable to the rat values (24).
Using significantly higher injected activities of 213Bi-labeled peptides for better quantification is not ideal both for the consequentially higher amount of peptide needed, which might partially block receptor-mediated targeting, and for the increased probability of radiation toxicity.
CONCLUSION
We have shown that it is possible to image 213Bi at a submillimeter resolution level with a SPECT system equipped with a dedicated high-energy collimator. We found that the use of the 440 keV γ-ray peak is essential and produced significantly better images than the 79 keV x-ray peak. Quantification of the 213Bi activity concentration was reliable above 0.240 MBq/mL with 30-min image time using the 440 keV energy window setting and above 0.320 MBq/mL with 5-min frames using the combined energy window setting. Uptake of [213Bi-DOTA,Tyr3]octreotate in a CA20948 tumor xenograft was well visualized. Dynamic in vivo imaging of the 213Bi-DTPA distribution in a mouse showed distinct renal uptake patterns, enabling identification of suborgan distributions (renal cortex). Quantification of the uptake data allowed kinetic modeling and estimation of the absorbed dose to the kidneys, albeit with uncertainties of around 20%.
DISCLOSURE
The costs of publication of this article were defrayed in part by the payment of page charges. Therefore, and solely to indicate this fact, this article is hereby marked “advertisement” in accordance with 18 USC section 1734. The Dinse Stiftung (Germany) provided financial support. No other potential conflict of interest relevant to this article was reported.
Footnotes
Published online Dec. 3, 2015.
- © 2016 by the Society of Nuclear Medicine and Molecular Imaging, Inc.


