


Abstract
The aim of our study was to create a novel Gaussian mixture modeling (GMM) pipeline to model the complementary information derived from18F-FDG PET and diffusion-weighted MRI (DW-MRI) to separate the tumor microenvironment into relevant tissue compartments and follow the development of these compartments longitudinally. Methods: Serial 18F-FDG PET and apparent diffusion coefficient (ADC) maps derived from DW-MR images of NCI-H460 xenograft tumors were coregistered, and a population-based GMM was implemented on the complementary imaging data. The tumor microenvironment was segmented into 3 distinct regions and correlated with histology. ANCOVA was applied to gauge how well the total tumor volume was a predictor for the ADC and 18F-FDG, or if ADC was a good predictor of 18F-FDG for average values in the whole tumor or average necrotic and viable tissues. Results: The coregistered PET/MR images were in excellent agreement with histology, both visually and quantitatively, and allowed for validation of the last-time-point measurements. Strong correlations were found for the necrotic (r = 0.88) and viable fractions (r = 0.87) between histology and clustering. The GMM provided probabilities for each compartment with uncertainties expressed as a mixture of tissues in which the resolution of scans was inadequate to accurately separate tissues. The ANCOVA suggested that both ADC and 18F-FDG in the whole tumor (P = 0.0009, P = 0.02) as well as necrotic (P = 0.008, P = 0.02) and viable (P = 0.003, P = 0.01) tissues were a positive, linear function of total tumor volume. ADC proved to be a positive predictor of 18F-FDG in the whole tumor (P = 0.001) and necrotic (P = 0.02) and viable (P = 0.0001) tissues. Conclusion: The complementary information of 18F-FDG and ADC longitudinal measurements in xenograft tumors allows for segmentation into distinct tissues when using the novel GMM pipeline. Leveraging the power of multiparametric PET/MRI in this manner has the potential to take the assessment of disease outcome beyond RECIST and could provide an important impact to the field of precision medicine.
PET and MRI have been successfully integrated into a combined imaging solution in clinics and preclinical laboratories worldwide and represent a mature imaging modality (1). However, because of the relatively short time period in which PET/MRI solutions have been available, oncologic applications that use the complementary information obtained from the separate modalities are in their infancy. Several investigations have compared 18F-FDG PET/CT and diffusion-weighted (DWI) MRI measurements on the same cancer patients to determine the best approach for patient staging, prognosis, and therapy stratification, pitting PET/CT against MRI, but have not looked thoroughly into the combined utility of 18F-FDG PET and MRI (2–5). In 2 of these investigations (4,5), an inverse correlation between 18F-FDG uptake and DWI metrics in cancerous lesions has been shown.
DWI is a noninvasive technique to measure the self-diffusion of water in vivo and is often quantified by the apparent diffusion coefficient (ADC). Malignant tumors generally have lower ADC values than benign or necrotic tissues because of water movement restriction caused by increased cellularity (5). Measurements of tumor cellularity in non–small cell lung cancer (NSCLC) patients with DWI have been used to predict tumor invasiveness at early stages and have been shown to characterize well-differentiated adenocarcinoma from other types of lung carcinoma (6). The underlying mechanism associating changes in ADC to therapeutic response is a decreased cellularity resulting from necrosis and apoptosis (7). In some cases, an initial decrease in ADC, attributed to cellular swelling or reduced blood flow (8), is attributed to treatment response.
18F-FDG uptake in lung cancers has been associated not only with glucose transporter 1 and hexokinase activity, biologic components directly related to glucose metabolism, but also with hypoxia-inducible factor 1-α, vascular endothelial growth factor, its receptor, and microvessels (9). This implicates a complex link between glucose consumption and many opposing factors involved in the multifaceted tumor microenvironment. Moreover, 18F-FDG can potentially stage tumors in patients with histologically verified NSCLC (10–12), and changes in 18F-FDG uptake after therapeutic intervention are correlated to patient prognosis (13–15), possibly predicting response (14). Adding biologic information measured with DWI might further improve staging and help decide on patient-individualized therapies for treating noninvasive adenocarcinomas (15).
To fully use multiparametric PET/MR imaging, assessment of disease outcome needs to go beyond RECIST (16) and move toward comprehensive algorithms, which unify the complementary datasets. Recently, Schmidt et al. have reported on the correlation of ADC and 18F-FDG inside of NSCLC tumors using a hybrid PET/MR (17). They applied a Gaussian mixture model (GMM) (18) and theorized that it separated the tumors into distinct and relevant tissue classes. Their investigation did not, however, include a histologic validation, track changes longitudinally, or use adaptive clustering techniques. The aim of our study was to create a novel clustering pipeline to model the complementary information derived from 18F-FDG and ADC to separate the tumor microenvironment into relevant tissue compartments and follow their development longitudinally. A correlation with imaging and histology was established to validate our model and guide a longitudinal implementation so that it was possible to observe the dynamics of individual tissue compartments over time.
MATERIALS AND METHODS
A detailed description of cell culturing, animals, tumor inoculation, 18F-FDG production, PET and MR imaging, and image coregistration and statistics can be found in the supplemental data (supplemental materials are available at http://jnm.snmjournals.org). The rest of this section describes details of our modeling pipeline.
The clustering workflow of PET/MRI data was performed in 2 major steps: GMM on all last time points of the 18F-FDG and ADC datasets and GMM on individual measurements (Fig. 1). The first step (population initialization) involved combining PET/MRI data acquired at the last time points from all tumors into one dataset. The combined dataset serves as a reference for the initialization of GMM in subsequent steps, as these voxel pairs represent the heterogeneity expected in all measurements. Before segmentation, the dataset was normalized to the unit standard deviation (SD). Voxels with ADC values lower than 50 × 10−6 mm2/s were labeled as noise and excluded from initialization; a 2-dimensional (2D) Gaussian distribution was fit to the noise cluster. Cluster initialization was performed on the noise-free dataset by repeatedly running the K-means (18) algorithm with 3 randomly seeded centroids. The model parameters of the noise and noise-free clusters were used to initialize GMM on the combined dataset. The choice of 3 tissue clusters and 1 noise cluster was based on visual inspection of the data (Figs. 2 and 3).

In the first step of the GMM workflow, data from the last imaging time point of all tumors are pooled into a single population and initialized. Step 2A uses initialization from step 1 to segment the last time point of each tumor. Step 2B uses adaptive scaling on all early time points for each tumor while holding the GMM parameters from step 2A constant.
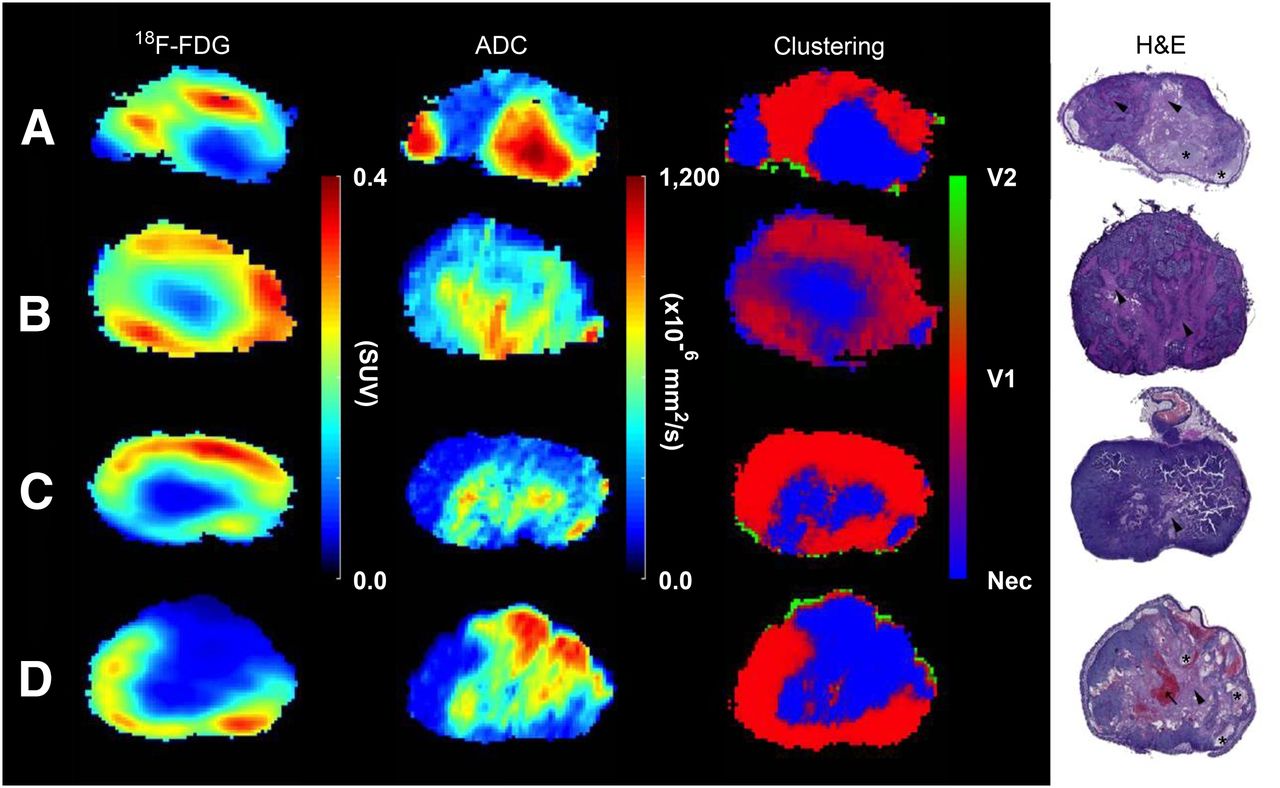
(From left to right) 18F-FDG, ADC, clustering, and hematoxylin and eosin (H&E) examples are displayed for comparison. GMM was applied to the last time point of 18F-FDG and DW-MR images to cluster them into viable (red, V1, and green, V2) and necrotic (blue, Nec) regions. Manually delineated H&E stainings were coregistered to tumor volumes to verify tissue classification. Liquefactive (asterisk) and coagulative necrosis (arrowhead) and blood vessel congestion (arrow) are depicted in the H&E stainings.

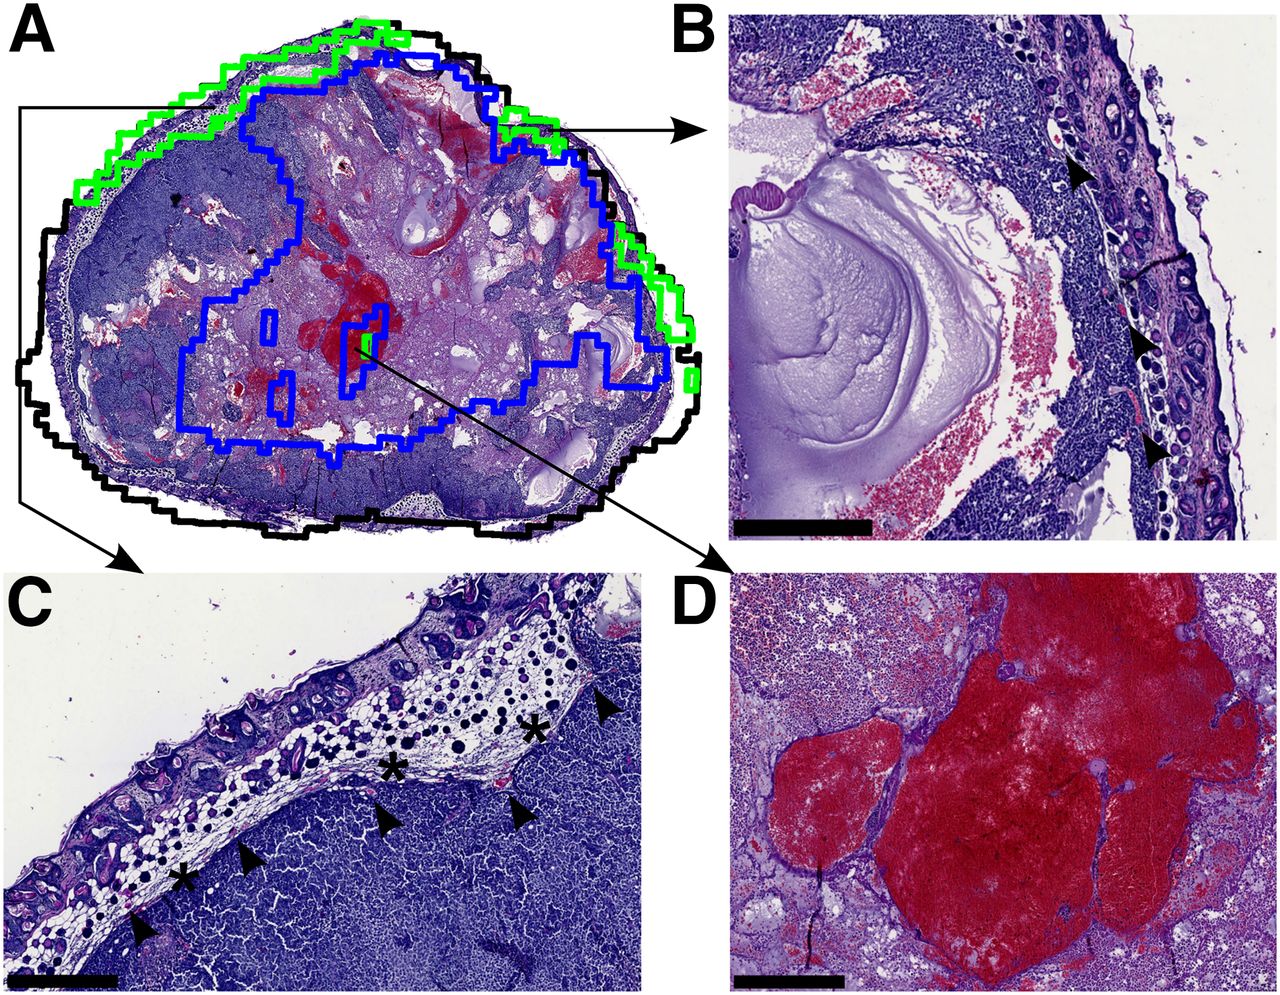
(A) Outlines of the coregistered clustering slice (black) and V2 (green) and necrosis (blue) are placed on top of the histology slice for comparison of agreement between imaging and histology. (B and C) V2 is seen at the periphery of the tumor along with blood vessels (arrows) and connective tissue (asterisk). (D) Slight misclassification of the necrotic area occurred due to artifacts produced in ADC because of the blood-pool.
In step 2A, the last time point of each tumor was normalized to unit SD, and the noise cluster was extracted as described above. Here, the model parameters of the noise (corresponding to last time point of respective tumor) and noise-free clusters (obtained in step 1) were used to initialize GMM on the last time points. After termination of the expectation maximization algorithm, the clustering probability map of the last time point of each tumor was validated with respective histology (Fig. 4). After validation, the model parameters of the noise-free clusters of each last time point were used to perform hard clustering (model parameters were fixed) on the early measurements of the respective tumor (step 2B). The noise cluster was characterized as described above. Because 18F-FDG measurements are vulnerable to variability, the data from early time points were adaptively scaled by a multiplicative factor to fit the given distribution. The clusters in the last step were fixed for 2 main reasons: once validated with histology, the noise-free cluster parameters of the last time point can be considered as GMM representative of the respective tumor tissue classes, and the density-based models have the tendency to partition data irrespective of their biologic significance. It is highly likely that the necrotic and viable fractions of tumors in early time points are different as compared with that in the last time point. Keeping the clusters fixed does not forcefully assign false observations to different clusters and models the tumor progression judiciously. For the sake of comparison, a 1-dimensional (1D) GMM was performed in the same manner with only the ADC data.

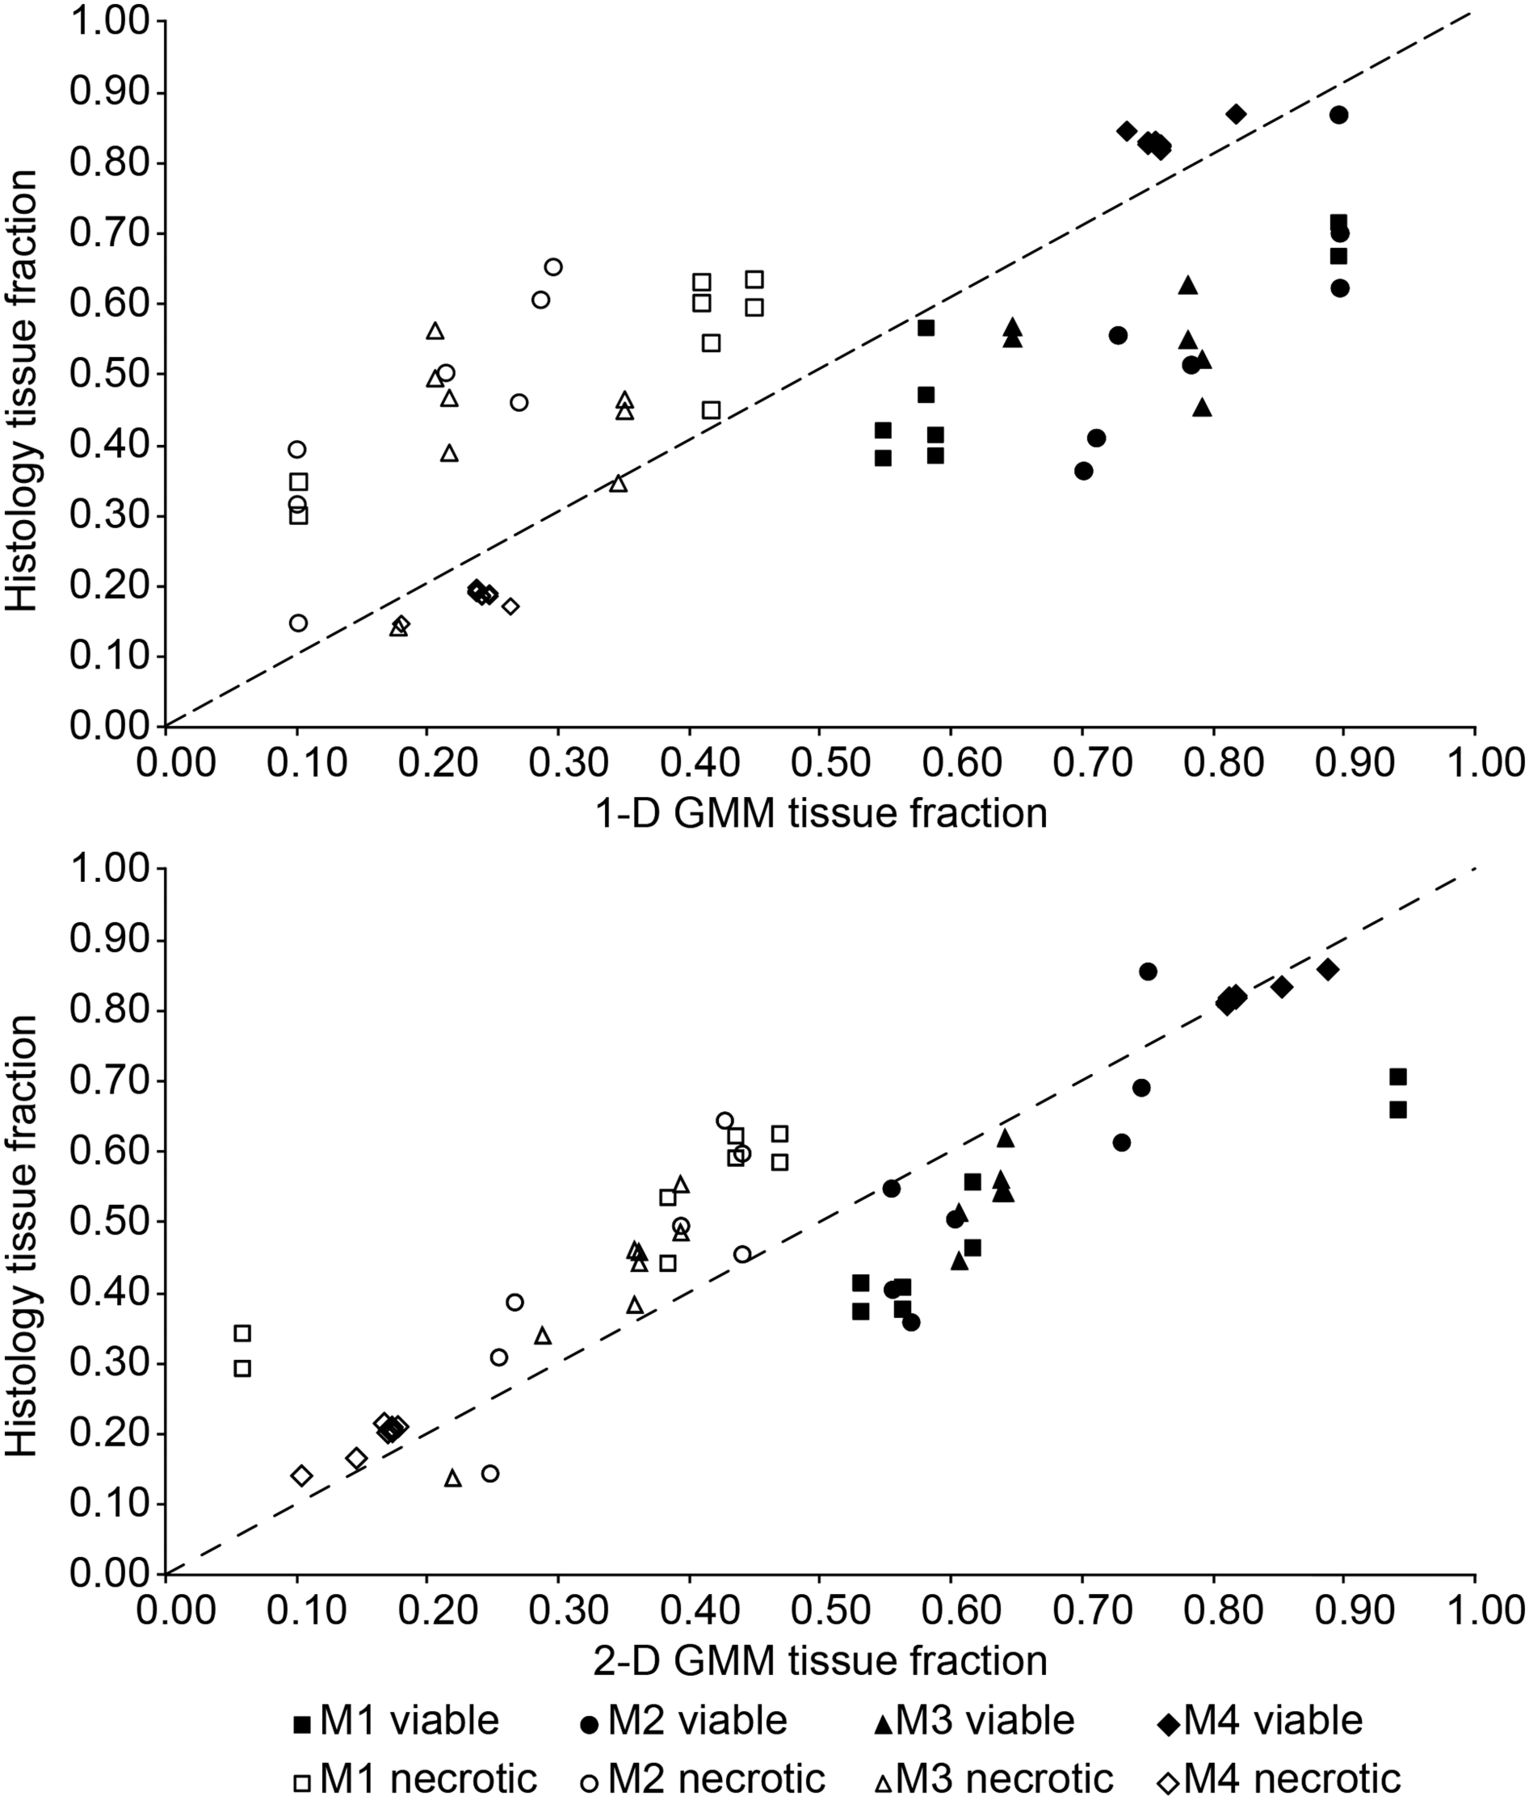
Necrotic (open symbols) and viable (filled symbols) tissue fractions taken from matching H&E, and clustering imaging slices are plotted for each mouse (M1–M4) along with the line of identity as validation of GMM tissue classification. For the sake of comparison, a 1D GMM was applied to only the ADC parameter. A 2D GMM was applied to the combined 18F-FDG and ADC imaging dataset.
RESULTS
Hematoxylin and eosin (H&E) stainings depict tumors with large atypical cells with prominent nucleoli and abundant cytoplasm. Mitosis and apoptosis are frequently seen (Fig. 2). Liquefactive and coagulative necrosis is seen along with blood vessel congestion and dilation. Visual inspection of the manually aligned histology and delineated tumor slices revealed that a good coregistration was achieved (Fig. 3). Uncertainty in tissue classification is denoted by a weighted sum of colors and is exemplified in the clustering results (Fig. 2B), which exhibits fingerlike regions of coagulative necrosis in the histology; a similar texture is seen in the corresponding clustering probability map. There are 2 viable regions present, V2 (green) and V1 (red). V2 is seen only at the periphery and corresponds to connective tissue, dense cells, and vessels (Fig. 3), whereas V1 is bigger and represents densely packed tumors cells.
The median values and the interquartile range for the average tumor, necrotic, viable, and noise regions are summarized for both 18F-FDG and ADC (Table 1). The 18F-FDG average values are highest for the viable tissue and lowest for the necrotic tissue, whereas the ADC is highest for the necrotic regions and lowest for the viable regions across all time points.
Median and Interquartile Range for Whole Tumor and Individual Clusters
The fractions of necrosis and viable tissue in H&E stainings correlate quite well to corresponding tissue fractions in clustering slices (Table 2) and are plotted (Fig. 4) for each mouse along with the line of identity. Tissue fractions were derived from manually drawn regions on histology (Supplemental Fig. 2). In both the 1D (ADC only) and the 2D (ADC and 18F-FDG) cases, the GMM had a tendency to overestimate viable regions and underestimate necrotic regions. In general, the tumor clustering results were more influenced by ADC (in the 2D case); however, the overall better agreement between histology in the 2D GMM serves as a validation of this methodology. The slice-by-slice correspondence between the 2D GMM and histology was calculated with the Dice coefficient (Supplemental Table 2).
Correlation Values for Histology and GMM Tissue Fractions
In Figure 5, the histograms of ADC and 18F-FDG for 4 different time points from mouse 3 are shown along with corresponding density and scatter plots. The ADC histograms become increasingly skewed toward higher values as tumors become more necrotic. The 18F-FDG histograms, on the other hand, demonstrate large variability, consequently maintaining a similar average value for all time points. In general, as the tumors grow in size, so does the negative correlation between 18F-FDG and ADC on a voxelwise basis (Supplemental Fig. 3).

Histograms represent distributions of ADC and 18F-FDG values at 4 time points for a single mouse. Density scatter plots depict the voxelwise relationship of ADC and 18F-FDG values in the tumor. In the scatter plots on the right, necrotic tissue is in blue, viable is in green and red, and noise is in black. Combined probabilities of necrotic and viable classes are shown as a mixture of colors.
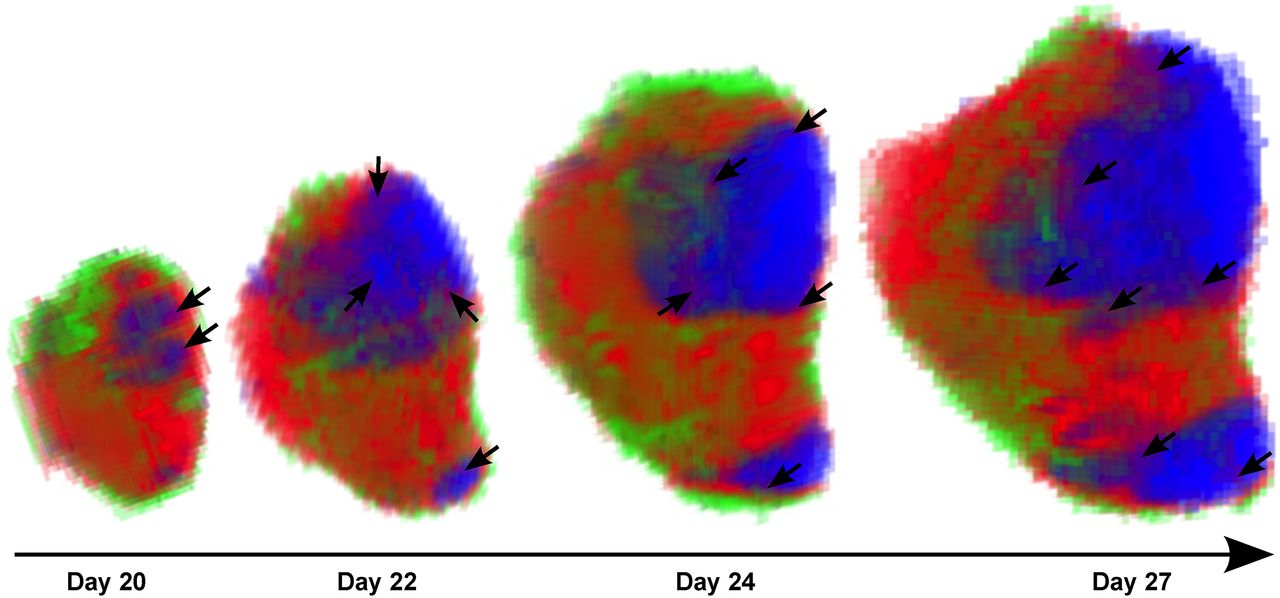
The 3-dimensional renderings of an exemplary tumor (mouse 3) depict the spatial–temporal evolution of viable (red and green) and necrotic (blue) tissue compartments (Fig. 6). The initial necrotic portion at the first time point retains its relative position in the tumor and becomes larger over time. In the second time point, a smaller necrotic region appears in the lower portion of the tumor and also increases in size while retaining its relative position in the tumor. Moreover, purple areas on the rim of the necrotic region are due to the mixed probability of belonging to the viable or necrotic tissue class; the purple regions are possibly associated with hypoxic areas in the tumor (Supplemental Fig. 4). The green viable region is consistently located at the exterior of the tumor.

A 3-dimensional rendering depicts spatial–temporal growth of tumors and development of tissue classes. Red and green represent viable tissue, and blue represents necrosis. A purple rim (arrows) is seen around the necrosis and represents the combined probability of necrotic and viable tissue classes, possibly indicating hypoxic cells.
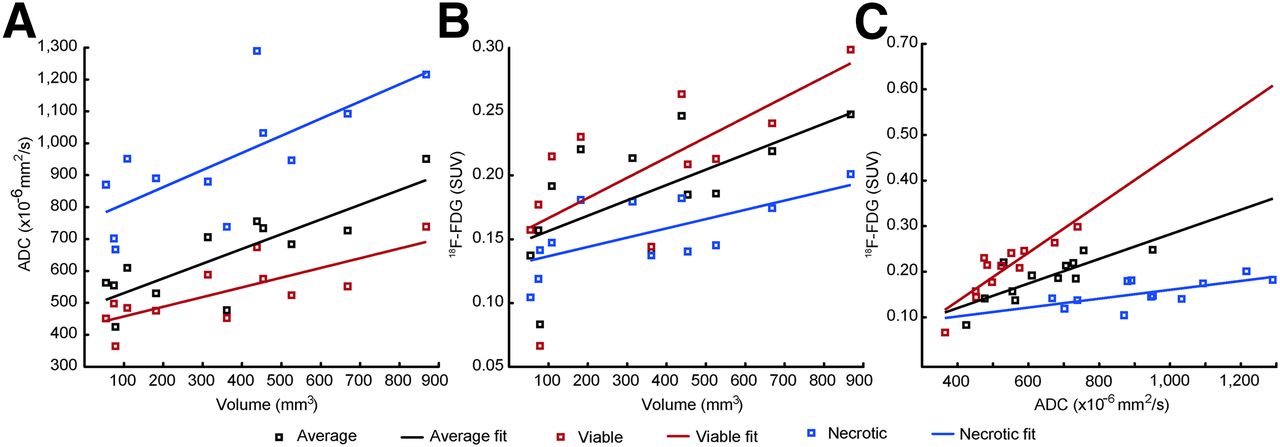
The linear regression analysis supported the hypothesis that tumor volume was positively correlated to ADC and 18F-FDG for the whole tumor and for the viable and necrotic regions (Supplemental Table 1). ADC was also a highly significant predictor for 18F-FDG in the whole tumor and in the segmented viable and necrotic regions. There was no significant difference between the slopes of the ADC versus volume (Fig. 7A) and 18F-FDG–SUV versus volume (Fig. 7B). After the slopes of each group were constrained, the Tukey–Kramer post hoc test confirmed that a significant difference existed between all groups (Fig. 7A) and the viable and necrotic regions (Fig. 7B); the slopes of the regression lines (Fig. 7C) were significantly different from one another.

Average ADC (A) and 18F-FDG (B) values for different tissue classes plotted against whole tumor volume. 18F-FDG values plotted against ADC values (C) for each class.
DISCUSSION
We have developed a GMM pipeline to assess tumor heterogeneity using information from both PET and MRI, showing how necrotic and viable regions develop in a longitudinal manner. We validated the methodology both visually (Figs. 2 and 3) and quantitatively (Fig. 4) and have found a good agreement between clustering results and histology. We have shown how the intratumoral relationship between 18F-FDG and ADC changes longitudinally (Fig. 5). Moreover, the manner in which the GMM segments the tumors has been shown. The visualization of an exemplary tumor reveals how tissue classes develop spatially over time (Fig. 6). Last, we have shown a positive, linear relationship between 18F-FDG and ADC values in the tumor (Figs. 7A and 7B), and ADC was shown to be an excellent predictor of 18F-FDG in this tumor model (Fig. 7C).
In this study, the ADC values in the necrotic regions are low compared with results from other investigators who have also used similar segmentation techniques on purely MRI data, validated with histology, to create 2 necrotic region types with the following values: (1,510 ± 120 and 1,560 ± 240) (19), (1,260 ± 130 and 1,610 ± 41) (20), and (2,120 ± 50 and 1,790 ± 10) (21) × 10−6 mm2/s. The b-values being used affect the ADC values, with lower b-values being heavily perfusion-dependent and responsible for increasing the overall ADC. Higher b-values (>100) are desirable to suppress perfusion-weighted components of well-perfused regions (22). In the 3 aforementioned studies, b-values below 100 were used in the calculation of the ADC maps, whereas we used b-values greater than 200.
Knowing the extent of necrosis in a tumor model can be helpful as it can be the source of confounding results in determining the efficacy of potential tumor therapies, as is the case with Berry et al. who found that necrotic fractions contributed only noise to the measurement of a therapeutic effect in an antiangiogenic drug therapy study (19). Moreover, the extent of necrosis might help to identify hypoxic tissues at the rim of necrosis and guide therapy options, because hypoxic tissues are well known to be highly resistant to radiation therapy (23). We also observed that perinecrotic tissue stains positive for hypoxia-inducible factor 1-α (Supplemental Fig. 4), an indirect marker of tissue hypoxia. Although 18F-FDG is not specific for hypoxic tissue, hypoxia has been shown to correlate to 18F-FDG uptake (24).
The increase in the ADC value in the viable regions (Fig. 7A) indicates that these regions are becoming less dense, presumably because of micronecrosis as seen in the histology (Fig. 2). In the ideal case, the necrotic regions would have a slope of zero. The increase in both the parameters over time (Fig. 7C) could suggest that as the tumor becomes larger, it also becomes more aggressive because of the increased necrotic burden, which harbors an increased interstitial pressure, low oxygenation, and oxygen reactive species due to opened cell membranes (25–27). On the other hand, no partial-volume correction was performed in this study and could be a cause for the volume-dependent increase in 18F-FDG values (Fig. 7B).
A positive correlation between ADC and 18F-FDG SUV could seem, at first glance, inconsistent with findings from Schmidt et al., who have reported a negative correlation between SUVmax and ADCmin (17). However, in accordance with Schmidt et al., the intratumor correlation coefficient is mostly negative for all tumors and becomes more negative as the total tumor volume increases (Supplemental Fig. 3). Thus, on a voxelwise basis, an L-shaped 2D histogram is seen in the tumors of this study and in the human lung tumors from Schmidt et al. Several other authors have also reported significant negative correlations between ADC and 18F-FDG in various types of malignancies. Nakajo et al. reported a correlation coefficient of ρ = −0.56 in head and neck squamous cell carcinomas for ADCmean and 18F-FDG SUVmax (28); Baba et al. reported ρ = −0.36 in breast lesions for ADCmean and 18F-FDG SUVmax (29); and Rakheja et al. reported a range of ρ values from −0.18 to −0.29 in various neoplastic lesions, for various combinations of 18F-FDG SUV and ADCmin and ADCmax (30). None of these studies reported the correlation between 18F-FDG SUV and ADC longitudinally, as performed in this study, making it hard to compare. Nakajo et al. did, however, correlate ADC and 18F-FDG SUV to patient survival, with higher ADCs and lower 18F-FDG SUVs associated with disease-free survival. The number of negative correlations observed could imply that ADC and 18F-FDG SUV move along a negative slope in patients receiving treatment. In the NCI-H460 xenograft tumors of this study, the viable tissue regions are more island-shaped, with micronecrosis between dense clusters of cells, which could lead to a positive correlation in both ADC and 18F-FDG SUV mean values over time.
The ability of the proposed model to accurately segment the tumor microenvironment into the proposed viable and necrotic regions is dependent on the relationship that 18F-FDG and ADC voxels inside of the tumor have. There was a definite negative correlation between the 2 imaging parameters at the time point we chose to validate our model. The tissue classes have to be present to create the shape seen in the 2D histogram of the last time point (Fig. 5); otherwise, this tissue heterogeneity will not be incorporated into the model for earlier time points.
The clear limitation of this study is that the tumors were subcutaneously inoculated in immune-compromised mice. An orthotopic or genetic mouse model could have led to greater tissue heterogeneity with an increase in the number of tissue classes to identify. In addition, serial PET/MR imaging measurements were used in this study, whereas the use of a recently developed, combined PET/MR system (31) for measurements could have decreased the error due to rigid coregistration, which might have been further increased by movement of the animal from the PET to the MRI scanner, eventually leading to nonrigid movements of the subject. Also, clustering results were not verified with histology at every time point. Future studies will focus on the automatic, nonrigid coregistration of histology with imaging data to obtain a better degree of spatial correspondence (Supplemental Table 2) than we were able to achieve in this study. Obtaining a good degree of spatial correspondence poses its own unique challenges because of nonrigid deformations of histology.
In summary, with the proposed GMM pipeline we incorporated the complementary information intrinsically associated with DW-MRI and 18F-FDG PET. One class of necrotic tissue was found, along with 2 classes of viable tissue. The green tissue class was found only at the periphery of the tumor and represents densely packed cells, vessels, and connective tissue; it has the lowest ADC values. This tissue class presumably represents the new outgrowth of the tumor and could provide a hint as to the direction of growth, as the tumor appears to progress in the direction of this tissue class at every time step (Fig. 6). Because necrosis has been indicated for poor survival outcome and has been associated with hypoxia, measuring the relative abundance of necrosis could help physicians to stratify patients accordingly and decide on the type of therapy (32). The opportunity to measure the relative size and growth patterns of different tissue types after the induction of treatment will help to gauge the overall response to tumor therapy, as well as to be useful for monitoring and optimizing the drug dose and scheduling in preclinical animal models.
CONCLUSION
The complementary information from 18F-FDG SUV and ADC longitudinal measurements in tumors allows for segmentation into distinct tissue classes when the proposed GMM pipeline is used. Leveraging the power of multiparametric PET/MR imaging in this manner has the potential to take the assessment of disease outcome beyond RECIST and into the realm of precision medicine.
DISCLOSURE
The costs of publication of this article were defrayed in part by the payment of page charges. Therefore, and solely to indicate this fact, this article is hereby marked “advertisement” in accordance with 18 USC section 1734. Research support for this study was received from the German Ministry for Education and Research (BMBF), grant 0316186E; the Swiss Werner Siemens Foundation; the Fortüne at the University of Tuebingen (Evaluation of Tumor Heterogeniety Using Clustering of Multi-Modality Imaging Data, fortüne 2131-0-0); and the European Research Council (ERC), grant 323196. No other potential conflict of interest relevant to this article was reported.
Acknowledgments
We acknowledge the generous technical support from Nadine Bauer, Funda Cay, Maren Harant, and Daniel Bukala.
Footnotes
Published online Dec. 10, 2015.
- © 2016 by the Society of Nuclear Medicine and Molecular Imaging, Inc.
REFERENCES
- Received for publication July 17, 2015.
- Accepted for publication November 17, 2015.


