


Abstract
Recent advances in SPECT technology including cadmium–zinc–telluride (CZT) semiconductor detector material may pave the way for absolute myocardial blood flow (MBF) measurements by SPECT. The aim of the present study was to compare K1 uptake rate constants as surrogates of absolute MBF and myocardial flow reserve index (MFRi) in humans as assessed with a CZT SPECT camera versus PET. Methods: Absolute MBF was assessed in 28 consecutive patients undergoing adenosine stress–rest myocardial perfusion imaging (MPI) by 99mTc-tetrofosmin CZT SPECT and 13N-ammonia PET, and MFR was calculated as a ratio of hyperemic over resting MBF. Results from both MPI methods were compared, and correlation coefficients were calculated. The diagnostic accuracy of CZT MFRi to predict an abnormal MFR defined as PET MFR less than 2 was assessed using a receiver-operator-characteristic curve. Results: Median MBF at rest was comparable between CZT and PET (0.89 [interquartile range (IQR), 0.77–1.00] vs. 0.92 [IQR, 0.78–1.06] mL/g/min; P = not significant) whereas it was significantly lower at stress in CZT than PET (1.11 [IQR, 1.00–1.26] vs. 2.06 [IQR, 1.48–2.56] mL/g/min; P < 0.001). This resulted in median MFRi values of 1.32 (IQR, 1.13–1.52) by CZT and 2.36 (IQR, 1.57–2.71) by PET (P < 0.001). The receiver-operator-characteristic curve revealed a cutoff for CZT MFRi at 1.26 to predict an abnormal PET MFR yielding an accuracy of 75%. Conclusion: The estimation of absolute MBF index values by CZT SPECT MPI with 99mTc-tetrofosmin is technically feasible, although hyperemic values are significantly lower than from PET with 13N-ammonia, resulting in a substantial underestimation of MFR. Nevertheless, CZT MFRi may confer diagnostic value.
- myocardial flow reserve (MFR)
- myocardial blood flow (MBF)
- cadmium zinc telluride (CZT) SPECT
- 13N-ammonia PET
The definition of coronary artery disease (CAD) was originally based on the presence of anatomic luminal narrowing greater than 50%. Over the past decades, however, many advances in imaging techniques have enhanced our pathophysiologic understanding of CAD. It has been recognized that many factors beyond luminal narrowing may determine whether or not an anatomic coronary lesion induces ischemia. Because this cannot be comprehensively addressed by coronary angiography alone, nuclear myocardial perfusion imaging (MPI) has been well established as a tool for providing proof of ischemia. This is mandatory for prognostically relevant target lesion revascularization in chronic stable CAD. Because revascularization of a non–flow-limiting coronary stenosis is not beneficial to the patient, neither from a prognostic nor from a symptomatic point of view, nuclear MPI has been suggested as a gatekeeper for invasive coronary angiography (1–3). MPI studies with PET have demonstrated that absolute myocardial blood flow (MBF) and flow reserve (MFR) provide incremental diagnostic (4) and prognostic (5) information over relative perfusion alone. Quantitative assessment of MBF is difficult with standard SPECT for which detectors need to rotate around the patient and for which unfavorable properties of the currently available flow tracers hamper accurate MBF quantification because of nonlinear extraction fraction with roll-off at higher flow values. The recent advances in SPECT technology including semiconductor detector material (cadmium zinc telluride [CZT]) allow acquisition in a nonrotating mode and therefore acquisition of time–activity curves. This may enable absolute MBF and MFR estimation by SPECT as recently shown in experimental animal models (6), which may pave the way for its implementation in clinical routine (7). More knowledge on the impact of the tracer properties on the values obtained from quantification is crucial.
The aim of the present study was a head-to-head comparison in humans of indices of absolute MBF and MFR as assessed with 99mTc-tetrofosmin on a CZT SPECT camera versus MBF and MFR measured with 13N-ammonia on a PET scanner.
MATERIALS AND METHODS
Patient Population
Thirty-two consecutive patients referred to nuclear MPI with either CZT SPECT or PET for clinical evaluation were enrolled. For study purposes, the patients underwent a second MPI with the respective other modality to obtain a pair of SPECT and PET myocardial perfusion images for each patient. In patients without any therapeutic intervention (i.e., no revascularization and no change in medication) a time interval of 2 wk was accepted. In patients with no therapeutic intervention and chronic stable conditions, a maximal time interval of 12 wk was accepted. The sequence was SPECT first in 25 and PET first in 7 patients. The local ethics committee approved this study, and all subjects signed a written informed consent form.
13N-Ammonia PET
The PET MPI scan was acquired during pharmacologic stress with an adenosine protocol at a standard rate (0.14 mg/kg/min) over 6 min and at rest according to clinical standards (4,8). For the stress acquisition, 13N-ammonia (1,053 ± 110 MBq) was injected 3 min into pharmacologic stress into a peripheral vein. Acquisition was repeated at rest (1,203 ± 148 MBq) 50 min after completion of the stress scan to allow for isotope decay. Images were acquired during 19 min in list-mode on a PET/CT scanner (Discovery ST/RX and Discovery VCT, both GE Healthcare). Images were reconstructed using a matrix of 128 × 128 and filtered backprojection into dynamic series encompassing the first 4 min (9 × 10, 6 × 15, and 3 × 20 s) for absolute MBF quantification and into a static series (15 remaining min) for assessment of relative perfusion abnormalities. A low-dose CT transmission scan was used for attenuation correction (9).
99mTc-Tetrofosmin CZT SPECT
The CZT MPI scan was acquired on a hybrid SPECT/CT scanner (DNM 570c; GE Healthcare) using the 1-d stress–rest protocol identical to the protocol described above. The SPECT part is a γ-camera with multipinhole collimation and 19 nonrotating pixelated CZT detector modules positioned around the patient's chest with full heart coverage (10). Due care was taken to ensure that patients were positioned in the middle of the field of view, and this was confirmed for each patient after the scan. A low-dose CT attenuation scan was acquired using the CT component of the same scanner (11). For the stress acquisition, 99mTc-tetrofosmin (330 ± 33 MBq) was injected 3 min into pharmacologic stress into a peripheral vein. Images were acquired in list-mode over 10 min starting immediately (a few seconds) before tracer injection. Five minutes after completion of the first scan, a second tracer injection with 3-fold-higher dose was administrated according to current guidelines, and the same acquisition protocol was applied (8). For logistic reasons, in 5 patients a rest–stress sequence was used for CZT scanning. Dynamic series including the first 4 min (6 × 10 and 6 × 30 s) were generated using a dedicated commercially available software package (Myovation for Alcyone; GE Healthcare) and reconstructed after attenuation correction using a maximum penalized likelihood iterative reconstruction (40 and 50 iterations applied for the stress and rest dataset, respectively) without scatter correction. A Butterworth postprocessing filter with cutoff frequency of 0.37 cycle/cm and order 7 was equally applied (10).
Absolute MBF Quantification
The MBF values for 13N-ammonia PET (PET MBF) as well as the MBF index (MBFi) values for 99mTc-tetrofosmin CZT SPECT (CZT MBFi) were estimated using the commercially available PMOD software package (version 3.1; PMOD Technologies Ltd.) developed and validated at our institution (12,13). Regions of interest in the right ventricle cavity, left ventricle cavity, and covering the left ventricular myocardium were automatically generated and minimally modified as necessary by an experienced interpreter to best match cardiac anatomy and avoid contamination from extracardiac activity. A 1-tissue-compartment model described by De Grado et al. was used for tracer kinetic modeling, inferring a myocardium tissue density of 1.04 g/mL (14,15). Global MBF values were determined after fitting the tissue activity curves of the myocardial as well as right ventricular and left ventricular values (16). No specific correction of the quantification process was performed despite the higher residual activity during the second half of the CZT study. Furthermore, no correction of the quantification model was applied despite differences in the extraction fraction and metabolites present for 99mTc-tetrofosmin compared with ammonia. Therefore, the MBF values obtained during the CZT study are rather indices of the flow (MBFi) at rest and stress, and their stress–rest ratio is the MFR index (MFRi). An image illustration during dynamic acquisition with CZT is displayed in Figure 1. For reasons of quality assurance, segments with CZT flow values greater than 4 mL/g/min or with more than 50% difference compared with adjacent segments were qualified as inconceivable values and were therefore discarded. This seemed appropriate to account for the tendency to greater contamination from extra cardiac activity and less favorable tracer distribution in addition to a lower spatial resolution of CZT than PET. Similarly, patients with global resting MBF PET values greater than 2 mL/min/g were excluded from further analysis because such values were classified as outliers (4 SDs above the reported mean values) according to a large body of evidence (10). Global MFR (PET) and MFRi (CZT) were calculated as the ratio of global MBF and MBFi at stress over rest values. Figure 2 depicts representative images of a patient’s 99mTc-tetrofosmin CZT SPECT and 13N-ammonia PET studies at stress and rest.
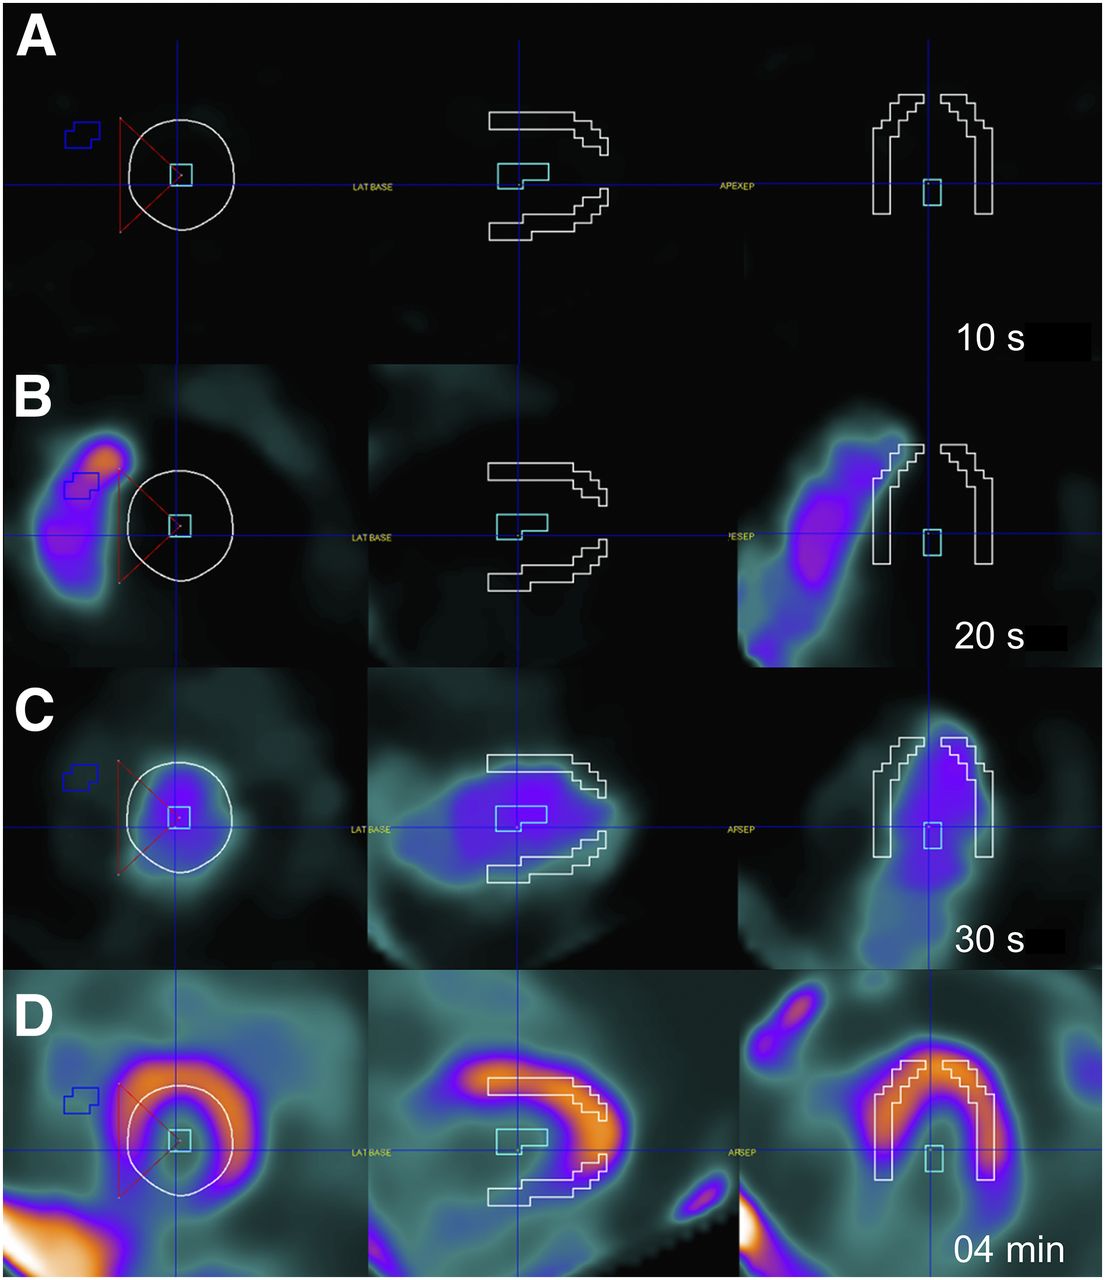
Dynamic CZT SPECT imaging during adenosine stress. (A) Short-axis (left) and vertical (middle) and horizontal long-axis (right) frames with regions of interest (ROIs) drawn in right and left ventricle and left ventricular myocardium. Dynamic acquisition sequentially illustrates right ventricular inflow (B), left ventricular inflow (C), and myocardial perfusion (D). White ROI = myocardium; light blue ROI = left ventricular cavity; dark blue ROI = right ventricular cavity; red triangle = delineation of upper and lower interventricular junction and middle of left ventricular cavity.

Static 99mTc-tetrofosmin CZT SPECT (A) and 13N-ammonia PET (B) images acquired during stress (top) and at rest (bottom). Images were obtained from same patient as in Figure 1.
Statistical Analysis
The continuous values were summarized as mean ± SD and parametric values as percentage or median and interquartile range as appropriate. The Shapiro–Wilk test was used to test for normal distribution. Results from both MPI methods were compared using the Wilcoxon signed-rank test, and the Spearman correlation coefficient was calculated. A receiver-operator-characteristic analysis was conducted to evaluate the diagnostic accuracy of CZT in the detection of patients with MFR less than 2 by PET. All P values of less than 0.05 were considered statistically significant. SPSS 22.0 (SPSS) was used for the statistical analysis.
RESULTS
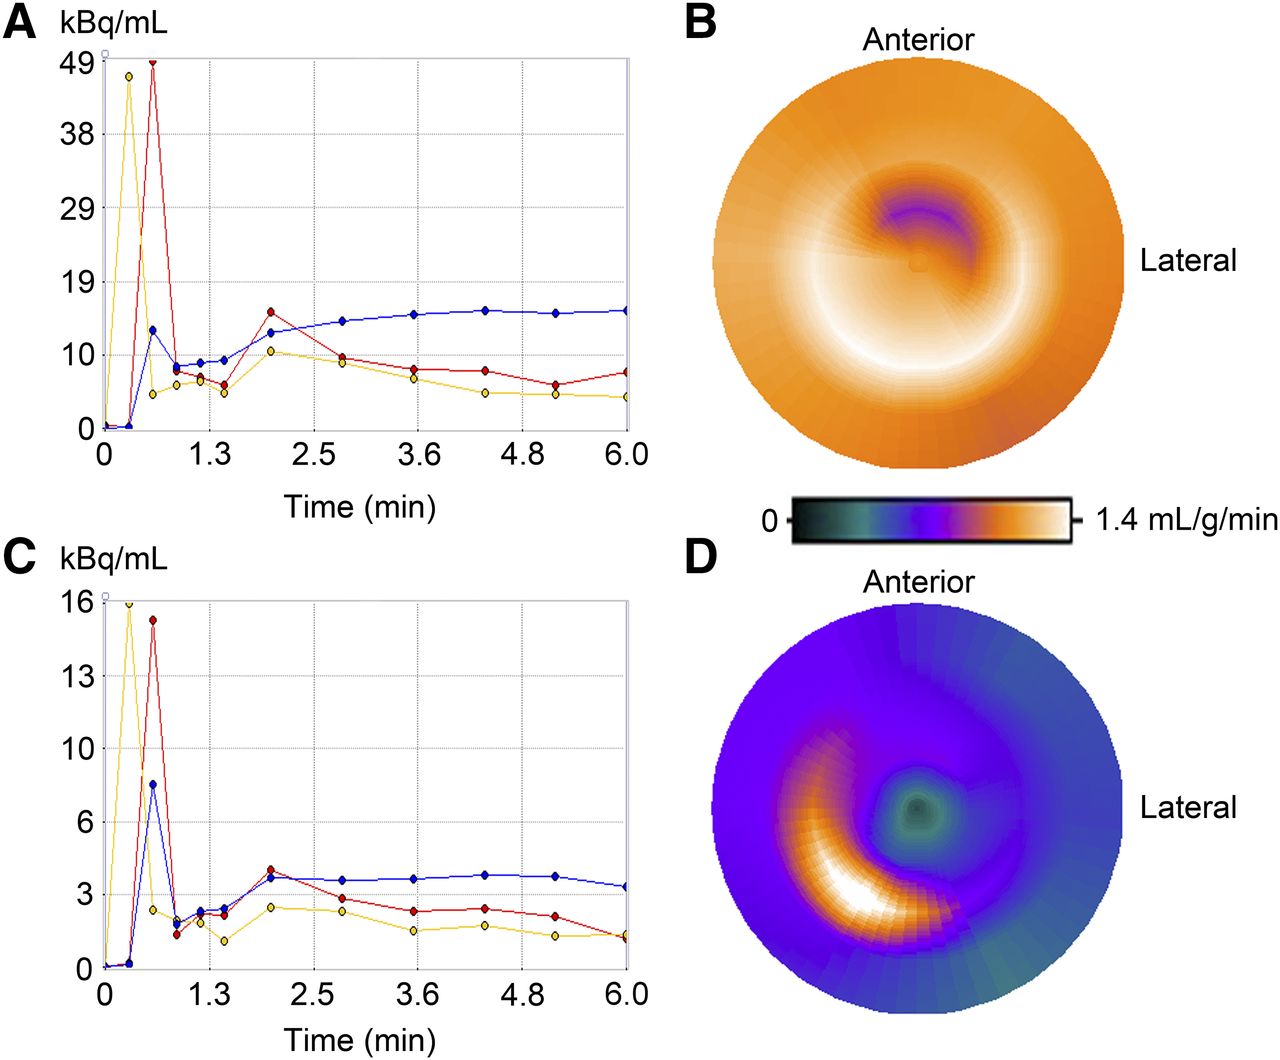
Four patients were excluded from further analysis according to predefined quality criteria for quantitative PET. The final study population consisted of 28 patients (86% men) with a mean age of 64 ± 10 y and a body mass index of 28 ± 6 kg/m2 (Table 1). Kinetic modeling curves and polar maps at rest and stress for a representative patient are displayed using PET (Fig. 3) and CZT (Fig. 4).
Patient Baseline Characteristics (n = 28)
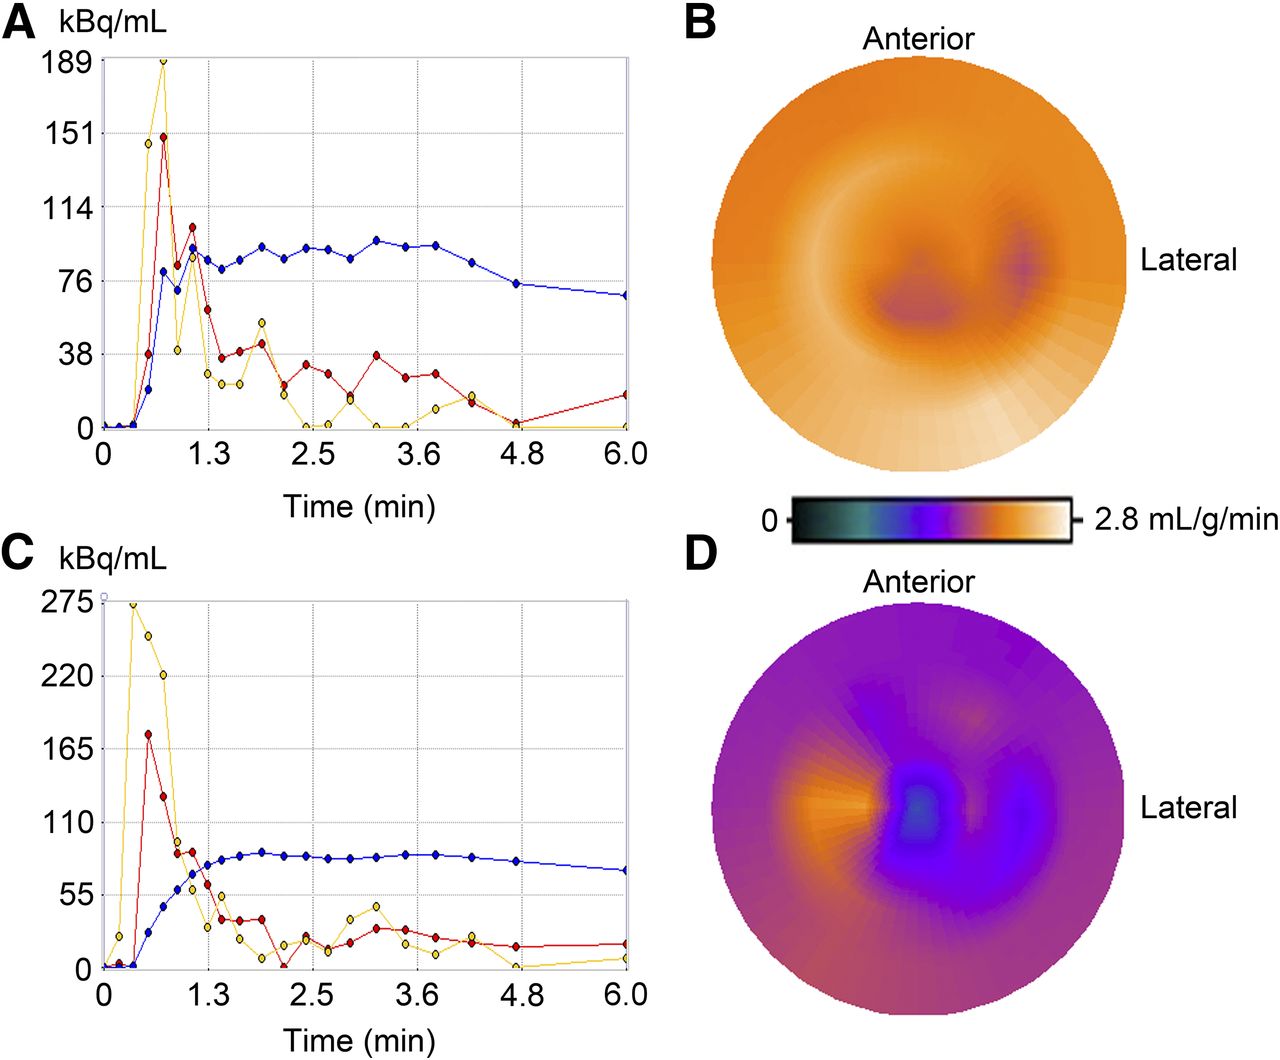
Fit curves and polar map of a representative patient when using PET: fit curves (A) and polar map (B) at stress and fit curves (C) and polar map (D) at rest. Yellow curves = right ventricle; red curves = left ventricle; blue curves = myocardium.

Fit curves and polar map of same patient as in Figure 3 when using CZT: fit curves (A) and polar map (B) at stress and fit curves (C) and polar map (D) at rest. Yellow curves = right ventricle; red curves = left ventricle; blue curves = myocardium.
A total of 952 segments (476 stress and 476 rest) were analyzed in the 28 patients by CZT and PET. According to prespecified quality criteria for CZT measurements, a total of 79 segments (8%) had to be excluded (28 stress and 51 rest scans). At rest, median MBFi with CZT was similar to MBF with PET (0.89 [interquartile range (IQR), 0.77–1.00] vs. 0.92 [IQR, 0.78–1.06] mL/g/min; P = not significant) whereas CZT MBFi was significantly lower at stress than PET MBF (1.11 [IQR, 1.00–1.26] vs. 2.06 [IQR, 1.48–2.56] mL/g/min; P < 0.001). This resulted in median MFRi values of 1.32 (IQR, 1.13–1.52) by CZT, which was significantly lower than the MFR value of 2.36 (IQR, 1.57–2.71) by PET (P < 0.001).
Overall the correlation between CZT MBFi and PET MBF values was ρ = 0.62 (P < 0.001), whereas the correlations for MBFi and MBF at rest and stress were ρ = 0.51 (P < 0.05) and 0.30 (P = not significant) (Fig. 5).
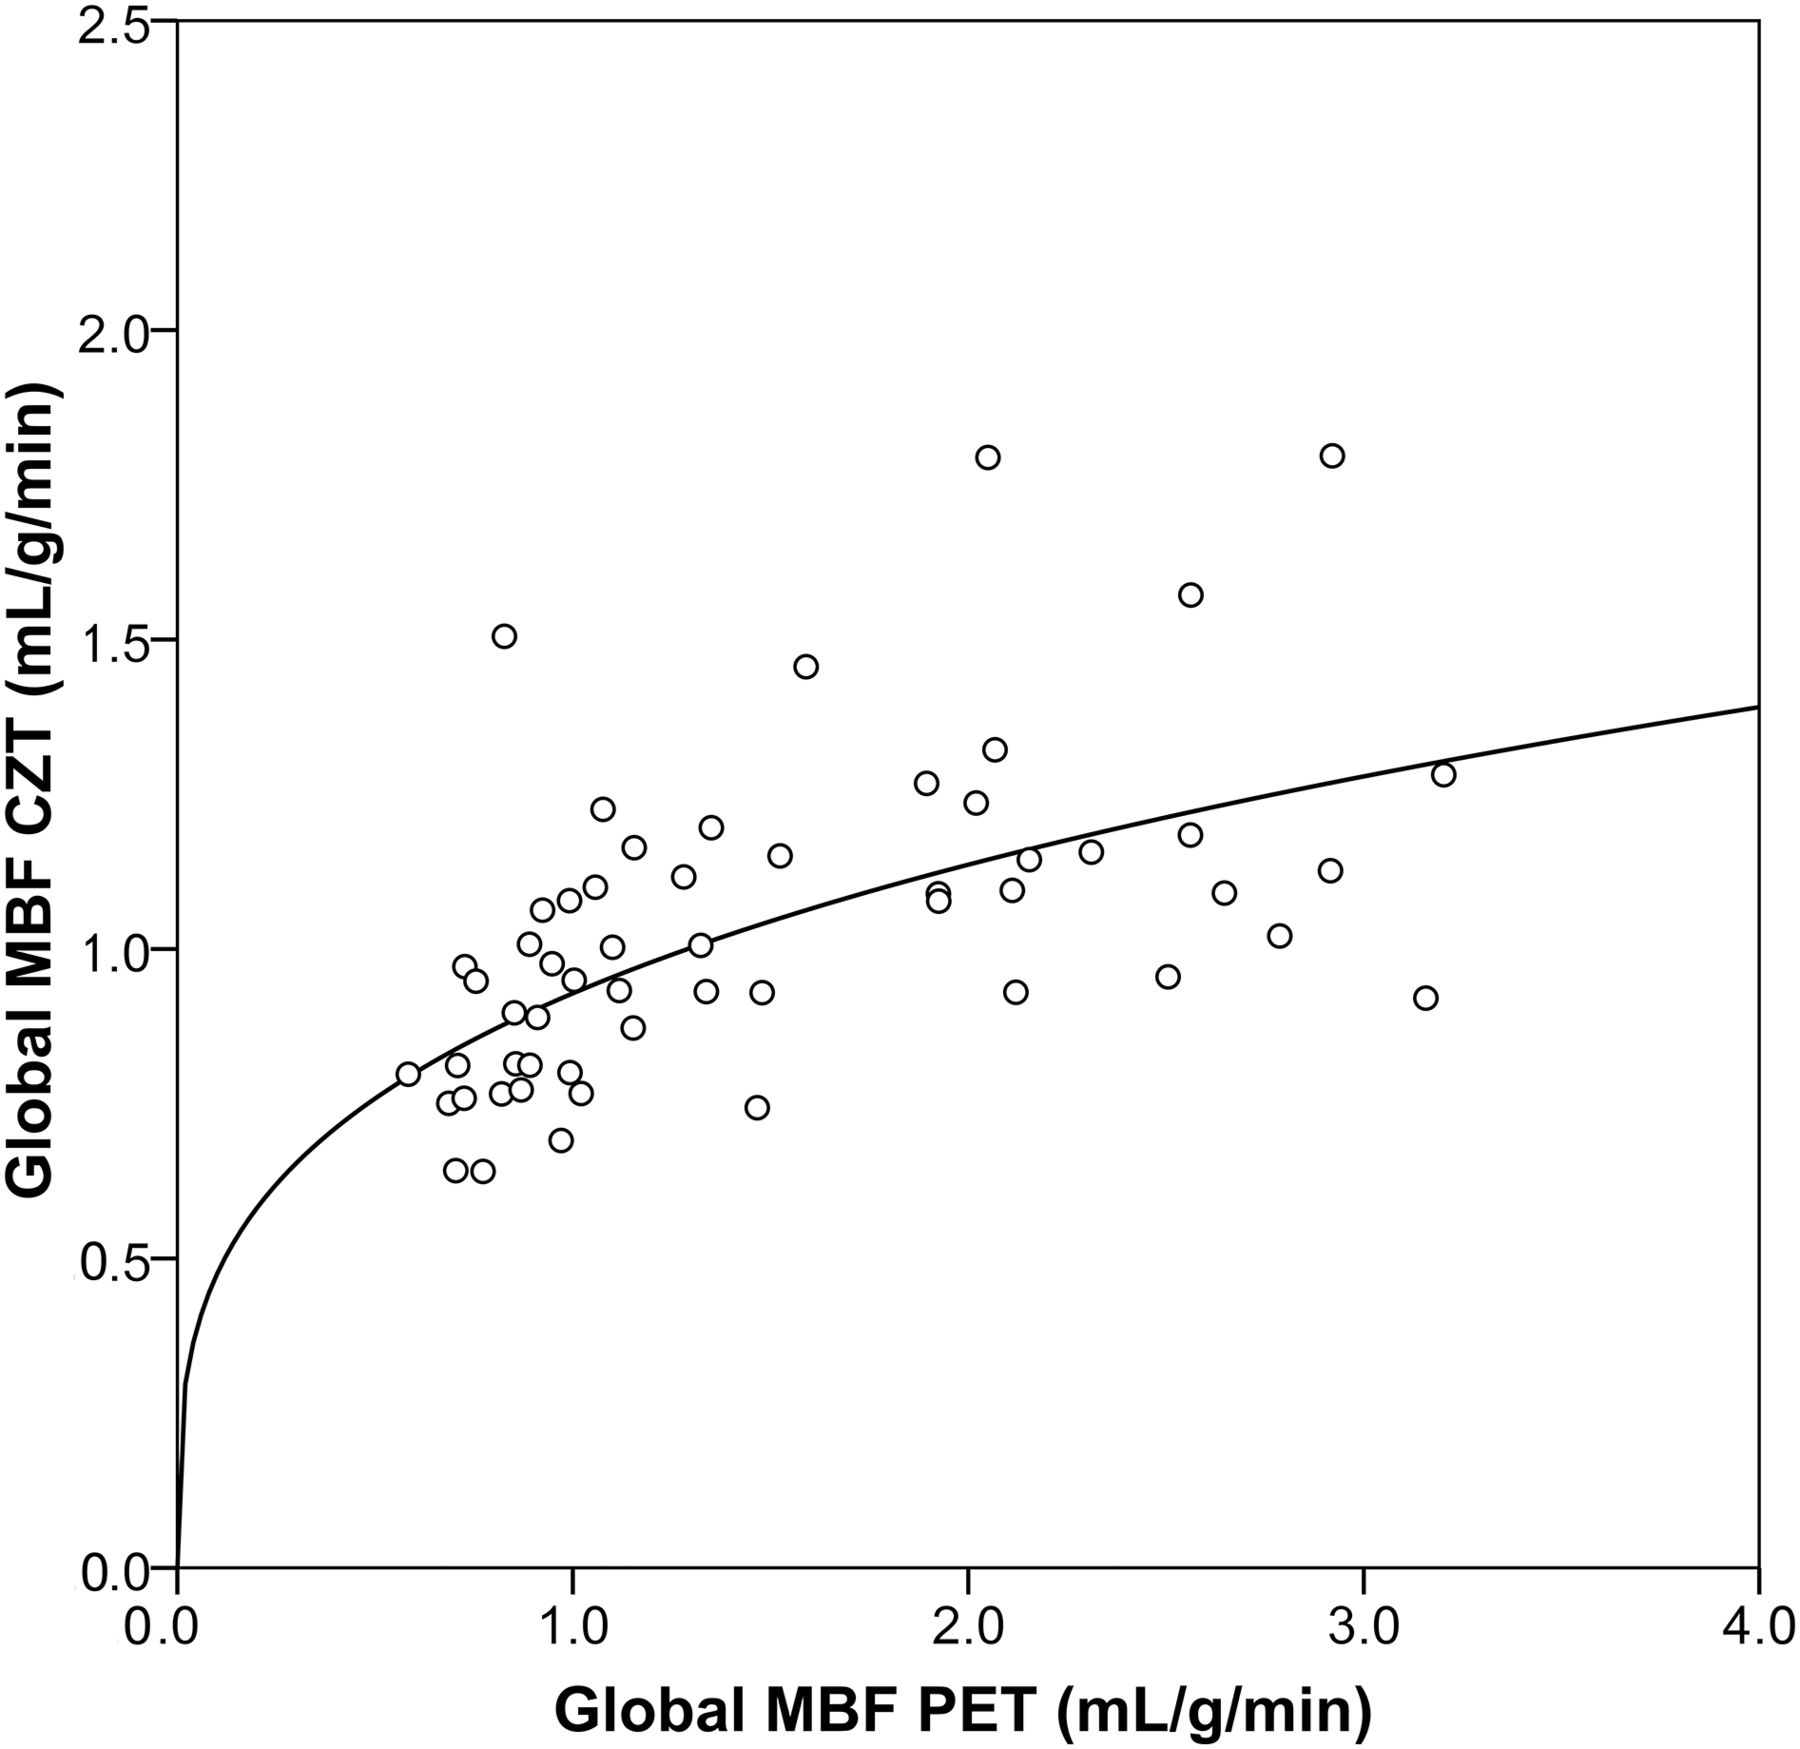
Head-to-head comparison of MBF values obtained from CZT SPECT versus PET, which served as standard of reference. Flattening of curve at values above 1 mL/g/min indicates underestimation by CZT SPECT particularly under high flow conditions.
The receiver-operator-characteristic curve revealed a cutoff for CZT MFRi at 1.26 to predict an abnormal PET MFR. When the latter cutoff value was used, CZT correctly identified 14 of 18 patients (specificity, 78%), with a PET MFR of 2 or greater, and 7 of 10 (sensitivity, 70%), with a PET MFR of less than 2, yielding an accuracy of 75% (Fig. 6). The MBF values at rest and stress in patients with correctly identified and misidentified PET MFR when using CZT is displayed in Table 2.
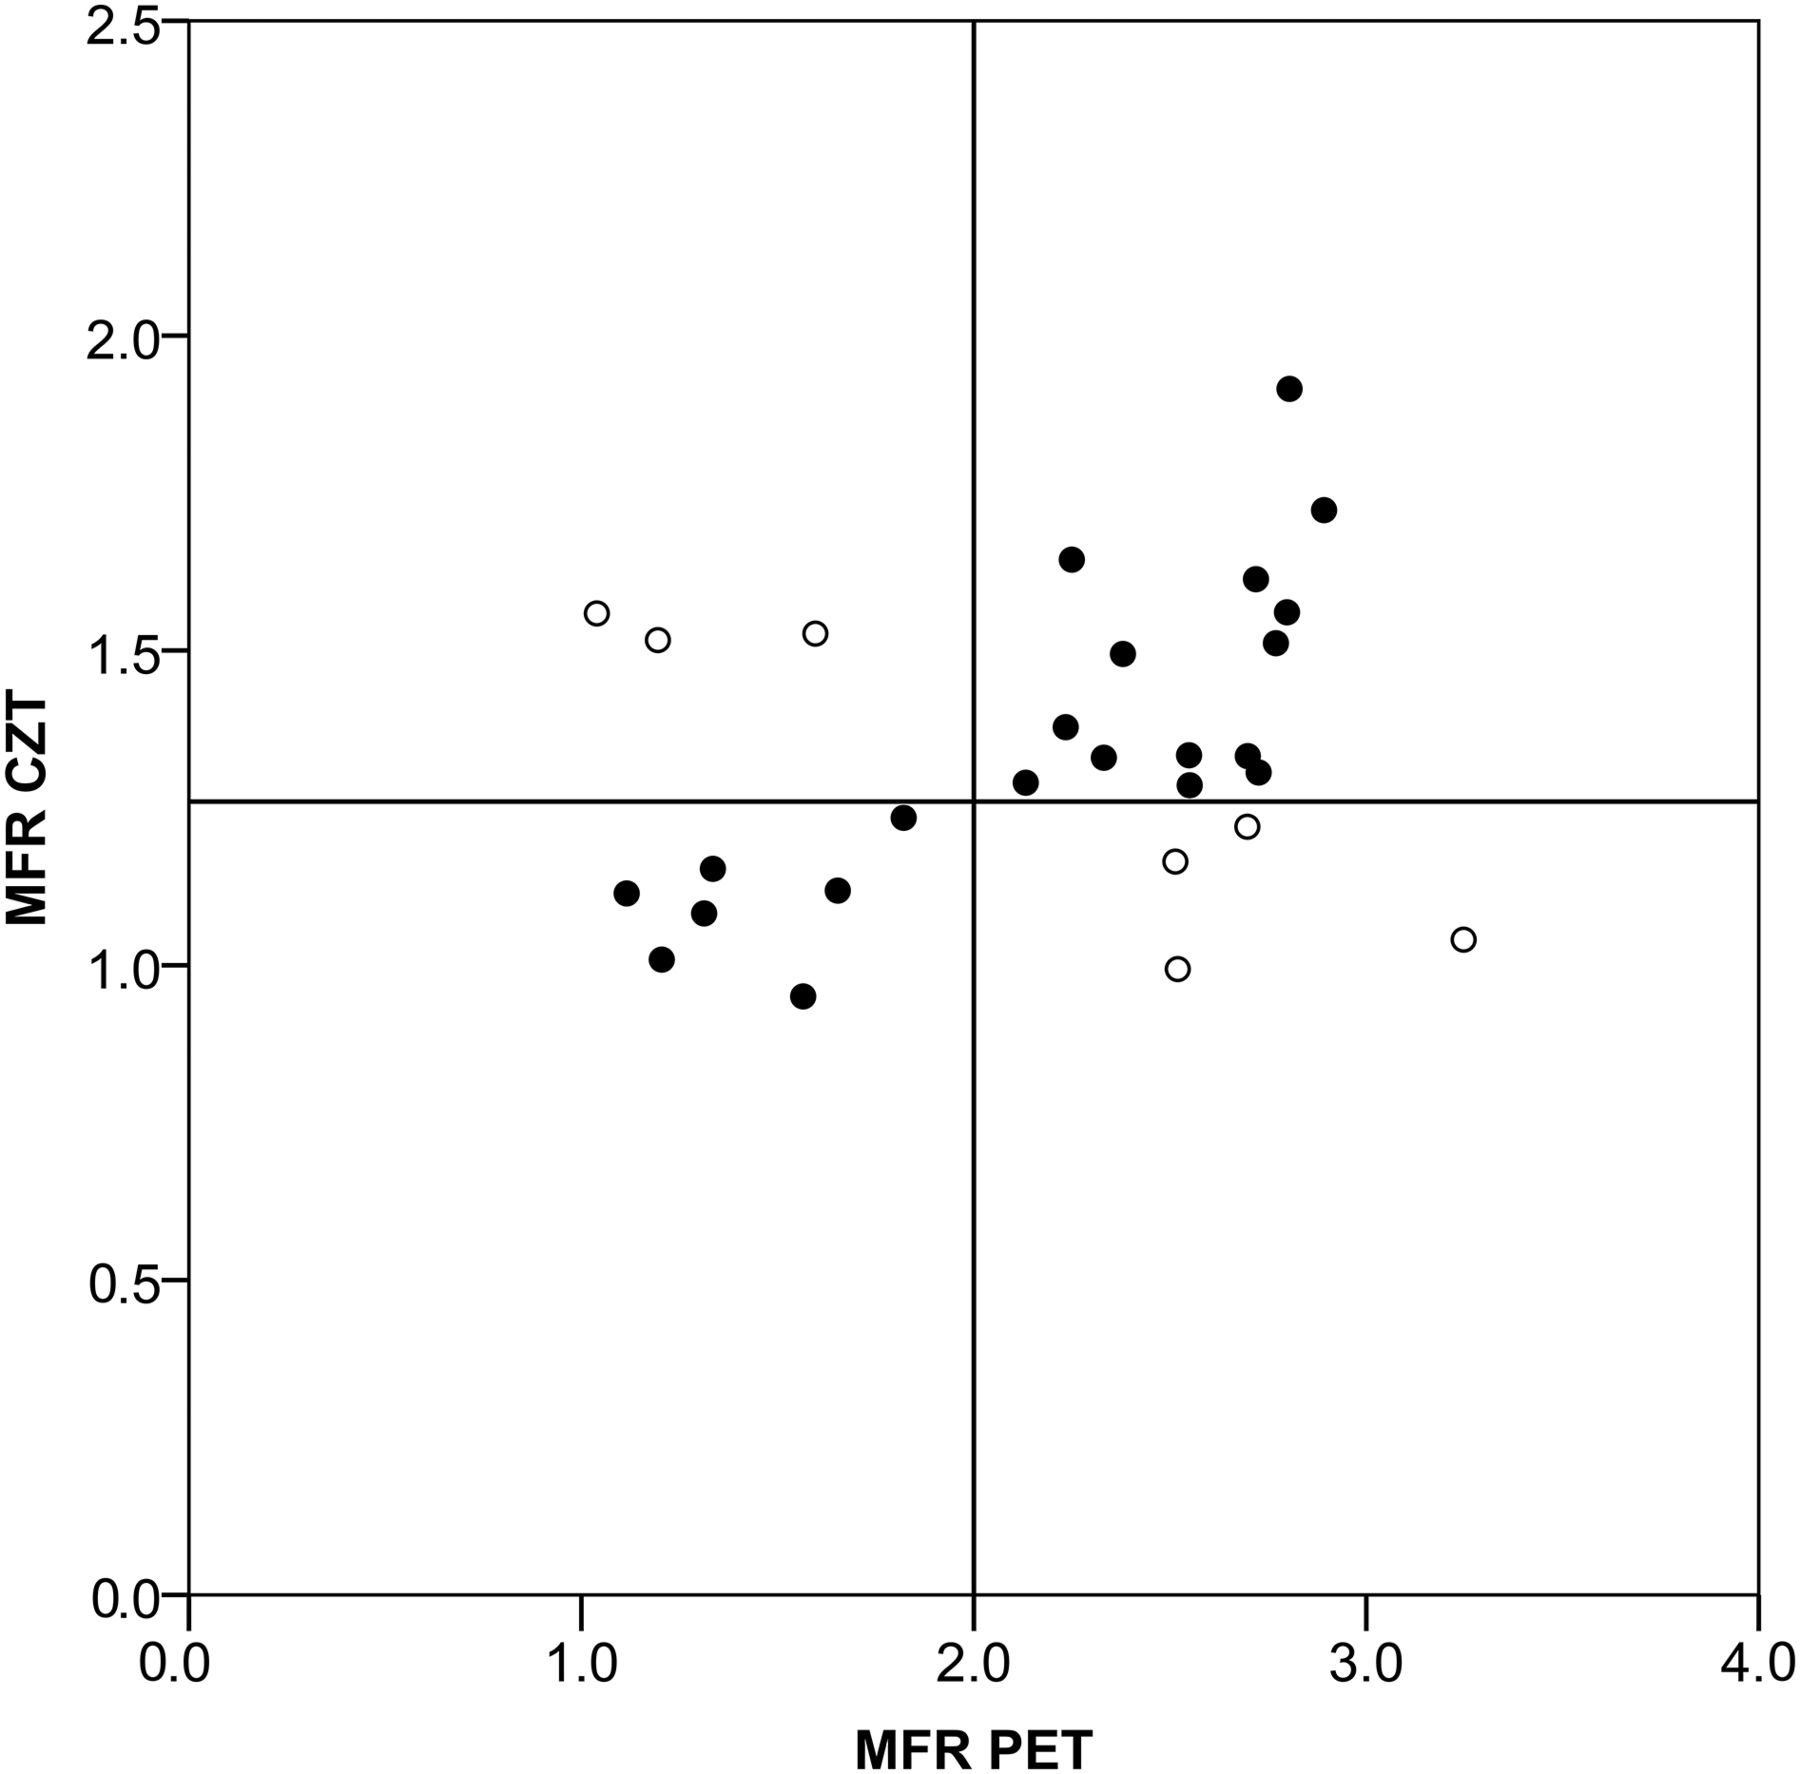
When cutoff value of 1.26 (as identified by receiver-operator-characteristic curve) was used for MFRi, CZT correctly identified (black circles) 14 of 18 patients (specificity, 78%) with PET MFR of 2 or greater and 7 of 10 patients (sensitivity, 70%) with PET MFR less than 2, resulting in accuracy of 75% for CZT MFRi.
MBF Values at Rest and Stress in Patients with Correctly Identified and Misidentified PET MFRi When Using SPECT CZT
DISCUSSION
Our study is the first to compare in humans MBF data from dynamic CZT acquisition with data from PET, which is considered the gold standard for quantitative noninvasive MBF assessment (17). Our results demonstrate that quantification of dynamic SPECT MPI on modern CZT cameras is technically feasible but without specific correction for the different extraction fraction and metabolism of 99mTc-tetrofosmin underestimates MBF values at high flow conditions. Although resting MBFi values from CZT did not differ significantly from PET MBF values, hyperemic MBF values were significantly underestimated by CZT MBFi, resulting in underestimation of MFRi values obtained from CZT MBFi quantification. The key finding is that, nevertheless, values of CZT MFRi revealed an accuracy of 75% to assess an abnormal MFR documented by PET.
Previous studies exploring quantification of MBF with dynamic planar scintigraphy in humans (18–25) and with dynamic SPECT in experimental animals (26–28) have documented the limitations of conventional γ-cameras for the dynamic acquisition of datasets required for MBF quantification. The introduction of CZT cameras without the need of detector rotation has allowed proving the concept of dynamic image acquisition for MBF quantification in a recent animal study using microspheres as a standard of reference (6). A recent study has confirmed the feasibility and reproducibility of kinetic analysis of myocardial tracer uptake with a CZT device (29), although no standard of reference for perfusion quantification was available.
Our CZT MFRi values are in line with the values reported by Ben-Haim et al. (29) and are substantially lower than the MFR values estimated by PET. This was mainly driven by the lower MBF values observed by SPECT at high flow conditions, whereas resting MBF values were highly comparable with PET. This is explained at least in part by the well-known properties of 99mTc-tetrofosmin, namely inferior extraction at high flow rates compared with 13N-ammonia. The superiority of 13N-ammonia over 99mTc-tetrofosmin is not only evidenced by a higher extraction fraction at resting conditions (80% vs. 53%) but also based on the fact that the given extraction fraction remains constant over a much larger range of MBF. This explains why the model for correction of 13N-ammonia MBF values may not provide a satisfying fit for 99mTc-tetrofosmin. Our results are in perfect agreement with the notion (6) that contrast between stress and resting flow will be lower for 99mTc tracers (23,29) than typically seen with PET (17).
However, in daily clinical practice qualitative SPECT MPI is a well-established tool for diagnostic and prognostic CAD estimation (30), indicating that despite the limited contrast of stress versus rest this technique provides powerful discrimination of health and disease in CAD. Given the growing body of evidence underlining the importance of absolute MBF and MFR quantification, our findings may have important clinical implications to further emphasize the role of SPECT MPI. In fact, although the MFR values were significantly lower by CZT than those assessed by PET due to the flattening of the curve at hyperemia, the CZT MFRi nevertheless confers a strong discriminatory power (accuracy of 75%) of normal versus abnormal myocardial perfusion. Despite the limited size of the study, the strength of these results lies in the fact that patients served as their own internal control and the cutoff for abnormal perfusion detection was a PET MFR of less than 2, which is a robust and widely accepted threshold both for diagnostic (4) and prognostic CAD assessment (5,31). 99mTc-tetrofosmin was used in this study because it constitutes the most commonly used radiotracer for SPECT MPI in daily clinical routine. However, 99mTc tracers with more favorable tracer kinetics such as found for teboroxime (32) may help in improving the role of MFR by CZT.
It may be perceived as a potential limitation of the present study that no invasive coronary angiography was performed. However, the aim of the study was the evaluation of quantitative MBF and MFR assessed by CZT SPECT, and therefore quantitative PET perfusion seemed the most appropriate standard of reference while an anatomic definition of CAD could only provide dichotomous information on presence and absence of disease. Furthermore, an anatomic reference would represent a flawed gold standard for quantitative MBF measurements and would require assessment of invasive fractional flow reserve, which is not feasible for ethical reasons because of its invasive nature in patients with normal findings. Furthermore, we have confined our study to global rather than regional values, which may potentially constitute a limitation. However, global MFR reflects CAD beyond the epicardial section of the coronary tree involving microcirculation, including endothelial dysfunction, which has been shown to increase the sensitivity in detecting CAD when global MFR is used as an adjunct to PET MPI. The use of global MFR appears to be most appropriate when the aspect of microcirculatory dysfunction is included, which is often associated with CAD. Furthermore, for reasons of feasibility implementation of global MFR seems preferable over regional MFR because the reproducibility and the repeatability of global MFR are considerably superior to those of regional MFR from PET (13,33). This may apply even more for SPECT measurements because of technical issues and count statistics including lower spatial resolution, which may affect the apparent perfusion values in a nonhomogeneous manner, leading to different patterns in the polar plots for PET and SPECT as depicted in Figures 3 and 4. Differences are also based on biologic variability, because a profound spatial heterogeneity has been observed in regional MBF at rest and in response to vasodilator stress (34,35). The anatomic variability of the coronary trees is another source that has been shown to affect the per-segment performance of quantitative MBF measurements. Finally, our study has been performed using an integrated SPECT/CT but without scatter correction, and therefore extrapolation to protocols with separate acquisition on standalone CT and CZT SPECT scanners and to protocols using scatter correction should be done with caution.
CONCLUSION
Estimation of absolute MBFi values by CZT SPECT MPI with 99mTc-tetrofosmin is technically feasible, although hyperemic values are significantly lower than from PET with 13N-ammonia, resulting in a substantial underestimation of MFR. Nevertheless, CZT MFRi may confer diagnostic value.
DISCLOSURE
The costs of publication of this article were defrayed in part by the payment of page charges. Therefore, and solely to indicate this fact, this article is hereby marked “advertisement” in accordance with 18 USC section 1734. The University Hospital Zurich had a research contract with GE Healthcare. No other potential conflict of interest relevant to this article was reported.
Acknowledgments
We thank our radiographers Ennio Muller and Edlira Loga for their excellent technical support.
Footnotes
- © 2016 by the Society of Nuclear Medicine and Molecular Imaging, Inc.
REFERENCES
- Received for publication August 12, 2015.
- Accepted for publication May 31, 2016.


Jump to section
Related Articles
Cited By...
- Precision of Myocardial Blood Flow and Flow Reserve Measurement During CZT SPECT Perfusion Imaging Processing: Intra- and Interobserver Variability
- Solid-State Detector SPECT Myocardial Perfusion Imaging
- Optimization of SPECT Measurement of Myocardial Blood Flow with Corrections for Attenuation, Motion, and Blood Binding Compared with PET
- Quantitative Assessment of Coronary Microvascular Function: Dynamic Single-Photon Emission Computed Tomography, Positron Emission Tomography, Ultrasound, Computed Tomography, and Magnetic Resonance Imaging