


Abstract
Photoacoustic imaging is a nonionizing biomedical imaging modality with higher resolution and imaging depth than fluorescence imaging, which has greater sensitivity. The combination of the 2 imaging modalities could improve the detection of cancer. Integrin αvβ6 is a cell surface marker overexpressed in many different cancers. Here, we report the development and evaluation of a dye-labeled cystine knot peptide, which selectively recognizes integrin αvβ6 with high affinity, for photoacoustic and fluorescence imaging. The new dual-modality probe may find clinical application in cancer diagnosis and intraoperative imaging of integrin αvβ6–positive tumors. Methods: An engineered cystine knot peptide, R01, that recognizes integrin αvβ6 was labeled with Atto 740 (A740) and evaluated for its specific cell uptake and its sensitivity threshold. A740-R01 was injected via the tail vein into nude mice xenografted with A431 (integrin αvβ6–positive) or 293T (integrin αvβ6–negative) tumors. Photoacoustic and fluorescence scans of tumors were acquired before and at 0.5, 1, 2, and 4 h after injection of A740-R01. Dynamic photoacoustic scans of various normal organs were also acquired. Ex vivo fluorescence imaging of tissues was performed 1 h after injection. Results: The A740-R01 demonstrated integrin αvβ6–dependent binding to A431 cells in culture. Sensitivity studies indicated that the probe may potentially detect lesions as small as 1 or 6 mm3 by fluorescence or photoacoustic imaging, respectively. The photoacoustic and fluorescence signals of A431 xenografts at 1 h after injection were 1.87 ± 0.25 arbitrary units (AU) and 8.27 ± 0.87 AU, respectively. Target specificity was confirmed by low tumor uptake in 293T tumors at 1 h after injection (1.07 ± 0.15 AU and 1.10 ± 0.14 AU for photoacoustic and fluorescence signals, respectively). A740-R01 exhibited hepatobiliary clearance marked by high uptake in the liver, spleen, and intestine but low uptake in the kidneys. Conclusion: A740-R01 specifically targeted integrin αvβ6 with low nanomolar affinity. A740-R01 was able to detect integrin αvβ6 both in vitro and in vivo by photoacoustic and fluorescence imaging. A740-R01 is able to detect αvβ6-positive tumors in living subjects and may have clinical application in cancer diagnosis and real-time image-guided surgery.
Photoacoustic imaging is a noninvasive and nonionizing biomedical imaging modality with high optical contrast and scalable ultrasound resolution and imaging depth (1). On the basis of the photoacoustic effect, photoacoustic imaging detects thermoelastically induced ultrasonic waves formed as a result of light absorption by molecules (2). Various endogenous and exogenous absorbers can serve as photoacoustic contrast agents (3). Primary endogenous absorbers such as hemoglobin (4), melanin (5), DNA/RNA (6), and lipids (7) may provide functional and anatomic information. Exogenous contrast agents including organic dyes (8), nanoparticles (1,9), and reporter genes (5) can greatly enhance photoacoustic signals and extend the applications of photoacoustic imaging to molecular imaging.
The advantages of using small-molecule fluorescent dyes (<2 nm) for in vivo imaging are their biocompatibility and rapid but complete clearance from the body (10,11). Fluorescent dyes may also be used in photoacoustic imaging applications. Fluorescence imaging depends on the photons emitted from the tracer, whereas photoacoustic imaging depends on photon energy absorbed but released instead as heat. Therefore, some of the physical properties that determine whether a fluorescent dye may be used in this dual application as photoacoustic agents are a high extinction coefficient but low fluorescence quantum yield (12). In this study, we selected a relatively photostable fluorescent dye, Atto 740 (A740), to serve as a multimodal fluorescence and photoacoustic contrast agent. A740 emits in the near-infrared region for optimal in vivo fluorescence imaging. A previous study (13) had shown A740 to also provide photoacoustic contrast.
Integrin αvβ6 is a transmembrane cell surface marker overexpressed in pancreatic (14), lung (15), gastric (16), ovarian (17), endometrial (18), colorectal (19), oral (20), and skin (21) cancer as well as in cholangiocarcinoma (22). Importantly, integrin αvβ6 is not expressed on most normal adult tissues (23). Thus, a molecular probe that recognizes integrin αvβ6 may be used to diagnose or treat these cancers. In a previous study, we engineered cystine knot peptides to bind integrin αvβ6 with equilibrium dissociation constants (KD) of 3–6 nM (24). The peptides were labeled with 64Cu-DOTA (24) and 18F-fluorobenzoyl (25) for PET imaging. They exhibited higher accumulations in integrin αvβ6–positive xenografts (∼5 and 2 percentage injected dose per gram [%ID/g], respectively) than in integrin αvβ6–negative controls (∼1.3 %ID/g). Similar results (∼2 %ID/g for integrin αvβ6–positive xenografts) were observed in 99mTc-based (26) SPECT imaging.
In contrast to PET and SPECT imaging, photoacoustic and fluorescence imaging are radiation free and have higher spatial resolution (27,28). However, appropriately labeled cystine knot probes for hybrid photoacoustic–fluorescence imaging of integrin αvβ6 have not yet been reported. Here, we report the design and evaluation of a probe targeting integrin αvβ6–positive tumors for dual photoacoustic and fluorescence imaging.
MATERIALS AND METHODS
Synthesis of A740-R01
A cystine knot peptide, R01, that binds integrin αvβ6 (KD = 3.6 nM) was chemically synthesized, folded, and purified as previously described (24). The N terminus amine of R01 was used for site-specific attachment of A740. For labeling, both R01 and A740 N-hydroxysuccinimide ester (ATTO-Tec) were dissolved in anhydrous dimethylformamide (Sigma Aldrich) to afford 10 mg/mL solutions. The 2 were mixed in a 1:5 molar ratio. An equal volume of 200 mM, pH 8.3, sodium bicarbonate was added to the mixture, which reacted for up to 1 h at room temperature. A740-R01 was purified by reversed-phase high-performance liquid chromatography (Higgins Analytic). The mobile phase was 0.1% trifluoroacetic acid (Thermo Fisher Scientific) in water (solution A) and 0.1% trifluoroacetic acid in 90% acetonitrile (Thermo Fisher Scientific) in water (solution B). Purified A740-R01 was characterized by matrix-assisted laser desorption/ionization time-of-flight mass spectrometry on an AB Sciex 5800 TOF/TOF System. Lyophilized A740-R01 was resuspended in dimethyl sulfoxide (Thermo Fisher Scientific) and diluted with Dulbecco phosphate-buffered saline (DPBS) to a final concentration of 6 × 10⁻⁵ M. The maximum absorption wavelength of A740-R01 was determined by UV-Vis spectrophotometry on a Nanodrop 2000 (Thermo Fisher Scientific).
Photobleaching Study
Fifty microliters of A740-R01 (1 × 10⁻⁵ M) were analyzed with the Nexus 128 photoacoustic instrument (Endra) and scanned with laser light using the maximum absorption wavelength (750 nm) for 30 min. Photobleaching was determined by the change in photoacoustic intensity over time.
Cell Uptake Study
The human epidermoid carcinoma cell line A431 (integrin αvβ6–positive) and the human embryonic kidney 239T (integrin αvβ6–negative) (24) were obtained from frozen lab stocks and grown in Dulbecco modified Eagle medium supplemented with 10% fetal bovine serum and penicillin–streptomycin (Invitrogen). Cells were plated at 1 × 10⁴ cells/cm2 in the Petri dishes (100 mm; Corning) and grown to approximately 85% confluence. A740-R01 was added at concentrations of 0.2, 0.5, or 1 μM and incubated at 37°C for 0.5, 1, or 4 h. After cells were washed with DPBS 3 times, fluorescence microscopic images were collected on an Axiovert 200 M microscope (Zeiss). A740-R01 was excited with a 740 nm laser, and its emission was detected by a photomultiplier using a 760-nm band-pass filter. The cells were detached with trypsin (Invitrogen) and centrifuged. The harvested cell pellets were resuspended in 100 μL of DPBS and counted by hemocytometry. One million cells were pipetted into Eppendorf tubes for photoacoustic and fluorescence imaging. The cellular uptake of A740-R01 was quantified by measuring the photoacoustic and fluorescence intensity of each sample with the Nexus 128 system and the IVIS200 system (Caliper Life Sciences), respectively. A 3-dimensional (3D) region of interest was drawn over the tube for quantitative analysis of the photoacoustic signal using the software (amide.sourceforge.net) (29).
For the blocking study, a 10-fold molar excess of unlabeled R01 was added to final concentration of 5 μM, 10 min before addition of A740-R01.
Sensitivity Study
A431 cells were plated at 1 × 10⁴ cells/cm2 in the Petri dishes (100 mm) and grown to approximately 85% confluence. The cells were incubated with 0.5 μM A740-R01 for 1 h at 37°C. The cells were washed 3 times with DPBS to remove unbound A740-R01. Cells were detached with trypsin (Invitrogen) and centrifuged. The harvested cell pellets were resuspended in 100 μL of DPBS and counted by hemocytometry. The cells were serially diluted to 1.2, 0.6, 0.3, and 0.1 million in DPBS for photoacoustic and fluorescence imaging.
Small-Animal Imaging and Tissue Biodistribution
All animal experiments were performed in accordance with the regulations for the care and use of research animals approved by the Stanford University Institutional Animal Care and Use Committee. Eight-week-old female nude mice (Charles River) were injected with 2 million A431 or 5 million 293T cells (in 100 μL of DPBS) in the front leg flank. Mice (n = 3 for A431, n = 3 for 293T) bearing 0.5- to 1.0-cm xenografted tumor mass were scanned using a Nexus 128 photoacoustic imaging system. A 750-nm laser light with 240 views and 1 pulse per view was used for scanning. Data were obtained before and 0.5, 1, 2, and 4 h after administration of 200 μL of A740-R01 (6 × 10⁻⁵ M) via tail vein injection. Maximum-intensity-projection 3D photoacoustic images were reconstructed and analyzed using Osirix software (Apple). Xenograft tumors were arranged in the dimple of the animal tray to minimize any breathing and other motion artifacts. The blood vessels of the tumor on the 3D reconstructed images were selected for spatial coregistration. Mice were placed on the animal tray of the photoacoustic instrument either supine or prone for scanning of the liver, intestine, and kidneys. The mice were imaged using an optical and x-ray small-animal imaging system (Bruker) for fluorescence imaging.
Ex Vivo Studies
Mice were sacrificed 1 h after injection of 200 μL of A740-R01 (6 × 10⁻⁵ M) (n = 3). Optical imaging of excised organs was performed with the IVIS200. Quantitative analysis was performed using Living Image 4.0 software.
Statistical Analysis
Analyses were performed in SPSS 13.0 (Lead Technologies). All data were presented as the mean ± SD. Means were compared using independent-samples t test. A P value of less than 0.05 was considered statistically significant.
RESULTS
Synthesis of A740-R01
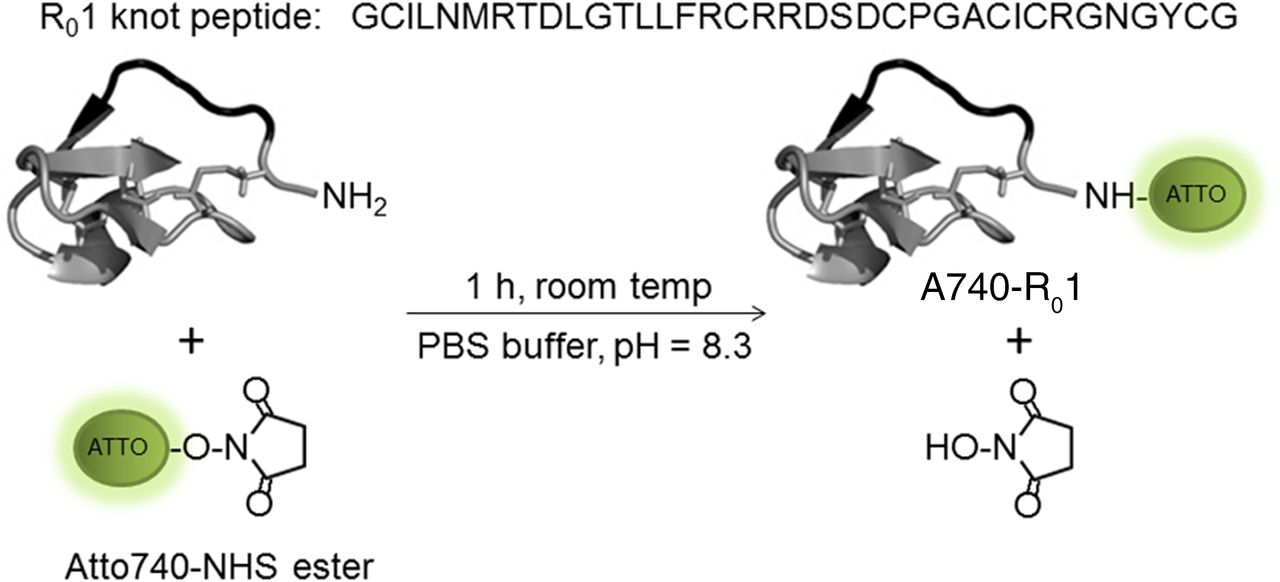
Atto 740 N-hydroxysuccinimide ester was used to label the cystine knot peptide R01 (Fig. 1). A740-R01 was separated from the reaction mixture by reversed-phase high-performance liquid chromatography, with a retention time of 21.5 min (Supplemental Fig. 1; supplemental materials are available at http://jnm.snmjournals.org) and verified by matrix-assisted laser desorption/ionization time-of-flight mass spectrometry with m/z of 4357 (Supplemental Fig. 2). The maximum absorption wavelength of A740-R01 agent was 750 nm (Supplemental Fig. 3). The half maximal inhibitory concentration of R01 and A740-R01 was 5.9 ± 1.1 and 39.4 ± 6.5 nM, respectively (Supplemental Fig. 4).

R01 contains a single primary amine located at its N terminus. This amine was used to couple A740-NHS at pH 8.3 in 200 mM sodium bicarbonate at room temperature for 1 h. A740-R01 was purified by reversed-phase high-performance liquid chromatography. NHS = N-hydroxysuccinimide.
Photobleaching Study
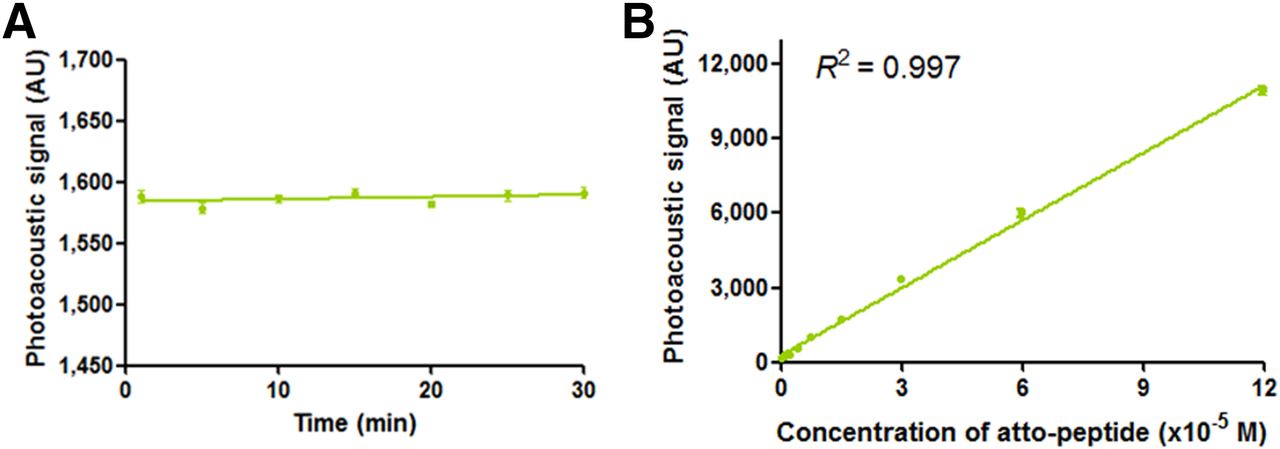
A740-R01 demonstrated high stability without significant decrease of photoacoustic signal after irradiation with 750-nm laser light for 30 min. Photoacoustic signals increased linearly with an increase in A740-R01 concentrations (R2 = 0.997) (Fig. 2).

Photobleaching study. (A) Photoacoustic signal of A740-R01 was stable on exposure to 750-nm laser light for 30 min. (B) Photoacoustic signal was linearly dependent on concentration of A740-R01 (R2 = 0.997).
Cell Uptake Study
The binding of A740-R01 was assayed in integrin αvβ6–positive A431 and integrin αvβ6–negative 293T cells. Cell uptake of A740-R01 was clearly seen in A431 cells by fluorescence microscopy (Supplemental Fig. 5). There were significant differences in photoacoustic (Supplemental Figs. 6A and 6C) and fluorescence (Supplemental Figs. 6B and 6D) signals between A431 cells and 293T cells at different incubation times and with various concentrations of A740-R01 (P < 0.01). When incubated with different concentrations of A740-R01 for 1 h, the fluorescence of A431 cells remained unchanged, whereas background signals associated with 293T cells slightly increased in a dose-dependent manner. The uptake of A740-R01 after incubation for various times in both cell lines increased in a time-dependent manner (Supplemental Fig. 6). At the 1-h time point using 0.5 μM A740-R01, the photoacoustic and fluorescence signals from A431 cells were about 3- and 2.4-fold higher than that from 293T cells, respectively. Blocking of αvβ6 integrin receptors with a 10-fold molar excess of unlabeled R01 peptide resulted in a significantly (P < 0.01) decreased cellular uptake of A740-R01 (about 64% and 47% decrease of photoacoustic and fluorescence signals, respectively). These results confirm the specific high-affinity binding of A740-R01 to integrin αvβ6–expressing cells (Fig. 3).

Cell uptake study. Fluorescence (A) and photoacoustic (B) imaging of cells in Eppendorf tubes labeled with A740-R01 with or without a 10-fold excess of unlabeled R01 peptide (Block). Higher fluorescence and photoacoutic signal could be detected in A431 cells (αvβ6-positive) compared with 293T cells (αvβ6-negative) and block groups. (C and D) Quantitative analysis of fluorescence and photoacoustic signals. Data are shown as mean ± SD (n = 3). **P < 0.001. Avg = average.
Sensitivity Study
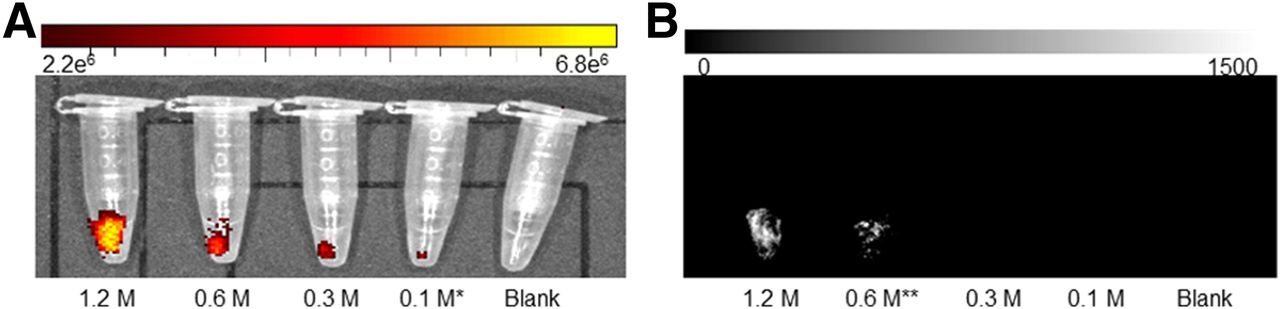
The minimum detectable number of A431 cells labeled with A740-R01 was determined to be 0.1 million using fluorescence imaging (P = 0.03 when compared with blank) and 0.6 million with photoacoustic imaging (P = 0.001 when compared with blank) (Fig. 4).

Sensitivity study. Fluorescence (A) and photoacoustic (B) imaging of various numbers of A431 cells labeled with A740-R01. Quantitative analysis showed lowest detectable number of labeled A431 cells to be 0.1 million for fluorescence imaging and 0.6 million for photoacoustic imaging.
Small-Animal Imaging and Tissue Biodistribution
The efficacy of A740-R01 to detect αvβ6 in vivo was studied in xenografts implanted in nude mice (Fig. 5A; Supplemental Fig. 7; Supplemental Video 1). Higher photoacoustic and fluorescence signals were observed at all times after injection (0.5, 1, 2, and and 4 h) in mice with A431 xenografts than in 293T xenografts (P < 0.05) (Fig. 5B). In vivo photoacoustic imaging of A431 xenografts showed a 2-fold-higher signal (1.87 ± 0.25 arbitrary units [AU]) than the baseline (0.99 ± 0.10 AU) and significantly higher signals (P = 0.005) than 293T xenografts after administration of A740-R01. However, the photoacoustic signal of 293T xenografts before (0.96 ± 0.05 AU) and 1 h after (1.07 ± 0.15 AU) administration of A740-R01 showed no significant (P = 0.317) photoacoustic signal increase (Fig. 5). The fluorescence signal of A431 xenografts at 1 h after injection was 8.27 ± 0.87 AU, an 8-fold increase over the value of 1.01 ± 0.07 AU before injection of A740-R01 (P = 0.005). The fluorescence signal of 293T xenografts at 1 h after injection was 1.10 ± 0.14 AU, which was approximately the same as the preinjection value of 1.00 ± 0.02 AU (P = 0.424) (Fig. 5).
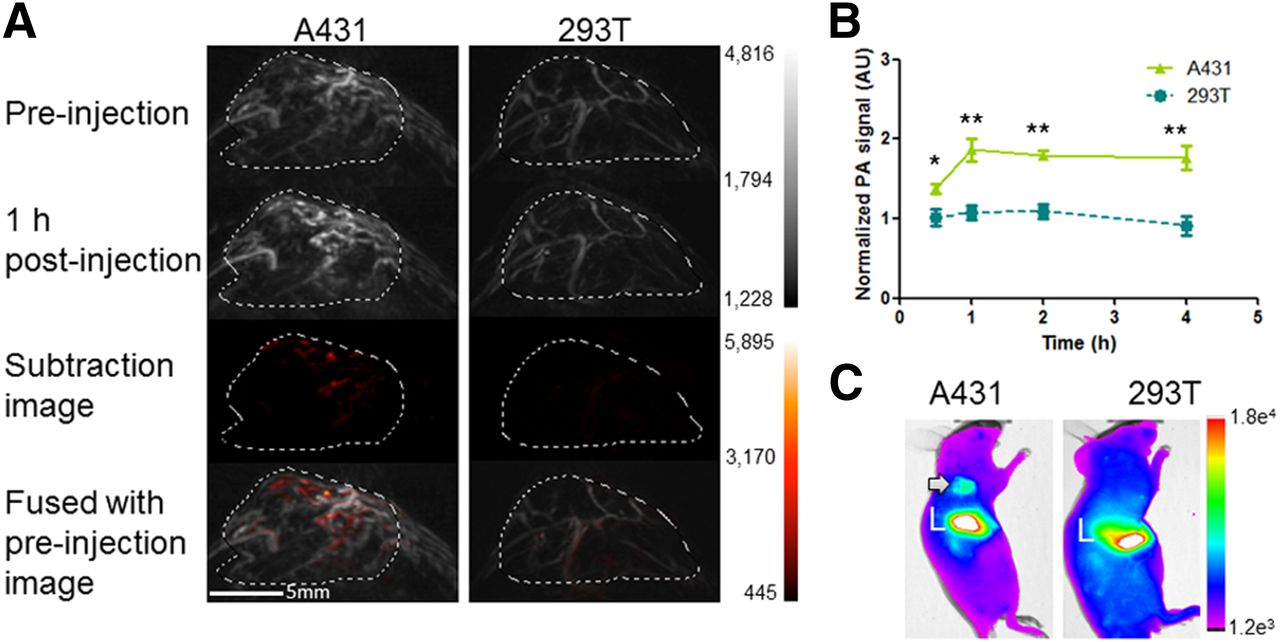
Imaging of tumors. (A) Photoacoustic imaging of tumors. Microvascular structures could be observed in both A431 and 293T xenografts. Clear enhancement of photoacoustic signal could be seen in A431 xenografts 1 h after tail vein injection of A740-R01, whereas there was only minor change in 293T xenografts. (B) Higher photoacoustic signals were detected at all time points in A431 xenografts than 293T xenografts. Maximum enhancement could be seen at 1 h after injection of A740-R01. *P < 0.05. **P < 0.01. (C) Fluorescence imaging of xenografts 1 h after injection of A740-R01. A431 xenograft (arrow) was clearly visible relative to background. L = liver.
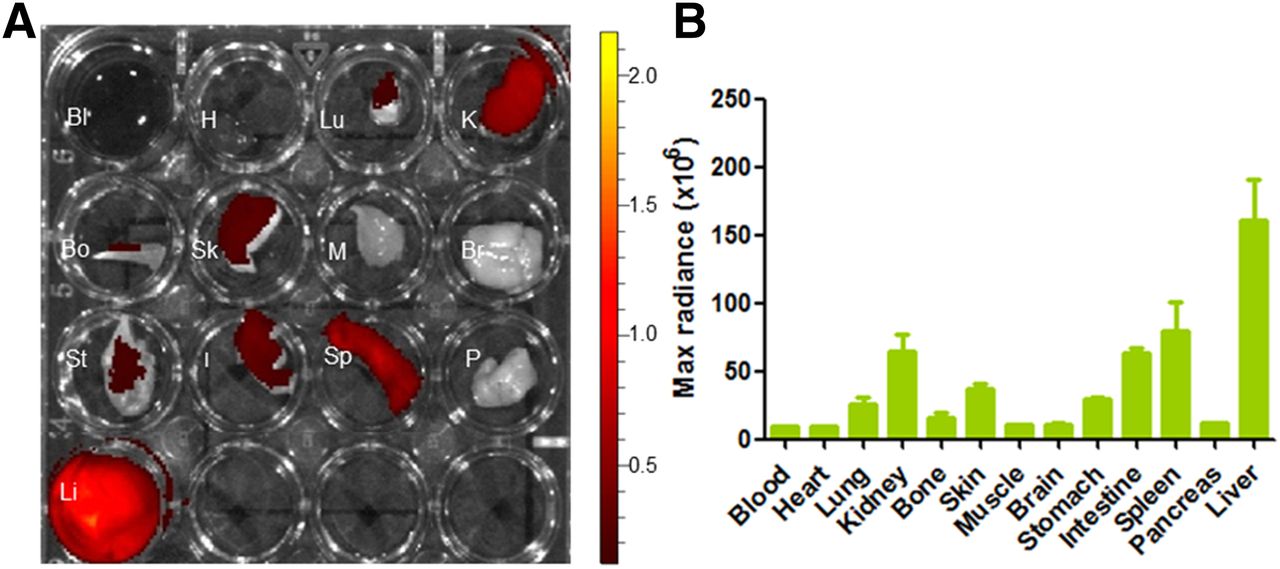
The biodistribution of A740-R01 in the liver, intestine, and kidneys was detected in vivo by photoacoustic imaging. An increased signal in the liver was observed 1 h after injection of A740-R01. Temporally dependent increases in photoacoustic signals were detected in the intestines, reaching peak value at 4 h after injection. Minimal photoacoustic contrast was observed for the kidneys throughout the study (Supplemental Fig. 8). Comparatively, the biodistribution of A740-R01 in various organs was also determined ex vivo by fluorescence imaging (Fig. 6A). The highest maximum radiance was observed in the liver, followed by the intestines, spleen, and kidneys (Fig. 6B).

Biodistribution of A740-R01. (A) Ex vivo fluorescence imaging of various organs 1 h after tail vein injection of A740-R01. (B) Quantitative analysis showed highest maximum radiance was observed in liver, followed by intestine, spleen, and kidneys. Bl = blood; Bo = bone; Br = brain; H = heart; I = intestine; K = kidney; Li = liver; Lu = lung; M = muscle; max = maximum; P = pancreas; Sk = skin; Sp = spleen; St = stomach.
DISCUSSION
The endogenous optical absorber hemoglobin enables photoacoustic imaging of the blood vasculature. Some cancers, such as breast cancer, may be detected without the need for exogenous contrast agents because of differential contrast between hemoglobin-rich tumors and hemoglobin-deprived fat and glandular tissues (4). In this study, we obtained 3D photoacoustic images of the blood vasculature using 750-nm light (Fig. 5A). However, information about the blood vasculature is often not enough to confirm the diagnosis.
Exogenous agents provide the means to elucidate molecular information, which can be used together with anatomic imaging data to produce a more accurate diagnosis. Exogenous agents can be composed of complementary components that perform dedicated functions such as tumor targeting and photoacoustic contrast. To develop photoacoustic imaging agents for cancer detection in humans, the long-term safety profiles of several metallic photoacoustic contrast agents are presently being evaluated for toxicity (30). At the same time, cystine knot peptides that recognize integrin αvβ6 are being evaluated in humans as PET agents for pancreatic cancer. In this study, we coupled a cystine knot peptide to a biocompatible organic dye, A740-R01, and evaluated it as a multimodal photoacoustic–fluorescence imaging agent for cancer detection in living subjects.
The cystine knot peptide, R01, was labeled with Atto 740 through the peptide’s sole amine located at its N terminus. A740-R01 demonstrated high uptake in integrin αvβ6–positive cells. The probe sensitivity was sufficiently high enough to detect as few as 0.6 million cells by photoacoustic imaging. In vivo studies of A740-R01 also show that integrin αvβ6–positive xenografts had a 2-fold-greater photoacoustic signal than integrin αvβ6–negative controls 1 h after tail vein injection (Fig. 5B). The photoacoustic signals do not change significantly from 1 to 4 h after injection (Supplemental Fig. 7), a phenomenon observed in previous studies with knottin peptides labeled with Cy5.5 (31). Much of the peptide clears the blood pool relatively quickly, so that any signal enhancement at the tumor represents either probe that is bound to the targeted receptor or probe that has been internalized by tumor cells. Importantly, these new imaging capabilities provide an additional level of molecular information for diagnosis and prognosis of disease marked by integrin αvβ6 overexpression (25).
A740-R01 can also simultaneously be used for fluorescence imaging of tumors in living subjects. In this study, 0.1 million cells in 100 μL DPBS can be detected by fluorescence imaging. There are approximately 10 million cells in a 100 mm3 tumor (13), so that A740-R01 could potentially detect lesions as small as 1 mm3 by fluorescence imaging. These hypotheses bode well for early detection of cancer.
We observed a difference in contrast enhancement between integrin αvβ6–positive and integrin αvβ6–negative tumors using both fluorescence and photoacoustic imaging. Fluorescence imaging can record 8-fold difference between positive and negative tumors 1 h after injection. In contrast, photoacoustic imaging showed a modest approximately 2-fold change. This phenomenon is consistent with the research by Xu et al. (32). This difference may be attributed to the difference in the efficiency of energy transfer through living tissue via different modalities.
Although fluorescence imaging has greater sensitivity at these depths, photoacoustic imaging has better spatial resolution. Therefore, bridging the 2 imaging modalities may improve detection of cancer in several ways. The photoacoustic properties of multifunctional probes have the potential to provide surgeons with a 3D image of a tumor located deep within tissues. Because photoacoustic imaging systems use an ultrasonic transducer to process signals, photoacoustic capabilities can be incorporated into standard ultrasound instruments. Moreover, real-time photoacoustic images can be obtained if the pulse repetition rate of the laser source is sufficiently fast (33). At the same time, the probe’s fluorescence should enhance detection of residual diseases in the surgical cavity (34). In this study, the cell-sensitivity assay as well as the in vivo and ex vivo imaging data show that the probe’s fluorescence signal can be detected in a highly sensitive manner. These multimodal approaches should provide additional real-time clinical information to improve surgical accuracy and ultimately treatment outcome (35).
In previous studies, high off-target kidney uptake was observed when cystine knot peptides were labeled with 64Cu-DOTA (24), 18F-fluorobenzoate (25), and 99mTc-single amino acid chelate (26) for PET and SPECT imaging. The ex vivo data from this study showed that the hydrophobic A740 dye strongly influenced the pharmacokinetics and tissue biodistribution of the probe. A740-R01 exhibited extremely high uptake in the liver, spleen, and intestines, indicating excretion of the probe through the hepatobiliary rather than urinary system. Interestingly, this study suggests that colabeling peptide-based tracers with organic dyes may be a way to decrease renal retention of radiotracers because off-target uptake may be shared by 2 clearance systems so that toxicity to any one organ system may be reduced.
There are some issues that need to be addressed in future studies. The enhanced photoacoustic signal is only about 2-fold higher than the preinjection signal, which is relatively lower than the signal enhancement gained from metallic nanoparticles (9). We may try to increase the labeling ratio of the probe to increase photoacoustic signal by evaluating larger-affinity ligands such as antibody fragments, which may be endowed with more favorable pharmacokinetics. In addition, other organic dyes or quenchers may be better photoacoustic contrast agents. These hypotheses are currently under study.
CONCLUSION
To our knowledge, this is the first report of molecular photoacoustic imaging for detection of integrin αvβ6–positive xenografts in living animals. The A740-labeled cystine knot peptide probe A740-R01 enabled imaging of integrin αvβ6–positive tumors by both photoacoustic and fluorescence imaging. Tumor uptake was rapid and high. Clearance of the probe also occurred quickly through the hepatobiliary system, so that renal uptake was low. On further development and validation, these types of probes may find clinical application in cancer diagnosis as well as in intraoperative imaging.
DISCLOSURE
The costs of publication of this article were defrayed in part by the payment of page charges. Therefore, and solely to indicate this fact, this article is hereby marked “advertisement” in accordance with 18 USC section 1734. This work was supported in part by NCI ICMIC P50CA114747 (SSG), The Canary Foundation, the Ben & Catherine Ivy Foundation, and the Sir Peter Michael Foundation. No other potential conflict of interest relevant to this article was reported.
Footnotes
Published online May 26, 2016.
- © 2016 by the Society of Nuclear Medicine and Molecular Imaging, Inc.
REFERENCES
- Received for publication November 10, 2015.
- Accepted for publication April 14, 2016.


Jump to section
Related Articles
Cited By...
- SPECT/CT imaging, biodistribution and radiation dosimetry of a 177Lu-DOTA-integrin {alpha}v{beta}6 cystine knot peptide in a pancreatic cancer xenograft model
- Recent Development of Technology and Application of Photoacoustic Molecular Imaging Toward Clinical Translation
- Development and Preclinical Validation of a Cysteine Knottin Peptide Targeting Integrin {alpha}v{beta}6 for Near-infrared Fluorescent-guided Surgery in Pancreatic Cancer