


Abstract
Several studies have highlighted the role of vascular 18F-NaF uptake as a marker of ongoing calcium deposition. However, accumulation of 18F-NaF is often inconsistent with localization of arterial plaque. Calcification activity and thus 18F-NaF uptake might prevail in the earlier plaque stages. To test this hypothesis, we evaluated 18F-NaF uptake in plaque of 3 different densities, using density as a marker of calcification progression. We also tested whether attenuation-weighted image reconstruction affects 18F-NaF uptake in the different plaque stages. Methods: Sixty-four oncologic patients (14 men and 50 women; mean age, 65.3 ± 8.2 y; range, 26–81 y) underwent 18F-NaF PET/CT. A volume of interest was drawn on each plaque within the infrarenal aorta to assess mean standardized uptake value and attenuation (in Hounsfield units [HU]). Plaque was then categorized as light (<210 HU), medium (211–510 HU), or heavy (>510 HU). Standardized uptake value was normalized for blood 18F-NaF activity to obtain the plaque target-to-background ratio (TBR). During this process, several focal, noncalcified areas of 18F-NaF were identified (hot spots). The TBR of the hot spots was computed after isocontour thresholding. The TBR of a noncalcified control region was also calculated. In 35 patients, the TBR of non–attenuation-corrected images was calculated. Results: The average TBR was highest in light plaque (2.21 ± 0.88), significantly lower in medium plaque (1.59 ± 0.63, P < 0.001), and lower still in heavy plaque (1.14 ± 0.37, P < 0.0001 with respect to both light and medium plaque). The TBR of the control region was not significantly different from that of heavy plaque but was significantly lower than that of light and medium plaque (P < 0.01). Hot spots had the highest absolute TBR (3.89 ± 1.87, P < 0.0001 vs. light plaque). TBRs originating from non–attenuation-corrected images did not significantly differ from those originating from attenuation-corrected images. Conclusion: Our results support the concept that 18F-NaF is a feasible option in imaging molecular calcium deposition in the early stages of plaque formation, when active uptake mechanisms are the main determinants of calcium presence, but that retention of 18F-NaF progressively decreases with increasing calcium deposition in the arterial wall. Our data suggest that non–attenuation-corrected reconstruction does not significantly affect evaluation of plaque of any thickness.
Since the earliest pathologic studies, arterial calcification has been regarded as a focus of ectopically formed skeletonlike tissue, caused by continuous calcium deposition in the arterial intima (1). Modern histopathologic research has confirmed this hypothesis, demonstrating the presence of cells deriving from osteoblastic and osteoclastic lineage in areas of vascular calcification (2,3). These characteristics allow for the use of CT to assess calcification and generate a clinical calcification score, which is widely regarded as a sound index of the burden and extent of atherosclerotic plaque (4,5). However, a calcification score represents only a static picture, not the pathophysiologic behavior of plaque, and may not fully correlate with a patient’s clinical status and cardiovascular risk (6–8). Therefore, in view of the similarities between calcification formation and osteogenesis, functional studies with 18F-NaF PET have been performed to complement the calcification score with functional data on plaque mineral metabolism (9–15). These studies, however, highlighted a striking discrepancy between PET and CT in imaging plaque. In particular, PET-positive areas almost invariably colocalized with calcification, whereas only a fraction of the calcification showed visible 18F-NaF uptake (9). Moreover, the fraction of calcification that correlated with tracer uptake varied widely according to the arterial segment studied, being as low as 12% if the average of all calcification sites was considered (9), showing great variability in the coronary district (15), and peaking in the carotid arteries (10).
The mismatch between the morphologic and radioisotopic findings might be grounded on the pathophysiology of plaque buildup, which is a complex and dynamic process involving repeated sequences of inflammation, repair, apoptosis, and necrosis. Arterial calcification is, however, a prominent feature of atherosclerosis and is thus used as an imaging marker of plaque progression (9,10). In the earliest calcification stages, the inflammatory environment fosters the release of several bone-forming peptides, which promote the active apposition of a hydroxyapatite matrix in the arterial wall, appearing on CT as soft, inconspicuous, sparse areas of calcification (3). Conversely, in the more advanced stages, calcification appears as a continuous, clumped, dense area sometimes completely encircling the vessel; this stage is quiescent, with further calcium apposition occurring only as the wall becomes progressively unable to support the homeostatic mechanisms that prevent extracellular calcium precipitation (16). Although the early and late stages may sometimes overlap, they are mostly metachronous. The tracer features of 18F-NaF are actually well suited to imaging the early stage, but plaque characteristics in the late stage may prevent any radioisotopic approach (13). Moreover, a systematic overcorrection artifact caused by the influence of high-density calcium clumps on attenuation-corrected reconstruction of the raw PET dataset may prove to be a confounder (17).
The present study assessed whether the evolutionary calcification stage influences tracer uptake by plaque. We hypothesized that plaque that is still growing and thus relatively inapparent on CT images has higher 18F-NaF uptake, since active mechanisms of calcium deposition prevail in this stage. Conversely, we postulated that end-stage calcification does not show increased tracer uptake. To complete this evaluation, we also challenged the influence of attenuation-corrected reconstruction on calcification uptake.
MATERIALS AND METHODS
Patients
The study included 64 patients with either breast or prostate cancer (14 men and 50 women; mean age, 65.3 ± 8.2 y; range, 26–81 y) undergoing 18F-NaF PET/CT to evaluate for the presence of bone metastases. To be included in the study, the patient had to have at least one calcification in the infrarenal abdominal aorta. Calcification was defined as a mural area having a minimum density of 130 HU (14). Patients were excluded from the study if they had a history of vasculitis, autoimmune disease, or systemic inflammatory disease or had received chemotherapy or radiotherapy in the preceding 8 wk, as previously proposed (18). Ongoing or previous statin treatment was a further exclusion criterion to exclude the influence of these drugs on the results (19).
Written informed consent was obtained from each patient before the examination. The Institutional Ethics Committee approved this retrospective study, and the requirement to obtain specific informed consent for research purposes was waived.
18F-NaF PET Acquisition and Reconstruction
Patients underwent 18F-NaF PET/CT using either of two 16-slice PET/CT hybrid systems: a Biograph 16 (Siemens Medical Solutions) or a Discovery LS (GE Healthcare).
The patients received an intravenous bolus of 18F-NaF (4.8–5.2 MBq/kg of body weight). The PET/CT acquisition started 60–75 min afterward; in the meantime, the patients were hydrated and encouraged to void, so as to diminish the fraction of unbound tracer. The entire body was scanned from vertex to toes in arms-down position; the emission scan lasted 120 min per bed position. PET raw data were reconstructed using ordered-subset expectation maximization (3 iterations and 16 subsets), and attenuation was corrected using the raw CT data. Both attenuation-corrected and non–attenuation-corrected PET data were obtained. The transaxial field of view and pixel size of the reconstructed PET images were 58.5 cm and 4.57 mm, respectively, with a matrix of 128 × 128. As per the standard PET/CT imaging protocol, 16-detector-row helical CT was performed with nondiagnostic current and voltage settings (120 kV and 80 mA), a gantry rotation speed of 0.5 s, and a table speed of 24 mm per gantry rotation. No contrast medium was injected. The entire CT dataset was fused with the 3-dimensional PET images using an integrated software interface (Syngo; Siemens). Low-dose CT (reconstructed at a 4-mm slice thickness) was used to provide an anatomic reference for localizing vascular calcification.
Image Analysis
Calcification was identified within the walls of the infrarenal abdominal aorta, defined as the segment between the emergence of the renal arteries and the iliac bifurcation. This vessel was selected because in the general population it frequently contains various types of calcification, both initial-stage and end-stage (20). Calcification was excluded from the analysis if spillover from a nearby structure (e.g., the lumbar vertebrae) was strongly suspected. CT images were used to semiautomatically draw volumes of interest (VOIs) on each calcification site, using a region-growing algorithm whose lower limit was set at 130 Hounsfield units (HU). In each VOI, average HU were calculated. Thereafter, average standardized uptake value and counts were computed for each VOI using the coregistered PET data (from attenuation-corrected and non–attenuation-corrected images, respectively). These values were normalized for blood-pool radioactivity, which was obtained by drawing a 10-slices-thick VOI on the inferior vena cava, to obtain plaque target-to-background ratio (TBR).
During this stage, several foci of increased 18F-NaF uptake without apparent calcification were seen within the aortic wall on the coregistered CT images. These foci were defined as “noncalcified hot spots” and were selected for further analysis on the basis of criteria suggested by Tatsumi et al. for 18F-FDG (21): hot spots were analyzed if they contrasted appreciably from surrounding segments in a masked qualitative analysis by 2 experienced interpreters. Hot spots were thus segmented in a VOI using a 3-dimensional isocontour method, setting the lower threshold at 50% of the voxel with the highest standardized uptake value. This value was chosen as it allowed the higher-uptake area to be included, limiting the confounding interference of partial-volume effect and motion artifacts. The average standardized uptake value of the hot spots was also normalized for blood-pool value to obtain the hot-spot TBR.
Finally, TBR was defined in a control region—a VOI at least 5 slices thick manually drawn in an arterial segment where neither calcium deposition nor increased 18F-NaF uptake was detected.
Images were analyzed with a 64-bit OsiriX DICOM viewer (Pixmeo) and the PMOD software package (version 3.4, PMOD Technologies).
Statistical Analysis
All calcifications were plotted and then stratified in tertiles, according to their average HU. Plaque whose mean HU was in the lower tertile was defined as light, whereas plaque whose mean HU fell into the intermediate and upper tertiles was labeled as medium and heavy, respectively.
All data are reported as mean ± SD. Differences between groups were tested using 1-way ANOVA, with intergroup comparisons made using the Bonferroni test. The 2-tailed Pearson R index was used to test the significance of correlations. Statistical analyses were performed using a dedicated software application (SPSS, version 21.0; IBM).
RESULTS
Characteristics of CT and PET Findings
In total, 397 calcifications were identified in the population (6.2 per patient, on average). After stratification according to tertiles, a range of 130–210 HU defined light plaque, 211–510 HU defined medium plaque, and greater than 510 HU defined heavy plaque. The mean attenuation coefficients of hot spots and control regions were, respectively, 46.2 ± 11.3 and 41.6 ± 9.9 (not statistically significant). Every patient had at least one light plaque. Medium plaque was less common (41 patients [64%]), and heavy plaque was least common (31 patients [48%]). Noncalcified arterial hot spots were present in 55 patients (86%), accounting for a total of 189 areas (3.4 per patient, on average).
Arterial Plaque Uptake
Light plaque had the highest blood-pool–corrected uptake: the average TBR was 2.21 ± 0.88. This value was significantly higher than that for either medium plaque (1.59 ± 0.63, P < 0.001) or heavy plaque (1.14 ± 0.37, P < 0.0001). Similarly, the TBR of medium plaque was significantly greater than that of heavy plaque (P < 0.001, Fig. 1).
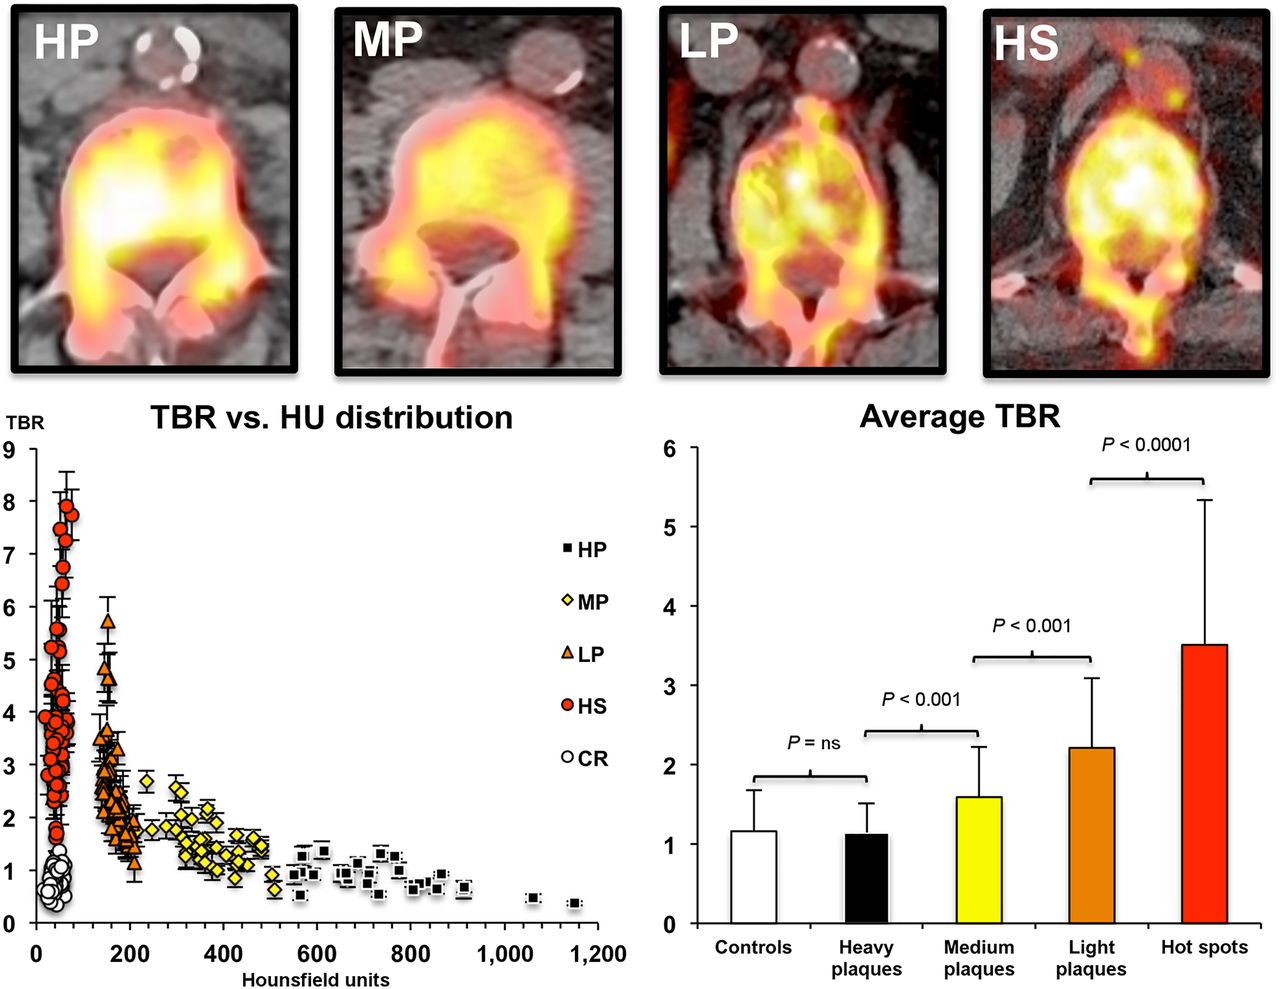
PET/CT qualitative and semiquantitative analysis of the 3 plaque subtypes, hot spots, and control regions. Radiologically, less dense plaque (light) shows intense fluoride uptake, denser plaque (medium) shows less tracer accumulation, and plaque in the highest tertile of HU density (heavy) shows no visible uptake. The highest activity is in calcium-free arterial hot spots. Graph at bottom left shows distribution of uptake intensity vs. density of plaque subtypes, hot spots, and control regions, allowing appreciation of the distribution spread of each element and the inverse correlation between plaque density and TBR. Graph at bottom right shows the significant difference between different plaque types and the almost identical uptake of fluoride in heavy plaque and control regions. CR = control region; HP = heavy plaque; HS = hot spots; LP = light plaque; MP = medium plaque.
Uptake by heavy plaque was so low as to be indistinguishable from control regions (1.16 ± 0.52, P = 0.87), whereas both medium plaque and light plaque were clearly distinguishable from control regions (P < 0.01 and P < 0.001, respectively; Fig. 1).
Overall, the density of calcified plaque, in HU, showed a definite, inverse correlation with TBR when all plaques of each class were averaged in each patient (R = 0.7, P < 0.01).
The TBRs obtained from non–attenuation-corrected images were 2.15 ± 0.81, 1.6 ± 0.45, and 1.05 ± 0.39 for light, medium, and heavy plaque, respectively. These values did not significantly differ from those obtained from attenuation-corrected images (Fig. 2).

Estimated average uptake in the 3 plaque groups, reconstructed according to attenuation-corrected and non–attenuation corrected protocols (top). No substantial differences were noticed in any plaque type. Qualitative assessment (bottom) did not show any artifactual uptake on attenuation-corrected reconstruction. AC = attenuation-corrected; HP = heavy plaque; LP = light plaque; MP = medium plaque; NAC = non–attenuation-corrected; NS = not statistically significant.
Correlation Between Foci of 18F NaF Uptake and Calcifications
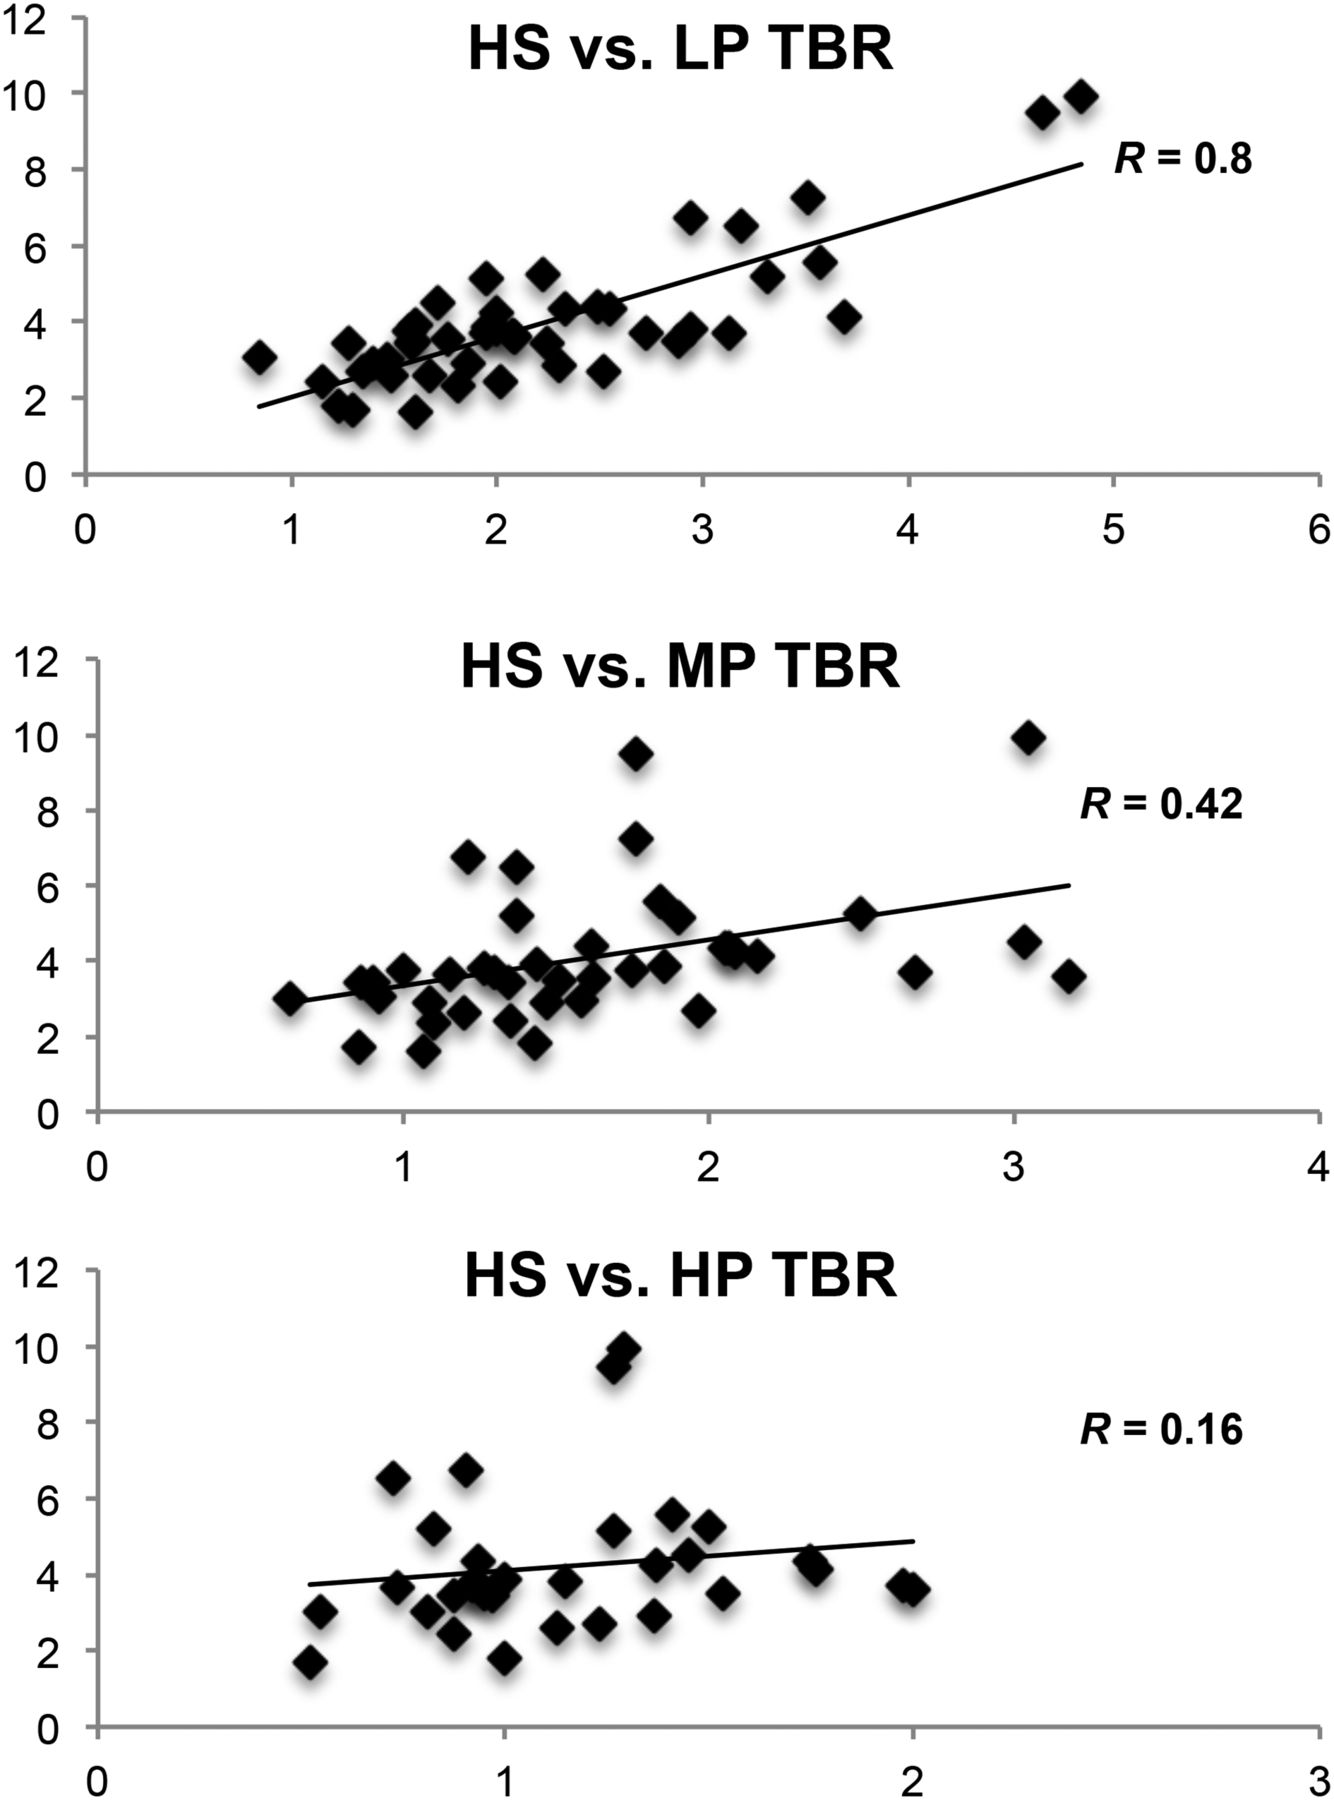
The average TBR for noncalcified arterial hot spots was significantly higher than that for any plaque type (3.89 ± 1.87, P < 0.0001; Fig. 1). In each patient, the average TBR of these hot spots strictly correlated with the corresponding TBR in light plaque (R = 0.8, P < 0.01; Fig. 3). The correlation, although less significant, was still present for medium plaque (R = 0.42, P < 0.01) but was not present for heavy plaque (R = 0.16, P = 0.37).

Patient-by-patient correlation between hot-spot average and light (top), medium (middle), and heavy (bottom) plaque. The significance of this correlation markedly dwindles when progressing from light to heavy plaque, suggesting that lighter plaque shares, at least in part, mechanisms active within hot spots. HP = heavy plaque; HS = hot spots; LP = light plaque; MP = medium plaque.
DISCUSSION
The present study, in which 18F-NaF was used to evaluate mineral metabolism within the arterial wall, documented an inverse correlation between plaque calcium density and tracer avidity. Within calcified plaque, radioisotope accumulation peaked in lesions at the lower end of the HU coefficient and progressively ebbed in heavier calcific concretions. Accordingly, uptake in heavy plaque did not substantially differ from that in control regions.
Interestingly, foci of 18F-NaF uptake could also be observed in calcium-free arterial regions in most patients. These areas did not show a significant increase in HU, confirming the divergent mechanisms underlying visible calcium deposition and tracer uptake. However, the correlation between average TBR in these noncalcified hot spots and the corresponding mean values in light plaque suggests a connection between the mechanisms of radiotracer uptake within different regions of the vascular wall. The present data do not establish what these foci of uptake represent and whether they will subsequently evolve into early-stage calcification. Further studies that include subsequent scans (18F-NaF PET/CT or contrast-enhanced CT) are needed to evaluate the evolution of these findings, as was done by Adbeldaky et al. in their study of the use of 18F-FDG to detect inflammation (22).
The kinetics of fluoride within vascular walls may account for the uneven pattern of 18F-fluoride distribution within plaque. Our data show that estimated tracer uptake strongly depends on plaque characteristics, as less CT-evident plaque—scoring low on software that assesses calcium—actually concentrates the tracer more avidly. Thus, potentially reversible processes, active in fostering the growth of calcification, may be of relevance mainly in the earlier stages of plaque formation.
Conversely, denser and more CT-evident plaque—with high calcium scores—has relatively lower fluoride uptake. This does not imply that the plaque will no longer grow (as gradient-based processes can further precipitate calcium salts), but it does suggest that denser plaque has a relatively slower rate of inorganic calcium apposition. By derivation, radioisotopic evaluation of arterial plaque would be feasible only in these still-active calcifications, whereas denser calcifications would be considered scar tissue and therefore excluded from any functional evaluation.
Our findings may thus explain the high variability in the prevalence of hot spots in different vascular districts, as plaque growing in smaller-diameter vessels, such as the carotid and coronary arteries, are more likely to be identified even at an initial stage (23–25). Conversely, plaque developing in larger vessels can be relatively asymptomatic; such segments may thus house clinically undetected initial-, intermediate-, and end-stage cold plaque.
Our data also indicate that CT evidence of calcification and PET evidence of 18F-NaF uptake may represent 2 different markers of atherosclerosis. The former seems to be an accurate index of total vascular damage, describing the history of atherosclerotic progression and its duration throughout the arterial tree. The latter seems more closely related to the actual rate of plaque progression, mostly in its earlier stages.
This study presents some limitations. First, calcium-free hot spots were a rather common finding in our series. Although the average attenuation coefficient of these vascular segments was not significantly different from control areas, the limited spatial resolution of nondiagnostic CT does not permit the presence of calcium microcalcifications to be excluded (26). This pattern can perpetuate the vicious circle of plaque inflammation, leading to continued plaque growth (27). Recent research by Joshi et al. demonstrated that in plaque with increased 18F-NaF uptake, microcalcifications are more prevalent and expression of bone turnover markers is greater (28). Thus, plaque assessment by 18F-NaF may potentially represent a useful tool in trials assessing pharmacologic reduction of atherosclerotic progression. Moreover, as previously reported (18), the patients in the analysis had various oncologic diseases with potential for metastasizing to bone marrow, as this situation justifies applying the radiation burden associated with 18F-NaF PET/CT. Finally, even though there is still only limited pathologic evidence of a link between plaque fluoride uptake and foci of osteoblastlike-cell activity, tracer uptake in the mineralization matrix has been validated in various experimental and clinical settings (29,30). Histopathologic confirmation of shared mechanisms in bone-forming tissue and in ongoing plaque (3) provides a solid ground for the application of nuclear imaging to estimation of plaque calcium metabolism.
CONCLUSION
Our study might be interpreted as demonstrating a possible way to functionally image the arterial tree using 18F-NaF PET. When atherosclerotic damage was visible, tracer uptake correlated inversely with the degree of calcium deposition. The difference in the nature of the information provided by CT and PET suggests that these techniques may open two different windows on atherosclerosis—one describing its history and the other its current progression. This integrated information may thus allow more complete assessment of vascular damage and more accurate evaluation of the effectiveness of treatment.
DISCLOSURE
The costs of publication of this article were defrayed in part by the payment of page charges. Therefore, and solely to indicate this fact, this article is hereby marked “advertisement” in accordance with 18 USC section 1734. No potential conflict of interest relevant to this article was reported.
Footnotes
Published online May 7, 2015.
- © 2015 by the Society of Nuclear Medicine and Molecular Imaging, Inc.
REFERENCES
- Received for publication January 12, 2015.
- Accepted for publication March 25, 2015.


Jump to section
Related Articles
Cited By...
- 18F-NaF Uptake on Vascular PET Imaging in Symptomatic versus Asymptomatic Atherosclerotic Disease: a Meta-Analysis
- 18F-Fluoride Positron Emission Tomographic Imaging of Penile Arteries and Erectile Dysfunction
- Assessment of Physiologic Intracranial Calcification in Healthy Adults Using 18F-NaF PET/CT
- Imaging Cardiovascular Calcification
- Finding Calcium in Noncalcified Lesions: 18F-Fluoride Offers Insights into Atheroma Evolution