


Article Figures & Data
Figures
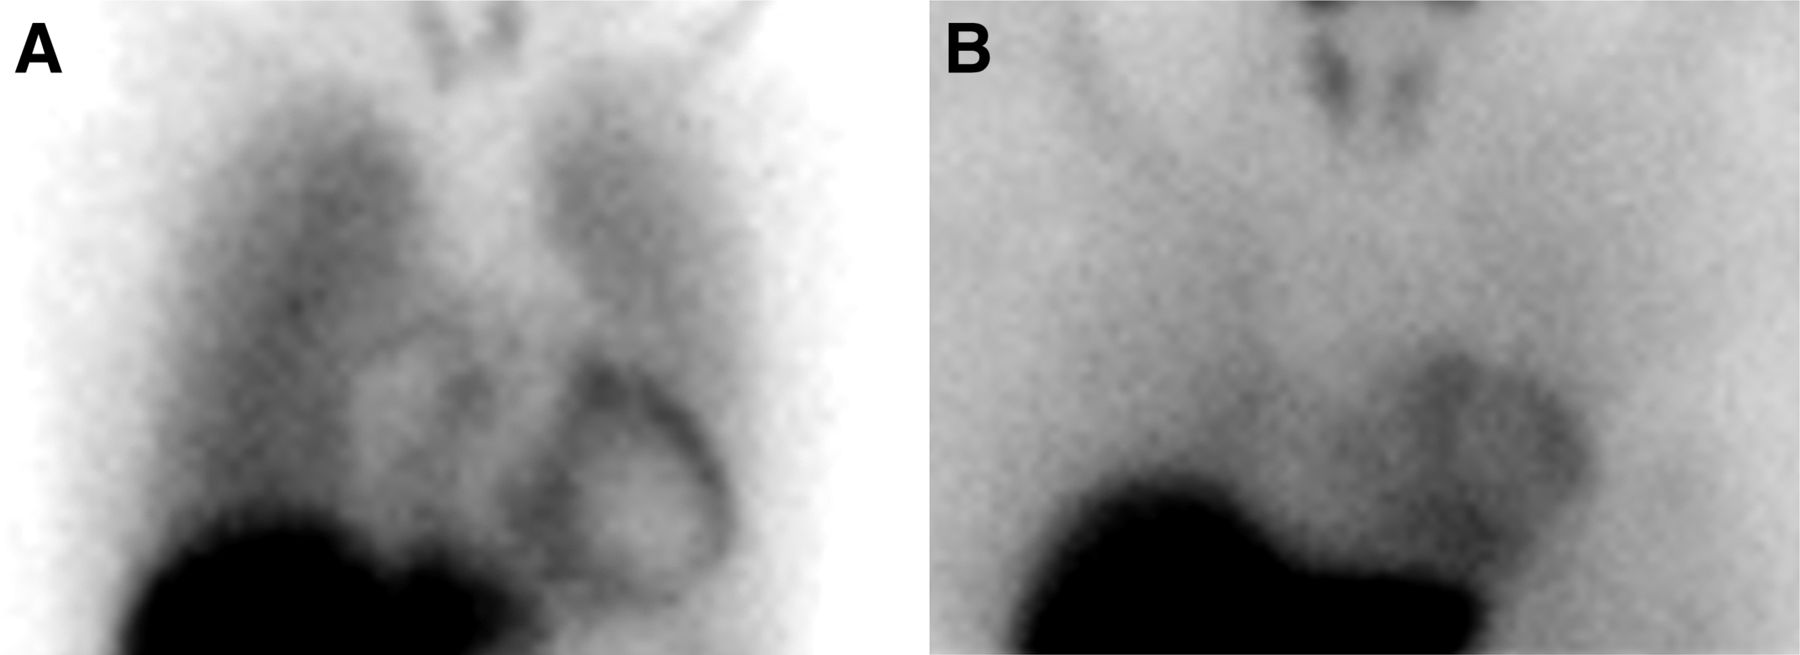
- FIGURE 1.
Lower mortality risk based on preserved myocardial innervation. Prediction of risk for composite endpoint of death or death-equivalent event is improved with addition of H/M. (A) Image from 37-y-old man with nonischemic cardiomyopathy, LVEF of 28%, and BNP of 378 ng/mL. Baseline 2-variable model predicted 21% (intermediate) 2-y risk. 123I-MIBG H/M was 1.69. Three-variable model (LVEF, BNP, and H/M) predicted 14% (intermediate) risk. Risk for all-cause mortality based on H/M alone (Fig. 4) was 6% (low). (B) Image from 51-y-old woman with ischemic HF, LVEF of 30%, and BNP of 166 ng/mL. Baseline 2-variable model estimated 13% (intermediate) 2-y risk for composite mortality endpoint. H/M was 1.80. Three-variable model (LVEF, BNP, and H/M) estimated 7% (low) risk. No subject in trial with H/M ≥ 1.80 experienced all-cause mortality.
- FIGURE 2.
Kaplan–Meier all-cause mortality survival curves based on H/Ms of <1.25, 1.25–1.64, and ≥1.65. Mortality risk is significantly stratified by dividing population on the basis of mean H/M (1.44) ± SD (0.20). Two-year mortality was 3.1% for H/M ≥ 1.65 (n = 147), 11.8% for H/M = 1.25–1.64 (n = 660), and 19.1% for H/M < 1.25 (n = 154).
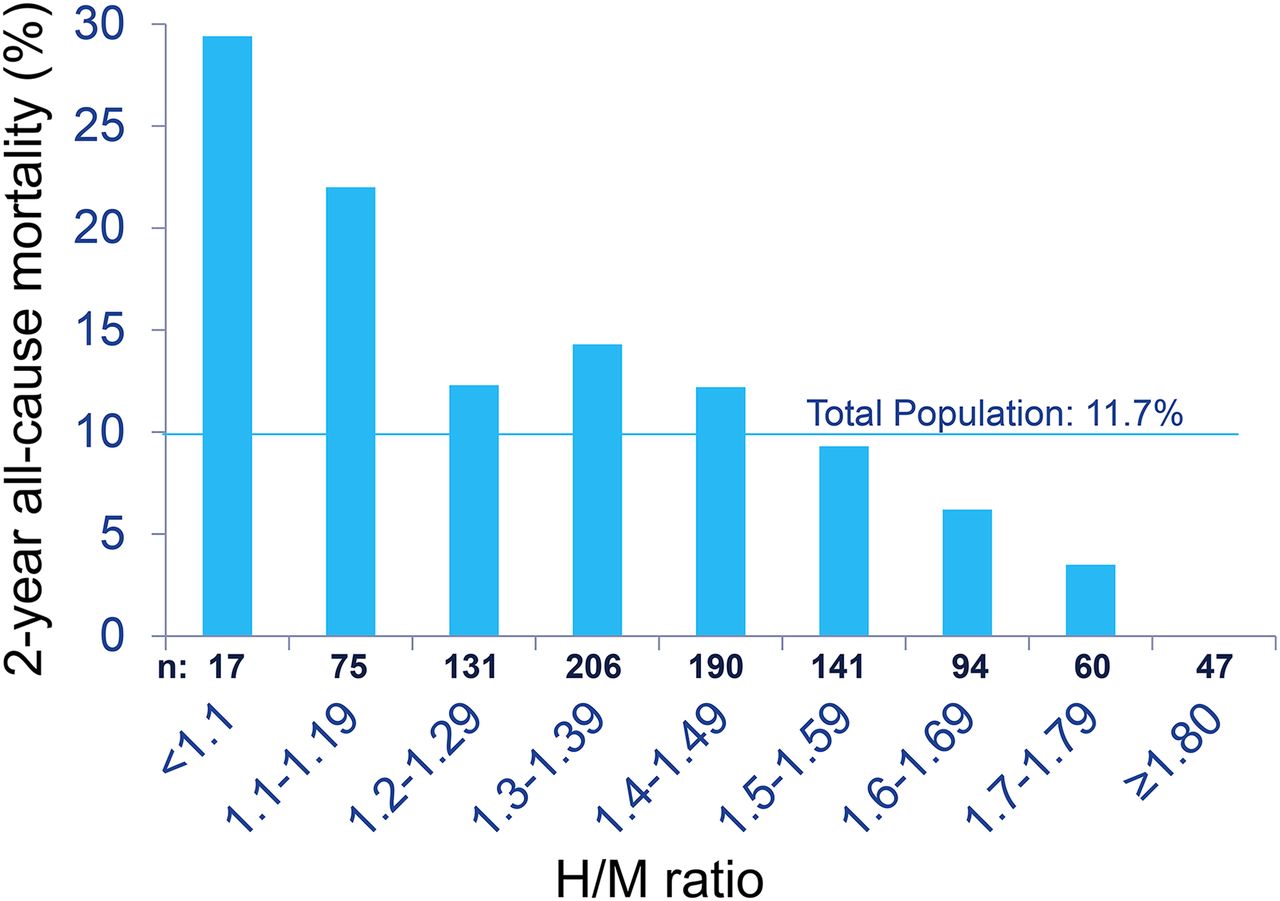
- FIGURE 3.
Two-year all-cause mortality rate in relation to H/M intervals. Two-year all-cause mortality rates based on 0.1 increments of H/M show progressive decline from maximum of 29.4% for H/M < 1.10. There were no deaths among 47 subjects with H/M ≥ 1.80.
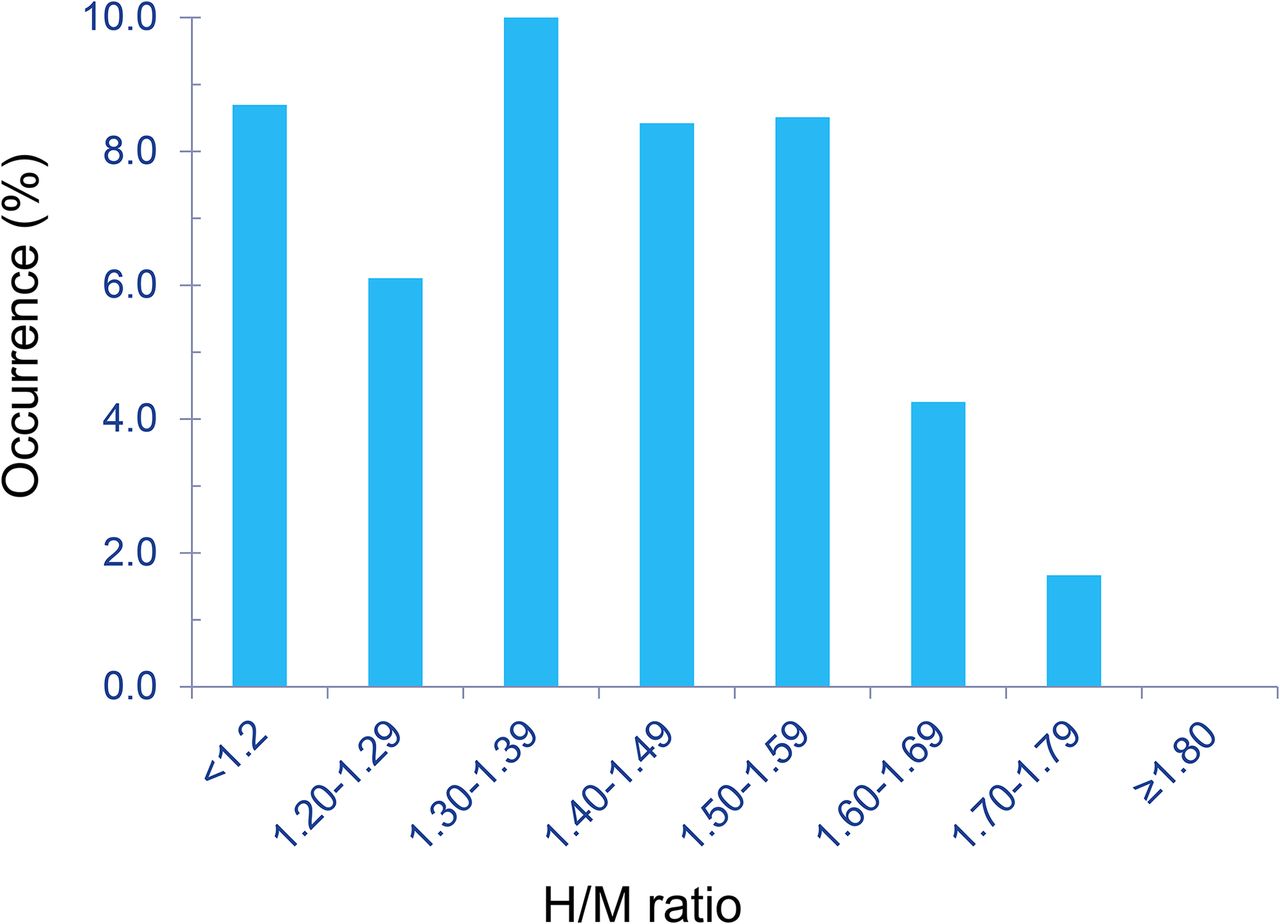
- FIGURE 4.
Occurrence of fatal and potentially fatal arrhythmic events (sudden death, resuscitated arrest, ICD defibrillation) (n = 70) in relation to H/M. Peak occurrence was in 1.30–1.39 range, with progressive decline for higher H/Ms. There were no fatal or potentially fatal arrhythmic events among subjects with H/M ≥ 1.80.


Tables
Variable No. of subjects with data All subjects Alive (n = 863) Dead (n = 101) P Age* (y) 964 62 ± 12 62 ± 12 67 ± 14 <0.0001 Male sex (%) 964 80 80 85 NS Ischemic etiology (%) 964 66 65 70 NS NYHA II (%) 964 83 83 78 NS Ejection fraction* (%) 964 27 ± 6 27 ± 6 25 ± 6 0.0004 Systolic blood pressure* (mm Hg) 963 123 ± 19 123 ± 19 123 ± 20 NS ICD at enrollment (%) 964 19 20 13 0.08 ICD by death or end of study (%) 964 43 44 32 0.02 QRS width* (ms) 951 120 ± 29 119 ± 29 126 ± 29 0.02 ACEI (%) 964 72 72 71 NS ARB (%) 964 23 23 22 NS β blocker (%) 964 92 92 87 0.09 Aldosterone blocker (%) 964 39 39 36 NS Digoxin (%) 964 24 24 27 NS Statin (%) 964 67 67 67 NS Sodium* (meq/dL) 947 139 ± 3 139 ± 3 139 ± 4 NS Creatinine* (mg/dL) 946 1.20 ± 0.37 1.17 ± 0.34 1.41 ± 0.49 <0.0001 Glomerular filtration rate by MDRD* (mL/min) 946 68 ± 21 69 ± 20 59 ± 24 <0.0001 ↵* Data are mean ± SD.
NS = not statistically significant; ACEI = angiotensin-converting enzyme inhibitor; ARB = angiotensin receptor blocker; MDRD = modification of diet in renal disease.
Model No. of deaths Variable HR P Primary list of factors without H/M (n = 964) 101 (10.5%) Age 1.04 (1.02, 1.05) <0.001 Primary list of factors with H/M (n = 961) 101 (10.5%) H/M 0.08 (0.03, 0.24) <0.001 Age 1.03 (1.01, 1.05) <0.001 Secondary list of factors without H/M (n = 926) 97 (10.5%) Age 1.02 (1.00, 1.04) 0.024 Log BNP 4.80 (3.10, 7.43) <0.001 Secondary list of factors with H/M (n = 926) 97 (10.5%) H/M 0.23 (0.07, 0.76) 0.016 Age 1.02 (1.00, 1.04) 0.018 Log BNP 4.05 (2.56, 6.39) <0.001 Data in parentheses are 95% CI.
- TABLE 3
Multivariate Logistic Regression Model and ROC Curve Analysis for 1-Year All-Cause Mortality
Factor Significant variable Odds ratio estimate ROC AUC P for AUC difference Primary list without H/M (n = 899) Age 1.031 (1.005, 1.058) 0.583 (0.490, 0.677) Primary list with H/M (n = 898) Age 1.028 (1.002, 1.056) 0.684 (0.608, 0.760) 0.027 H/M 0.034 (0.006, 0.186) Secondary list without H/M (n = 864) Log BNP 6.049 (3.172, 11.535) 0.740 (0.670, 0.811) Secondary list with H/M (n = 863) Log BNP 4.859 (2.476, 9.537) 0.754 (0.687, 0.821) 0.302 H/M 0.130 (0.021, 0.818) Data in parentheses are 95% CI.
- TABLE 4
Multivariate Logistic Regression Model and ROC Curve Analysis for 2-Year All-Cause Mortality
Factor Significant variables Odds ratio estimate ROC AUC P for AUC difference Primary list without H/M (n = 760) Age 1.041 (1.021, 1.062) 0.650 (0.587, 0.713) Lipid-lowering drugs at baseline 0.574 (0.353, 0.934) NYHA classification 1.708 (1.006, 2.899) Primary list with H/M (n = 759) Age 1.039 (1.019, 1.060) 0.687 (0.628, 0.746) 0.058 Lipid-lowering drugs at baseline 0.565 (0.344, 0.928) H/M 0.070 (0.020, 0.238) Secondary list without H/M (n = 731) Age 1.02 (1.00, 1.05) 0.751 (0.697, 0.805) Lipid-lowering drugs at baseline 0.55 (0.33, 0.92) Log BNP 5.45 (3.26, 9.12) Secondary list with H/M Age 1.03 (1.00, 1.047) 0.757 (0.704, 0.810) 0.475 Lipid-lowering drugs at baseline 0.54 (0.32, 0.91) Log BNP 4.56 (2.67, 7.77) H/M 0.19 (0.05, 0.73) Data in parentheses are 95% CI.
- TABLE 5
Multivariate Cox Proportional Hazards Model for Composite of All-Cause Mortality, Resuscitation, and ICD Defibrillation Using Secondary List of Factors
Model Number of events Variable HR P Without H/M (n = 926) 130 (14.0%) LVEF 0.96 (0.93, 0.99) 0.002 Log BNP 3.07 (2.14, 4.41) <0.001 With H/M (n = 924) 129 (14.0%) H/M 0.24 (0.08, 0.68) 0.008 LVEF 0.96 (0.94, 0.99) 0.004 Log BNP 2.56 (1.76, 3.72) <0.001 Data in parentheses are 95% CI.
- TABLE 6
Multivariate Logistic Regression Model for 2-Year Composite of All-Cause Mortality, Resuscitation, and ICD Defibrillation Using Secondary List of Factors
Model Significant variable Odds ratio estimate ROC AUC Without H/M (n = 735) History of hypertension 1.70 (1.08, 2.66) 0.728* (0.681, 0.776) Lipid-lowering drugs at baseline 0.61 (0.39, 0.97) LVEF 0.95 (0.92, 0.98) Log BNP 3.62 (2.37, 5.52) With H/M (n = 734) Log BNP 3.03 (1.96, 4.69) 0.733* (0.686, 0.779) History of hypertension 1.62 (1.03, 2.54) Lipid-lowering drugs at baseline 0.613 (0.387, 0.973) LVEF 0.956 (0.926, 0.988) H/M 0.227 (0.069, 0.743) ↵* P = 0.408.
Data in parentheses are 95% CI.
Model with LVEF, log BNP, and H/M Model with LVEF and log BNP Low probability (<8%) Intermediate probability (8%–24%) High probability (>24%) Subjects with events Low probability (<8%) 9 4 0 Intermediate probability (8%–24%) 2 50 9 High probability (>24%) 0 3 50 Subjects without events Low probability (<8%) 180 29 0 Intermediate probability (8%–24%) 71 347 29 High probability (>24%) 0 28 113 Net gain in reclassification (event) = 8/127 = 0.063 (P = 0.059). Net gain in reclassification (no event) = 41/797 = 0.051 (P = 0.001). Net reclassification improvement: 0.114 (P = 0.002). Table includes only subjects with results for all 3 variables.


Jump to section
Related Articles
Cited By...
- Nuclear Imaging of the Cardiac Sympathetic Nervous System: A Disease-Specific Interpretation in Heart Failure
- Simplified Quantification and Acquisition Protocol for 123I-MIBG Dynamic SPECT
- Quantification and Determination of Normal 123I-Meta Iodobenzylguanidine Heart-to-Mediastinum Ratio (HMR) from Cardiac SPECT/CT and Correlation with Planar HMR
- Variability in Heart-to-Mediastinum Ratio from Planar 123I-MIBG Images of a Thorax Phantom for 6 Common {gamma}-Camera Models