


Abstract
Our objective was to compare the quality and diagnostic performance of 18F-fluoride PET/MR imaging with that of 18F-fluoride PET/CT imaging in patients with foot pain of unclear cause. Methods: Twenty-two patients (9 men, 13 women; mean age, 48 ± 18 y; range, 20–78 y) were prospectively included in this study and underwent a single-injection dual-imaging protocol with 18F-fluoride PET/CT and PET/MR. At a minimum, the PET/MR protocol included T1-weighted spin echo and proton-density fat-saturated sequences in 2 planes each with simultaneous acquisition of PET over 20 min. PET/CT included a native isotropic (0.6 mm) diagnostic CT scan (80 kV, 165 mAs) and a subsequent PET scan (2 min per bed position). By consensus, 2 masked interpreters randomly assessed both PET datasets for image quality (3-point scale) and for the presence of focal lesions with increased 18F-fluoride uptake (maximum of 4 lesions). For each dataset (PET/CT vs. PET/MR), the diagnoses were defined using both PET and a morphologic dataset. Standardized uptake values (SUVs) from the 2 devices were compared using linear correlation and Bland–Altman plots. Moreover, we estimated the potential for dose reduction for PET/MR compared with PET/CT considering the longer acquisition time of PET/MR analyzing count rate statistics. Results: Image quality was rated diagnostic for both PET datasets. However, with a mean rating of 3.0/3 for PET/MR and 2.3/3 for PET/CT, image quality was significantly superior for PET/MR (P < 0.0001). The sensitivity of the PET datasets in PET/MR and PET/CT was equivalent, with the same 42 lesions showing focal 18F-fluoride uptake. In PET/MR, the mean SUVmean was 10.4 (range, 2.0–67.7) and the mean SUVmax was 15.6 (range, 2.9–94.1). In PET/CT, the corresponding mean SUVmean of PET/CT was 10.2 (range, 1.8–55.6) and the mean SUVmax was 16.3 (range, 2.5–117.5), resulting in a high linear correlation coefficient (r = 0.96, P < 0.0001, for SUVmean and for SUVmax). A final consensus interpretation revealed the most frequent main diagnoses to be osteoarthritis, stress fracture, and bone marrow edema. PET/CT was more precise in visualizing osteoarthritis, whereas PET/MR was more specific in nondegenerative pathologies because of the higher soft-tissue and bone marrow contrast. The longer acquisition time of MR compared with CT would potentially allow 18F-fluoride dose reduction using hybrid 18F-fluoride PET/MR imaging of at least 50% according to the counting rate analysis. Conclusion: In patients with foot pain of unclear cause, 18F-fluoride PET/MR is technically feasible and is more robust in terms of image quality and SUV quantification than 18F-fluoride PET/CT. In most patients, 18F-fluoride PET/MR provided more diagnostic information at a higher diagnostic certainty than did PET/CT. Thus, PET/MR combines the high sensitivity of 18F-fluoride PET to pinpoint areas with the dominant disease activity and the specificity of MR imaging for the final diagnosis with the potential for a substantial dose reduction compared with PET/CT.
Foot pain is a problem commonly seen by orthopedic surgeons in their daily routine. It can be a clinical symptom of many different entities such as stress reactions or fractures, systemic disorders, foot deformation and osteoarthritis, osteochondral lesions, interdigital neuroma, synovitis, impingement, tendinopathy and tenosynovitis, or metatarsophalangeal joint instability. The incidence and prevalence of metatarsalgia vary depending on the cause.
Multiple imaging modalities are available to evaluate foot pain, including radiography, CT, MR imaging, bone scintigraphy, and ultrasound. Radiography of the foot may reveal fractures, foot deformation, or arthritis, whereas bone scans are helpful for an earlier diagnosis of stress fractures and some types of infections and tumors. MR imaging has been shown to be useful and superior to CT in the assessment of soft-tissue pathologies and abnormalities of bone marrow.
Another option for evaluating areas of bone remodeling is 18F-fluoride PET imaging, which depicts mainly osteoblastic activity. Several PET-only studies have shown that it is not possible to differentiate benign from malignant lesions on the basis of the intensity of 18F-fluoride uptake and that diagnostic accuracy can be significantly improved by additional morphologic CT or MR imaging (1–3). A study of Fischer et al. revealed that 18F-fluoride PET/CT has a substantial therapeutic impact on management in patients with foot pain of unclear cause (4). However, it is well known that for most musculoskeletal pathologies, MR imaging is superior to CT because MR imaging has increased soft-tissue contrast and the possibility of imaging bone marrow edema (BME). In combination with the excellent lesion-to-background ratio of 18F-fluoride PET, 18F-fluoride PET/MR has the potential to increase the accuracy of the diagnosis of chronic foot pain. Thus, the purpose of our study was, first, to compare the quality and performance of 18F-fluoride PET/MR versus 18F-fluoride PET/CT and, second, to analyze the diagnostic performance of 18F-fluoride PET/MR versus 18F-fluoride PET/CT in patients with foot pain of unclear cause.
MATERIALS AND METHODS
Patient Population
Twenty-two patients (9 men, 13 women; mean age, 48 ± 18 y; range, 20–78 y) with foot pain of unclear cause were prospectively enrolled in this study between February 2012 and August 2013 after having been routinely referred to our institute for clinical 18F-fluoride PET/CT imaging. For these patients, the specific diagnosis for this condition had remained inconclusive after clinical examination and radiography. The study was approved by the local institutional review board. To be included, the subjects had to give written informed consent and be able to undergo PET/MR after the PET/CT examination. Subjects were excluded if they were pregnant, under 18 y old, or had contraindications for MR imaging. All subjects underwent a single-injection/dual-imaging protocol. After completion of the PET/CT scan, the patients were subsequently positioned on the PET/MR scanner with the smallest possible temporal delay to use the remaining activity of the initial 18F-fluoride injection. 18F-fluoride was produced by proton irradiation of 18O-enriched water in a cyclotron (5).
18F-Fluoride PET/CT and PET/MR Imaging
Scanning began about 75 ± 18 min after the intravenous injection of a dose of 133 ± 68 MBq of 18F-fluoride and was performed on a clinical PET/CT system (Biograph mCT; Siemens Healthcare). This scanner has an axial field of view (FOV) of 21.8 cm and a ring diameter of 84.2 cm. The transverse spatial resolution of its PET detector assembly was measured to be 4.4 mm near the center of the FOV, whereas the sensitivity in the center was found to be 9.7 kcps/MBq (6). The patients lay supine for the examination. PET/CT included a native CT scan (FOV, 780 mm; tube voltage, 80 kV; tube current, 165 mAs; CARE Dose4D; rotation time, 0.5 s; collimation, 0.6 mm) and a subsequent PET scan (2 min per bed position). Attenuation maps were obtained by bilinear transformation and were used for attenuation correction as previously described (7). The acquired images were postprocessed on the Biograph mCT, providing multiplanar reformatted images for PET alone, CT alone (axial, coronal, and sagittal reformation with a slice thickness of 2 mm and axial reconstruction with a slice thickness of 0.6 mm), and fused PET/CT.
All PET/MR examinations were performed using an integrated whole-body hybrid PET/MR system (Biograph mMR; Siemens Healthcare). Compared with the Biograph mCT, the Biograph mMR has a larger axial FOV of 25.8 cm and a smaller ring diameter of 65.6 cm. The spatial resolution of 4.3 mm is similar, but sensitivity is approximately 50% higher, at 15.0 kcps/MBq (8–10). PET data acquired on the Biograph mCT were reconstructed without using time-of-flight information to better match the reconstruction parameters of the Biograph mMR, which does not have such a capability. On average, the PET/MR scan began 107 ± 26 min after injection. The patients were positioned in the MR scanner as similarly as possible to their positioning for the PET/CT examination. Because the mean acquisition time was longer in PET/MR than in PET/CT, the patients were immobilized using cushions of various sizes around the coil to reduce motion artifacts during scanning. The combined PET/MR protocol was as follows. First, a coronal 2-point Dixon 3-dimensional volumetric interpolated T1-weighted MR sequence was acquired for generation of attenuation maps as previously published (11). Together with the start of this Dixon MR sequence, the PET acquisition (20 min) started at the same bed position, thus ensuring optimal temporal and regional correspondence between MR imaging and PET data.
Additionally, a dedicated MR protocol of the foot was defined according to the location of the maximum pain, with the following parameters: slice thickness, 3 mm; FOV, 120–225 mm; and matrix, 320 × 256 to 384 × 384. The protocol consisted of at least one proton-density fat-saturated sequence in 2 planes and one T1-weighted turbo spin echo sequence in 2 planes. If clinically relevant, additional contrast-enhanced sequences were performed: a T1-weighted turbo spin echo sequence before and after application of gadolinium in the best suitable plane and a T1-weighted turbo spin echo fat-saturated sequence with gadolinium in a second plane.
Data Processing and Image Analysis
PET data obtained on the PET/CT and PET/MR scanners were processed with comparable reconstruction and correction algorithms. For both modalities, emission data were corrected for randoms, dead time, scatter, and attenuation. A 3-dimensional attenuation-weighted ordered-subsets expectation maximization iterative reconstruction algorithm was applied with 3 iterations and 21 subsets, gaussian smoothing of 4 mm in full width at half maximum, and a zoom of 1.
For image analysis, all datasets were transferred to a dedicated postprocessing workstation (Syngo MMWP; Siemens Medical Solutions). PET/CT and PET/MR were analyzed in consensus by a dual-board-certified radiologist and nuclear physician with several years of experience in PET/CT and PET/MR interpretation and a board-certified radiologist with special training in musculoskeletal radiology. The interpreters were aware of the patients’ history, prior radiography results, and clinical examination results. PET/MR and PET/CT were evaluated separately at least 8 wk apart.
Visual Rating
The 18F-fluoride PET data from both CT and MR imaging were rated for every patient with regard to overall image quality: 0, nondiagnostic image quality; 1, low image quality (distinct artifacts, strong image noise); 2, good image quality (few artifacts, moderate image noise); and 3, excellent image quality (no artifacts, low image noise).
Lesion Identification and Classification
Both PET datasets were evaluated for the presence of focal lesions showing increased 18F-fluoride uptake compared with uptake in normal bone. CT and MR imaging data were used for exact anatomic correlation with 18F-fluoride uptake and were analyzed for important additional PET-negative morphologic findings. After the findings for both PET and morphologic imaging had been described, a main diagnosis and up to 2 secondary diagnoses were determined for each PET/MR and PET/CT dataset. Depending on the interpreters’ certainty, the determinations were judged as either diagnostic (category 1) or suggestive (category 2).
The following criteria were used to define the most frequently observed pathologic findings. Osteoarthritis was defined as the presence of osteophytes, joint space narrowing, subchondral cysts, subchondral sclerosis, or a combination of these on both sides of the articular joint with the 18F-fluoride being centered along the joint space. A stress reaction was defined as BME with corresponding focal 18F-fluoride uptake on PET as well as the absence of a fracture line and osteoarthritis. BME was defined as an ill-defined area of increased signal intensity on intermediate-weighted images with fat suppression and corresponding hypointensity on T1-weighted images not below the intensity of skeletal muscle. A stress fracture was defined as BME with the presence of a fracture line on T1-weighted MR imaging or a dense sclerotic line on CT, along with 18F-fluoride uptake.
Finally, a consensus interpretation based on all available data was performed to define the modality (PET/CT vs. PET/MR) that provided the most specific and precise diagnosis.
Quantitative Assessment
For quantitative comparison between the PET data acquired on the PET/CT scanner with that acquired on the PET/MR scanner, an SUV-based analysis of mean and maximum tracer uptake in up to 4 focal lesions and 3 representative, not pathologic, osseous structures (calcaneus, distal tibia, and calcaneus) was performed. Volumes of interest were placed over matching corresponding 18F-fluoride–positive lesions. To calculate SUVs, the axial slice with the SUVmax of the lesion was first located automatically, using standardized software for images of both scanners. An isocontour volume of interest including all voxels above 50% of the maximum was then created to calculate SUVmean. Within all volumes of interest, mean and maximum standardized uptake values were measured.
Count Rate Analysis on PET/CT and PET/MR with Regard to Scan Duration
Because image quality for PET/MR was suspected to be superior to that for PET/CT in view of the longer acquisition time for PET/MR (20 min compared with 2 min for PET/CT), we calculated the theoretic 18F-fluoride dose reduction in PET/MR that would yield equal numbers of detected true coincidences on both scanners. For this purpose, count rate statistics were analyzed for all 7 patient datasets—the PET raw data of which had been acquired in list-mode format—by determining the number of trues in the first 120 s of the PET/CT and PET/MR examinations as well as in the entire 1,200 s of the PET/MR scan. The obtained information was then corrected for decay to the start of the PET/CT scan. Because the PET/MR scan duration for one patient was only 600 s, the number of trues in this case was extrapolated to an acquisition time of 1,200 s.
Statistical Analysis
Statistical analysis was performed using the MedCalc, version 12.3.0.0, software package for Windows (Microsoft). P values of less than 0.05 were considered statistically significant. First, descriptive statistical evaluation was performed. Then, differences in image quality as well as the SUVmean/SUVmax of focal foot lesions/normal bone between PET/MR and PET/CT were compared using the Spearman rank correlation coefficient. The overall statistical differences in measured SUVs were tested using the nonparametric Wilcoxon matched-pairs signed rank test. Because a high degree of correlation does not necessarily imply good agreement between the 2 measurements, a Bland–Altman plot was constructed to assess this agreement (12). A Bland–Altman plot displays the difference between the 2 measurements versus their average as a scatterplot, on which each point represents a single measurement.
RESULTS
Visual Rating
The results for overall image quality showed that PET/MR was superior to PET/CT, with an overall excellent image quality score of 3.0/3 points for all PET/MR datasets but 2.3 of 3 for PET/CT (2/3 points in 15/22 patients and 3/3 points in 7/22 patients). Image quality for PET/MR was significantly superior to that for PET/CT (P < 0.0001).
Quantitative Analysis
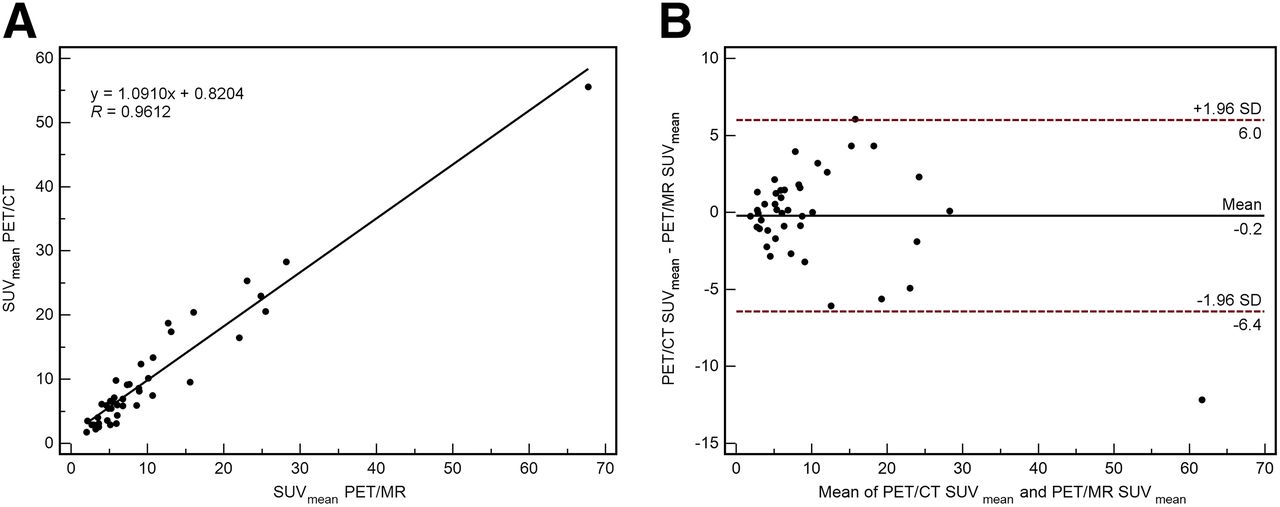
Both SUVmean and SUVmax for PET/CT and PET/MR showed a highly statistically significant linear correlation (R = 0.96, P < 0.0001, for both SUVmean and SUVmax) for pathologic foot lesions. Mean SUVmean and SUVmax, including SD and range, for pathologic lesions and regions of normal bone for PET/MR and PET/CT are presented in Table 1. Also included is P value, correlation coefficient (R), and 95% confidence interval for the correlation between PET/MR and PET/CT. Correlation analysis and Bland–Altman plots for SUVmean and SUVmax can be found in Figure 1 and Supplemental Figure 1, respectively (supplemental materials are available at http://jnm.snmjournals.org).
Results of Quantitative Analysis

Analysis of tracer uptake between PET/CT and subsequent PET/MR as assessed by SUVmean in focal lesions reveals high correlation (R = 0.96) between the 2 modalities (A). Difference between the 2 SUV measurements is shown by Bland–Altman plot (B), in which difference between the 2 SUV measurements is plotted against their average. For SUVmean, mean difference is −0.2 SUV (95% confidence interval, +6.0 and −6.4 SUV), indicating nearly perfect quantitative agreement between SUVs from the 2 modalities.
Findings and Diagnoses for PET/MR and PET/CT
In total, the same 42 lesions with intense, focal 18F-fluoride uptake were identified in PET datasets for both PET/MR and PET/CT, showing equivalent sensitivity. A detailed presentation of patient characteristics, including symptoms, findings, and diagnoses in PET/MR and PET/CT, is shown in Supplemental Table 1. One patient did not show any abnormal findings.
Most Frequent Diagnoses
The 3 most frequent diagnoses were osteoarthritis, stress fracture, and BME representing a stress reaction of bone. Osteoarthritis of one or several articular joints was diagnosed in 9 of 22 patients. In patients with osteoarthritis but no other concomitant findings, PET/CT was favored as the modality of choice by the interpreting team. This preference was related to the higher image resolution and thus better depiction of anatomic findings, including some additional minor findings such as calcaneal spurs on CT. Nevertheless, the certainty that osteoarthritis was the main final pathologic finding was rated as diagnostic (category 1) for both PET/CT and PET/MR.
Stress fractures were present in 4 of 22 patients. For this condition, PET/MR was rated as the modality of choice in all but one case. In one patient the depiction of PET/CT as the most conclusive modality was related only to an additional sesamoid fracture whose displacement could be better visualized on CT. Otherwise, the reviewer regarded PET/MR as more conclusive for stress fractures because of the earlier depiction of the typical T1-weighted hypointense line compared with a sclerotic line on CT, providing higher diagnostic confidence.
Six of 22 patients showed stress reactions. Because of the visualization of BME, stress reactions could be classified in all presented cases more precisely on PET/MR, which was determined to be the modality of choice by the interpreting team. In PET/CT, this diagnosis could be assumed only indirectly because of the absence of any sclerotic bone changes and signs of osteoarthritis in a region of monofocal 18F-fluoride uptake, resulting in lower diagnostic certainty (category 2).
Modality of Choice (18F-Fluoride PET/MR vs. 18F-Fluoride PET/CT)
With regard to the modality of choice, PET/MR was rated in 13 of 22 patients to be more appropriate than PET/CT. The better specificity of PET/MR was related to its capability to visualize bone marrow or soft-tissue pathologies. Besides stress reaction and stress fracture, PET/MR enabled more precise diagnosis in cases with an aneurysmatic bone cyst, soft-tissue edema, tenosynovitis, large ganglion cysts, or osteochondral lesions. In 6 of 22 patients, the MR part of 18F-fluoride PET/MR revealed 6 completely new findings with no correlate on either 18F-fluoride PET or CT. PET/CT was regarded as the modality of choice in cases in which the better anatomic depiction of morphologic changes in cortical bone (e.g., osteophytes, subchondral changes, and calcaneal spurs) was crucial (6/22 patients). These included the patients with only osteoarthritis and no other pathologic findings, a patient with an accessory navicular syndrome, and a patient with a fracture of the sesamoid bone.
Figure 2 shows representative images of a patient with a stress fracture at the base of os metatarsale I, and Figure 3 shows images of a patient with osteoarthritis and a ganglion cyst originating from the dorsal upper ankle joint that could be depicted only on MR imaging. Additional 18F-fluoride PET/MR and PET/CT images of a patient with an aneurysmatic bone cyst and a stress reaction resolving on follow-up imaging are shown in Supplemental Figures 2 and 3.

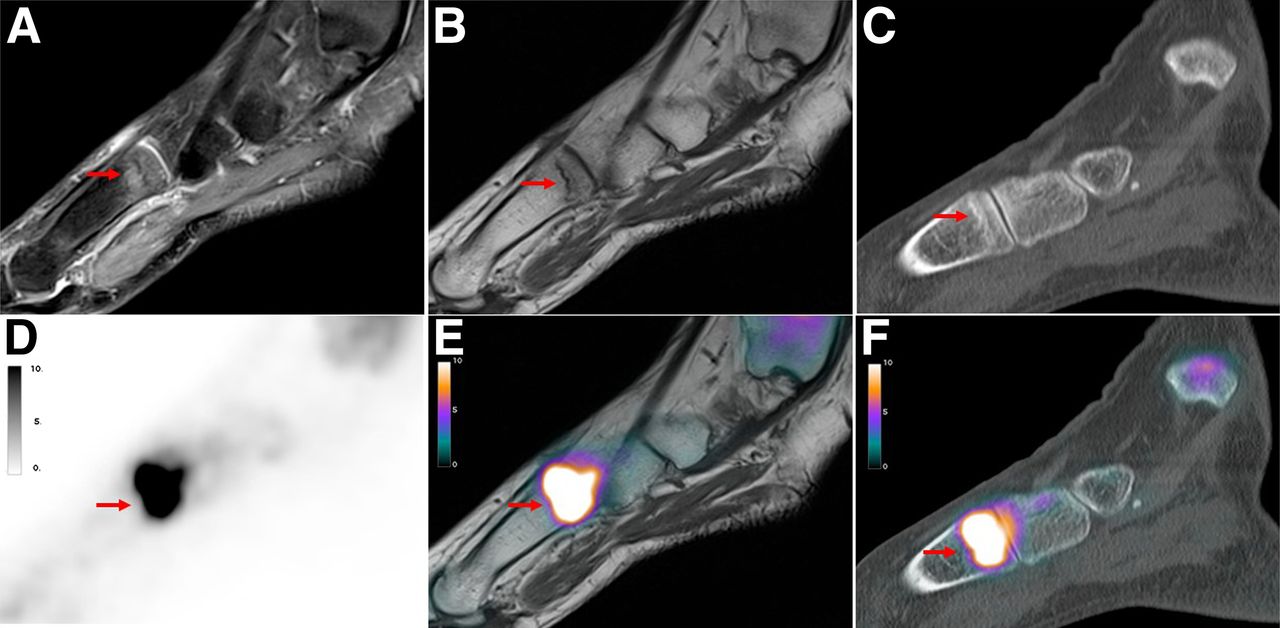
Simultaneously acquired 18F-fluoride PET/CT and PET/MR images of 49-y-old woman with pain over left metatarsal foot for several months without history of trauma. Sagittal MR images show BME in fat-saturated proton-density–weighted images at base of os metatarsale I (arrow, A) with presence of hypointense fracture line on T1-weighted image (arrow, B). In corresponding PET scan of PET/MR (D and E) and PET/CT (F), intense focal 18F-fluoride uptake at base of os metatarsale I is shown (arrow). However, in PET-positive region, corresponding CT scan shows only slight sclerotic band (arrow, C).
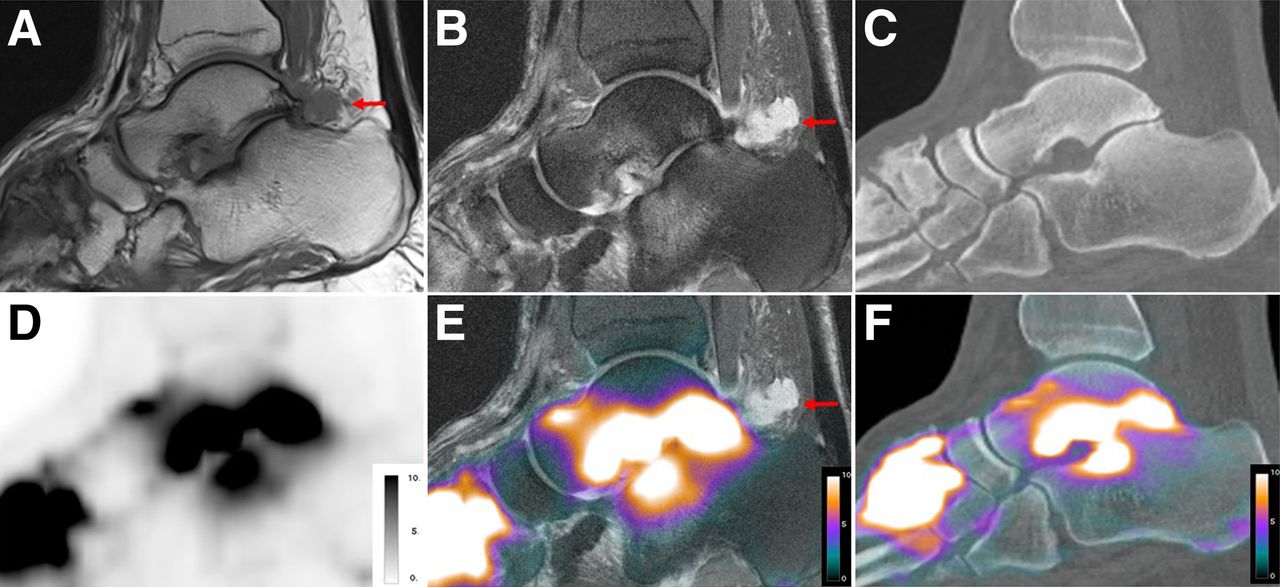
Sagittal 18F-fluoride PET/CT and PET/MR images of 55-y-old man with persistent pain and swelling of left foot for several years. There are advanced signs of osteoarthritis, particularly in tarsometatarsal joints and in subtalar joint, which can be observed on sagittal T1-weighted turbo spin echo MR sequence (A), sagittal proton-density fat-saturated MR sequence (B), and sagittal CT (C), including joint space narrowing, osteophytes, subchondral cysts, and subchondral BME (only on MR imaging). Additionally, only MR imaging could detect T1-weighted hypointense, proton-density fat-saturated hyperintense ganglion cyst originating from posterior subtalar joint (arrows). Corresponding PET scan of PET/MR (D and E) and PET/CT (F) shows intense focal 18F-fluoride uptake on both sides of tarsometatarsal and subtalar joint; however, in this case no additional information was provided by PET. Slight difference in slice positioning leads to different impression of 18F-fluoride uptake.
Assessment of Potential Dose Reduction
The average number of true coincidences per injected dose detected in the first 120 s of a scan was measured to be 48,928 ± 31,400 MBq−1 on PET/CT and 63,599 ± 44,329 MBq−1 on PET/MR. The number of true events registered during the entire 1,200 s of the PET/MR scan was 600,405 ± 419,410 MBq−1; that is, on average 12 times higher than that for the PET/CT scan with a duration of 120 s. This means that with an equal scan duration, approximately 80% of the dose administered for the PET/CT scan would have been required for the PET/MR to yield the same number of true coincidences. For a PET/MR scan duration of 20 min, approximately only 10% of the injected activity would have resulted in the same number of acquired true events.
Before conclusions on image quality can be drawn from count rate statistics, the effects of additional hardware on the PET/MR FOV have to be evaluated in this clinical setting (13). However, these first results hint at a possible dose reduction of at least 50% for PET/MR compared with PET/CT, if the corresponding scan duration is 10 times longer.
DISCUSSION
The results of this study indicate that 18F-fluoride PET/MR is equivalent to 18F-fluoride PET/CT concerning SUV quantification and lesion detection in patients with foot pain of unclear cause. The image quality of PET/MR was superior to that of PET/CT, potentially because of the longer acquisition time for PET/MR, raising the possibility of 18F-fluoride dose reduction. However, 18F-fluoride PET/MR was more conclusive than PET/CT because of the higher soft-tissue contrast and the visualization of bone marrow pathologies on MR imaging.
Our study indicates that 18F-fluoride PET/MR is technically feasible and robust despite the difference in attenuation correction. This finding is concordant with other studies comparing 18F-FDG PET/CT and PET/MR in malignant bone lesions (14,15).
However, in both cited whole-body studies, the SUVs of bone lesions were substantially lower in PET/MR. In contrast, in our study, the mean SUVmean/SUVmax of PET/CT and PET/MR were similar. Two possible explanations could be the different radiotracer (18F-fluoride vs. 18F-FDG) and examination of a small, peripheral part of the body instead of the central skeleton. MR FOV restrictions can lead to a significant quantification error in large volumes compared with small volumes (16). Furthermore, concerning attenuation correction in PET/MR, other problems (e.g., treating bone as soft tissue, increased attenuation by cortical bone and calcified areas) are still unresolved. Compared with those potential confounders, our results indicate that for 18F-fluoride PET/MR of the feet, no relevant influence is present. From a clinical point of view, this indication is supported by the fact that in our study the same lesions were identified in both modalities by the interpreting team.
18F-fluoride PET/MR would allow substantial reduction in the applied activity due to the potential of a longer PET acquisition in parallel to the acquisition of MR. This capability would offer a substantial dose reduction of at least 50% in patients of younger age with no history of malignant disease (Supplemental Table 1). However, validation in further prospective studies is needed.
For diagnostic purposes, 18F-fluoride PET is a highly sensitive but not very specific tool for the detection of metabolically active benign bone disease, with the drawback of low specificity (5). Thus, additional morphologic imaging is recommended using either sequential CT/MR imaging or hybrid PET/CT and, more recently, PET/MR.
The results from our study show that 18F-fluoride PET/MR was regarded as the modality of choice in a substantially higher number of cases (13/22) than was 18F-fluoride PET/CT. Most of these cases were patients with stress fractures or BME, and here the superiority of MR in the depiction of bone marrow pathologies is well known whereas the bony structures in these cases were still without any detectable changes on CT, leading to a less reliable diagnosis on PET/CT (17).
18F-fluoride PET/CT was superior only in cases of osteoarthritis showing no additional findings or complications (4/22) and in cases (2/22) in which the superb image resolution of multislice CT was crucial (e.g., assessment of small bony structures). The clinical preference of CT due to a more accurate anatomic depiction is related to an overall low signal from dense bony structures on all MR sequences, leading to a less distinct delineation and the usual lower spatial resolution of MR (18,19). Nevertheless, even in cases of osteoarthritis (5/9) complicated by a stress reaction in adjacent bone or concomitant soft-tissue pathologies (e.g., ganglion cyst), 18F-fluoride PET/MR was regarded as equal or superior to 18F-fluoride PET/CT.
A potential disadvantage of PET/MR is use in patients with bilateral complaints, as a simultaneous examination of both feet would lead to a tremendous loss of diagnostic quality for a PET/MR study (use of body vs. dedicated surface coils). Thus, because of the natural history of osteoarthritis in elderly people, 18F-fluoride PET/CT most likely would fulfil the diagnostic needs in patients older than 60 y with pain in both feet and without a history of trauma when primary osteoarthritis is more likely.
Compared with morphologic imaging alone, the specific value of hybrid 18F-fluoride PET/CT or PET/MR imaging consists in the possibility of quantitatively or semiquantitatively assessing tracer uptake. Various reports have described the value of 18F-fluoride in helping direct therapeutic management to the right regions because of the relation between the intensity of bone metabolism and the complaints of the patient (4,5). Especially in patients with multifocal disease, the maximum 18F-fluoride uptake can help the clinician tailor the therapy to the region of greatest clinical relevance or highest disease activity (e.g., the joint that is affected the most by osteoarthritis). A study of Fischer et al. showed that 18F-fluoride PET in addition to sequentially performed MR offered additional information allowing more specific therapy in 13 of 28 patients (4). Therefore, we hypothesize that the use of 18F-fluoride PET/MR can provide additional therapeutically relevant information in patients with foot pain of unclear cause. However, this has to be proven in prospective studies also evaluating the contribution of both MR and 18F-fluoride to the final diagnosis and the therapeutic management in a large patient cohort.
Our study had some limitations. We did not examine the potential influence when PET/CT and PET/MR were performed in random order. However, despite reports that 18F-FDG PET tends to show lower SUVs in benign lesions, such an effect is not known for 18F-fluoride (20). In addition, the rare number of studies comparing lesion-to-background ratio for 18F-fluoride and skeletal scintigraphy both at an early and at a later time point do not indicate a relevant influence (21). In addition, we have not specifically evaluated whether 18F-fluoride PET/MR or PET/CT leads to a difference in therapeutic management. However, because in many of our cases the final diagnosis was the same for both PET/MR and PET/CT, differing only in the diagnostic certainty, we would not expect a substantial difference.
CONCLUSION
Despite different attenuation techniques, 18F-fluoride PET/MR can be regarded as technically feasible and robust. In patients with foot pain of unclear cause, 18F-fluoride PET/MR provided more diagnostic information at a higher diagnostic certainty than did 18F-fluoride PET/CT. Besides providing information on bone metabolism, 18F-fluoride PET/MR provides additional diagnostically relevant findings from soft-tissue and bone marrow pathology, compared with PET/CT. A further advantage of 18F-fluoride PET/MR is the potential for additional dose reduction due to the longer acquisition time. Thus, larger prospective studies exploring the use of 18F-fluoride PET/MR are warranted in foot-pain patients for whom medical history, clinical examination, and radiographic examination remain inconclusive. These studies should also focus on the impact of this technique on patient management and cost-effectiveness.
DISCLOSURE
The costs of publication of this article were defrayed in part by the payment of page charges. Therefore, and solely to indicate this fact, this article is hereby marked “advertisement” in accordance with 18 USC section 1734. No potential conflict of interest relevant to this article was reported.
Footnotes
↵* Contributed equally to this work.
Published online Feb. 12, 2015.
- © 2015 by the Society of Nuclear Medicine and Molecular Imaging, Inc.
REFERENCES
- Received for publication October 29, 2014.
- Accepted for publication January 12, 2015.


