


Abstract
Brain tumor volume assessment is a major challenge. Molecular imaging using PET may be a promising option because it reflects the biologically active cells. We compared the agreement between PET- and histology-derived tumor volumes in an orthotopic glioblastoma rat model with a noninfiltrating (U87MG) and an infiltrating (T87) tumor phenotype using 2 different radiotracers, 2 different image reconstruction algorithms, parametric imaging, and 2 different image segmentation techniques. Methods: Rats with U87MG- and T87-derived glioblastomas were continuously scanned with PET for 1 h starting immediately after the injection of 11C-methylaminoisobutyric acid (11C-MeAIB). One hour later, 18F-FDG was injected, followed by a 3-h dynamic PET scan. Images were reconstructed using 2-dimensional ordered-subsets expectation maximization and 3-dimensional maximum a posteriori probability (MAP3D) algorithms. In addition, a parametric image, encompassing the entire tumor kinetics in a single image, was calculated on the basis of the 11C-MeAIB images. All reconstructed images were segmented by fixed thresholding of maximum voxel intensity (VImax) and mean background intensity. The agreement between PET- and histology-derived tumor volumes and intra- and interobserver agreement of the PET-derived volumes were evaluated using Bland–Altman plots. Results: By PET, the mean U87MG tumor volume was 35.0 mm3 using 18F-FDG and 34.1 mm3 with 11C-MeAIB, compared with 33.7 mm3 by histology. Corresponding T87 tumor volumes were 122.1 mm3 using 18F-FDG, 118.3 mm3 with 11C-MeAIB, and 125.4 mm3 by histology. None of these volumes were significantly different. The best agreement between PET- and histology-derived U87MG tumor volumes was achieved with 11C-MeAIB, MAP3D reconstruction, and fixed thresholding of VImax. The intra- and interobserver agreement was high using this method. For T87 tumors, the best agreement between PET- and histology-derived volumes was obtained using 18F-FDG, MAP3D reconstruction, and fixed thresholding of mean background intensity. The agreement using 11C-MeAIB, parametric imaging, and fixed thresholding of VImax was slightly inferior, but the intra- and interobserver agreement was clearly superior. Conclusion: Estimation of tumor volume by PET of noninfiltrating brain tumors was accurate and reproducible. In contrast, tumor volume estimation by PET of infiltrating brain tumors was difficult and hard to reproduce. On the basis of our results, PET evaluation of highly infiltrating brain tumors should be further developed.
In brain cancer research, tumor delineation and volume assessment are major challenges. In the clinic, high-grade gliomas such as glioblastoma multiforme (GBM) are delineated using contrast-enhanced MR imaging (1). This is based on contrast enhancement from leaky vessels (1), meaning that MR imaging does not reflect the biologically active tumor cells or, stated another way, the malignancy itself. Because molecular imaging with PET does just that, it is a promising modality, the usefulness of which we wanted to examine in an orthotopic GBM rat model.
18F-FDG is by far the most common tracer for PET imaging of cancers, including GBMs, but it may be suboptimal for GBMs: it is difficult to differentiate a hypermetabolic GBM lesion from cortical or subcortical gray matter using 18F-FDG (2) because of its relatively high uptake in both those tissues. Because 11C-methylaminoisobutyric acid (11C-MeAIB) (3), a metabolically stable alanine analog targeting the system A amino-acid transport system, has a very low uptake in normal brain tissue, it might prove superior to 18F-FDG for this purpose (4,5). On the other hand, with 18F-FDG in particular, the distinction between normal brain and tumor may be improved by delayed imaging (2).
Reliable tissue segmentation enabling tumor delineation is also demanding, and various approaches have been suggested (2,6). However, no generally accepted segmentation technique exists for preclinical or clinical brain tumor imaging. Hence, the aim of this study was to determine the agreement between PET- and histology-derived tumor volumes acquired using 2 radiotracers—18F-FDG and 11C-MeAIB—with delayed imaging, 2 reconstruction methods, parametric imaging, and 2 image segmentation techniques to find the best combination for tumor volume estimation.
MATERIALS AND METHODS
Tumor Xenograft Model
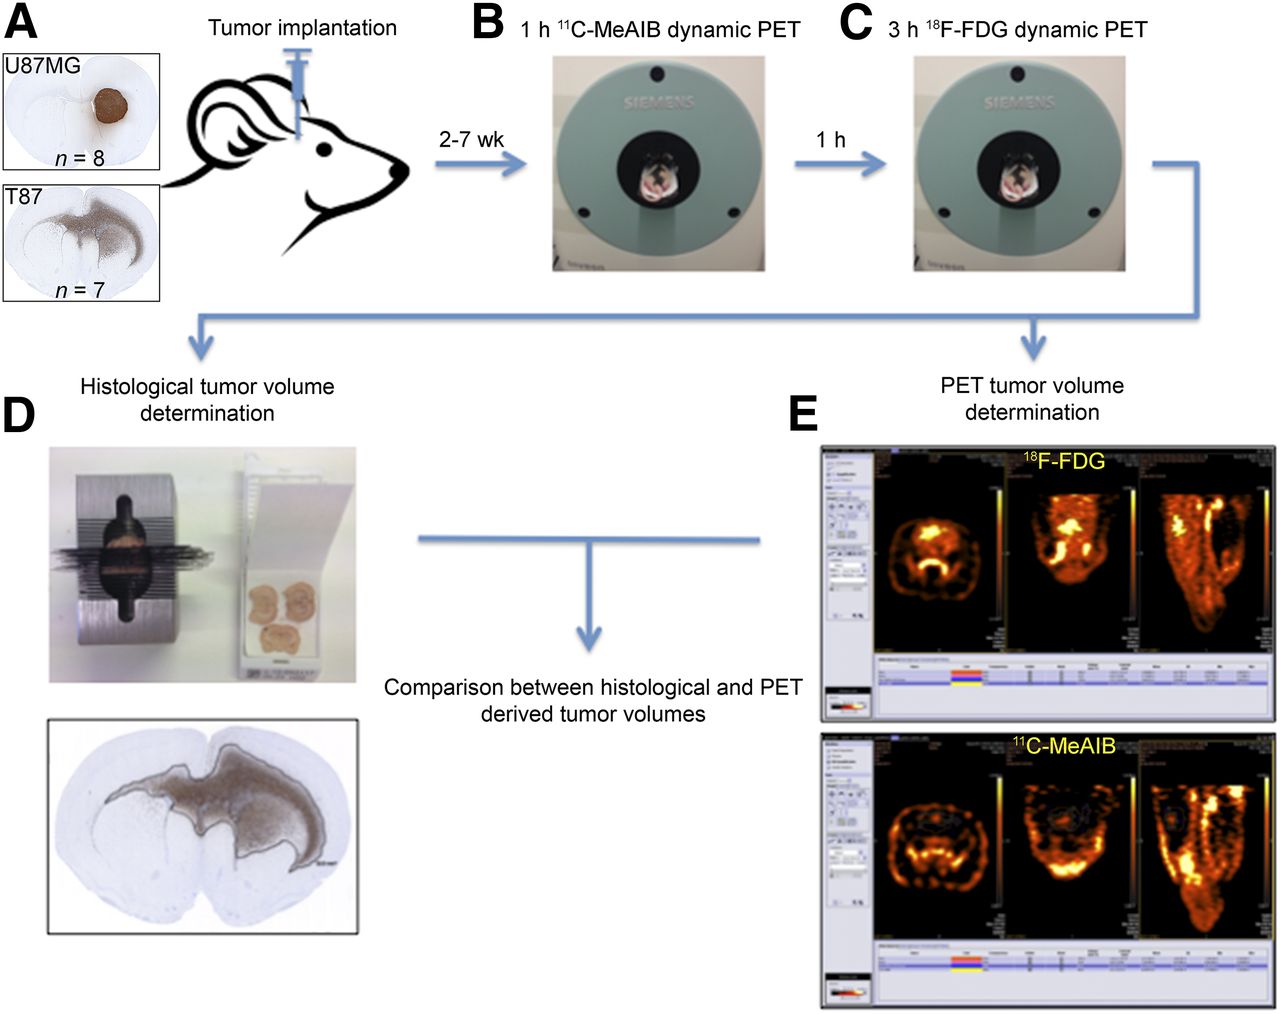
An overview of the study is depicted in Figure 1. We used a human GBM orthotopic xenograft model. Rats (n = 15) were implanted with 2 phenotypically different GBM cell lines: the commercially available and widely used U87MG (n = 8) cell line, which lacks the invasive phenotype seen in human GBMs (7), and a highly invasive GBM cell line from our own laboratory, annotated T87 (n = 7). U87MG cells were cultured as adherent cells in serum-containing medium (8), and T87 cells, as free-floating spheroids in serum-free medium (8). All animal procedures were approved by the Danish Animal Experiments Inspectorate (J. Nr. 2008/561-1572). Four- to 5-wk-old male athymic nude rats (Hsd:RH-Foxn1rnu; Harlan Laboratories) were anesthetized subcutaneously and placed in a small-animal stereotactic instrument. Through a burr hole placed 1 mm anteriorly and 2 mm laterally to the bregma, a 2-μL suspension of 300,000 single cells in Hanks balanced salt solution (Gibco) supplemented with 0.9% glucose (synapses of amphids defective, 500 mg/mL) was injected at a depth of 3.5 mm.

Study overview. (A) Rats were implanted with glioblastoma noninvasive U87MG or invasive T87 cell line. (B and C) Two to 7 wk later, pairs of rats were imaged with PET using 11C-MeAIB (B) and 18F-FDG (C). (D) Rats were then euthanized, and histologic brain tumor volume was determined. (E) From acquired 11C-MeAIB and 18F-FDG images, PET-derived tumor volumes were generated and compared with histology-derived volumes.
Radiochemistry
The preparation of good manufacturing practice–grade 11C-MeAIB (9) and 18F-FDG (10) was performed as previously described.
PET Image Acquisition
Rats were anesthetized with 1%–2% isoflurane (IsoFlo vet; Abbott). Two rats were scanned simultaneously nose-to-nose in the prone position on a water-heated bed using a small-animal PET scanner (Inveon Research Workplace; Siemens). Body temperature was monitored rectally and maintained at 37°C. Rats were kept fasting overnight. Initially, 65 MBq of 11C-MeAIB were injected via the tail vein, and the rats were scanned dynamically for 1 h. Then the rats were kept in situ on the bed for 1 h to allow for 11C decay before being injected with 50 MBq of 18F-FDG, followed by a dynamic 3-h PET scan. The scan length of 1 h for the 11C-MeAIB scan was chosen because of the rapid decay and an expected low residual activity at the end of acquisition. For 18F-FDG, with its 5.3 times longer half-life, we chose a 3-h acquisition period.
PET Image Analysis
The list mode files from the 3-h dynamic 18F-FDG PET scans were rebinned to sinograms with 22 frames (2 × 30 s, 2 × 60 s, 1 × 420 s, and 17 × 600 s), whereas the 1-h dynamic 11C-MeAIB PET scans were rebinned to sinograms with 10 frames (2 × 30 s, 2 × 60 s, 1 × 420 s, and 5 × 600 s). Reconstruction was done using both ordered-subset expectation maximization in 2 dimensions (OSEM2D) and maximum a posteriori in 3 dimensions (MAP3D) without scatter and attenuation correction in the Inveon Acquisition Workplace software module (Siemens). The image matrix was 256 × 256 × 159, resulting in a voxel size of 0.385 × 0.385 × 0.796 mm. Applying the OSEM2D-reconstructed images, time–activity curves were generated in the Inveon Research Workplace software module. Comparing the tumor-to-background (T/B) ratios of the different frames, the 2 consecutive frames (20 min) with the highest T/B ratios were identified. These were summed to obtain a static image that was used for the nonparametric tumor volume assessments. Moreover, because the course of the time–activity curves for 11C-MeAIB revealed a tumor and background pattern completely different from that obtained with 18F-FDG (Fig. 2), a parametric image was calculated to visualize the different kinetic behavior in a single image. The parametric image was generated by fitting the last 5 frames (5 × 600 s) with a linear function (A × T) + B in time T. The fitting parameters A and B were calculated voxel by voxel in a time-dependent manner using a nonlinear least-squares fit. The fitting algorithm was implemented in Interactive Data Language (version 6.4; Exelis) using the built-in fitting function CurveFit. The parametric image was formed by setting the voxels equal to the calculated slope a. Voxels below zero and voxels outside the rat were set to zero.
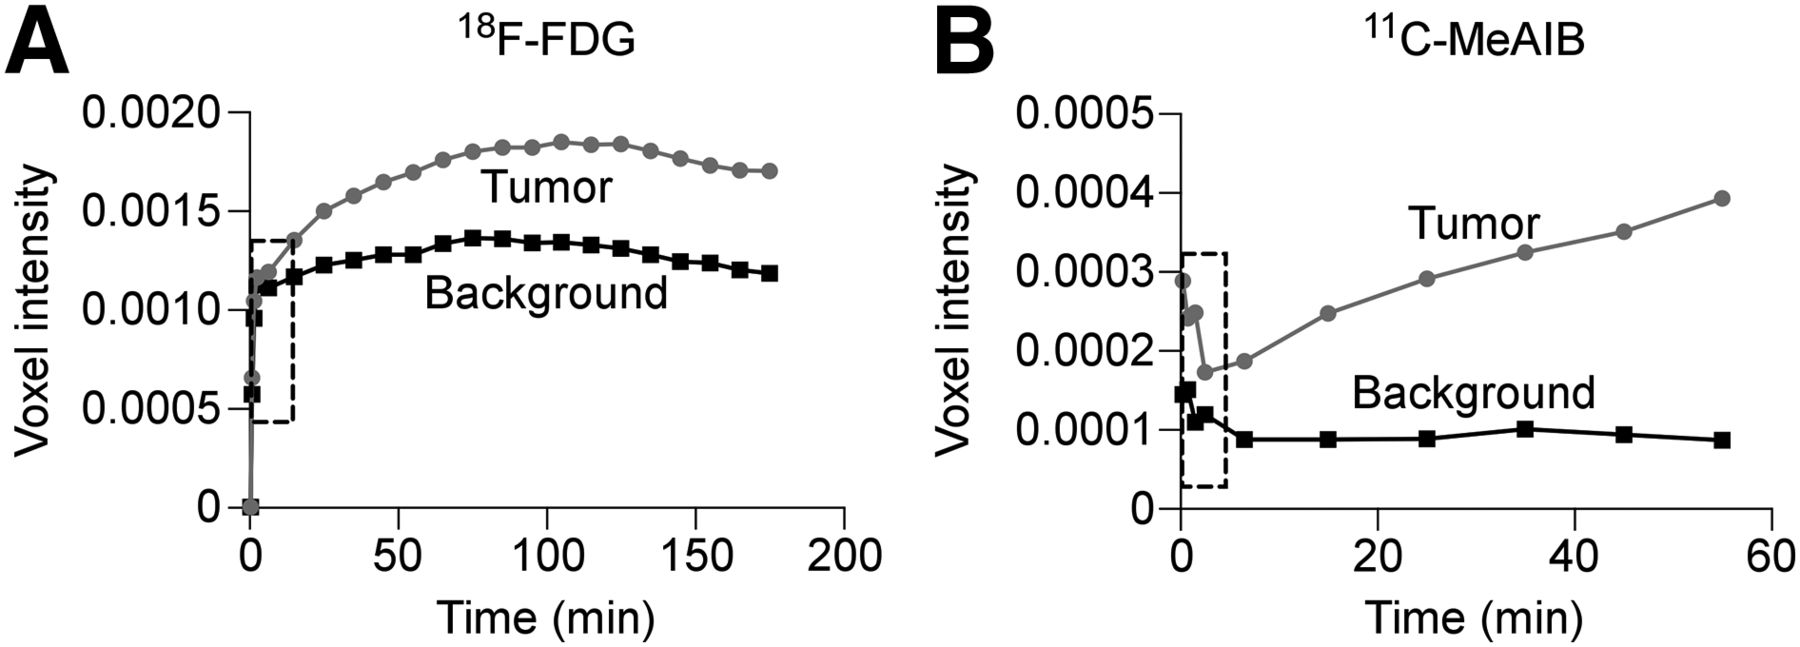
Representative 18F-FDG (A) and 11C-MeAIB (B) PET time–activity curves from T87 tumor-bearing rat.
On the OSEM2D- and MAP3D-reconstructed images and the parametric images, one volume of interest (VOI) was manually drawn covering the expected tumor boundaries (tVOI), and another was manually drawn in the contralateral hemisphere in a visually assessed non–tumor-infiltrated region (designated background VOI [bVOI]). Using these VOIs, image segmentation was performed using a range of fixed percentages of maximum voxel intensity (VImax) in the tVOI (e.g., 40%, 41%, and 42% of VImax) and a range of fixed thresholds based on the mean bVOI voxel intensity (mean background intensity, MBI) applied to the tVOI (e.g., any tVOI voxel > MBI × 1.25, 1.30, and 1.35).
Immunohistochemical Tumor Volume Assessment
After image acquisition, rats were euthanized and brains were fixed in 4% formaldehyde. Fixed brains were cut into 1-mm coronal slices and embedded in paraffin. Paraffin sections were immunohistochemically stained with an antihuman vimentin antibody (Nordic Biosite, 1 + 200) (7). Slides were scanned (NanoZoomer 2.0-HT slide scanner; Hamamatsu), and the tumor area (vimentin-stained area) was determined using the freehand area tool in NanoZoomer Digital Pathology (version 2.3.11; Hamamatsu). Tumor volume was calculated by summing the tumor areas from all the coronal slices.
Statistical Analysis
Data were expressed as mean ± SEM. For comparison of repeated measures, 2-way ANOVA with Bonferroni adjustment was used. Statistical significance was defined as a P value of less than 0.05. To test the agreement between PET- and histology-derived tumor volumes, the method described by Bland and Altman was used (11), including 95% limits of agreement (LOA). The LOA define the intervals within which we can be 95% confident that the respective measurements will lie considering their relative variability; hence, the narrowest LOA characterizes the method with the best agreement. In addition, the mean difference between the 2 measurements (bias) and the SD was calculated. To test intra- and interobserver agreement, Bland–Altman plots and correlation analyses with R2 values were used as well. Prism 6 software (GraphPad) was applied for all analyses.
RESULTS
PET- Versus Histology-Derived Tumor Volumes
Using the PET methods with the highest level of agreement, the mean U87MG PET-derived volumes were 35.0 mm3 (range, 5.3–81.1 mm3) by 18F-FDG and 34.1 mm3 (range, 12.0–80.6 mm3) by 11C-MeAIB (Fig. 3A), whereas the histology-derived tumor volume was 33.7 mm3 (range, 2.6–92.4 mm3) (Fig. 3A). The corresponding T87 mean volumes were 122.1 mm3 (range, 54.2–216.4 mm3), 118.3 mm3 (range, 37.9–167.5 mm3), and 125.4 mm3 (range, 37.3–182.0 mm3), respectively (Fig. 3B). None of the corresponding measures were significantly different.
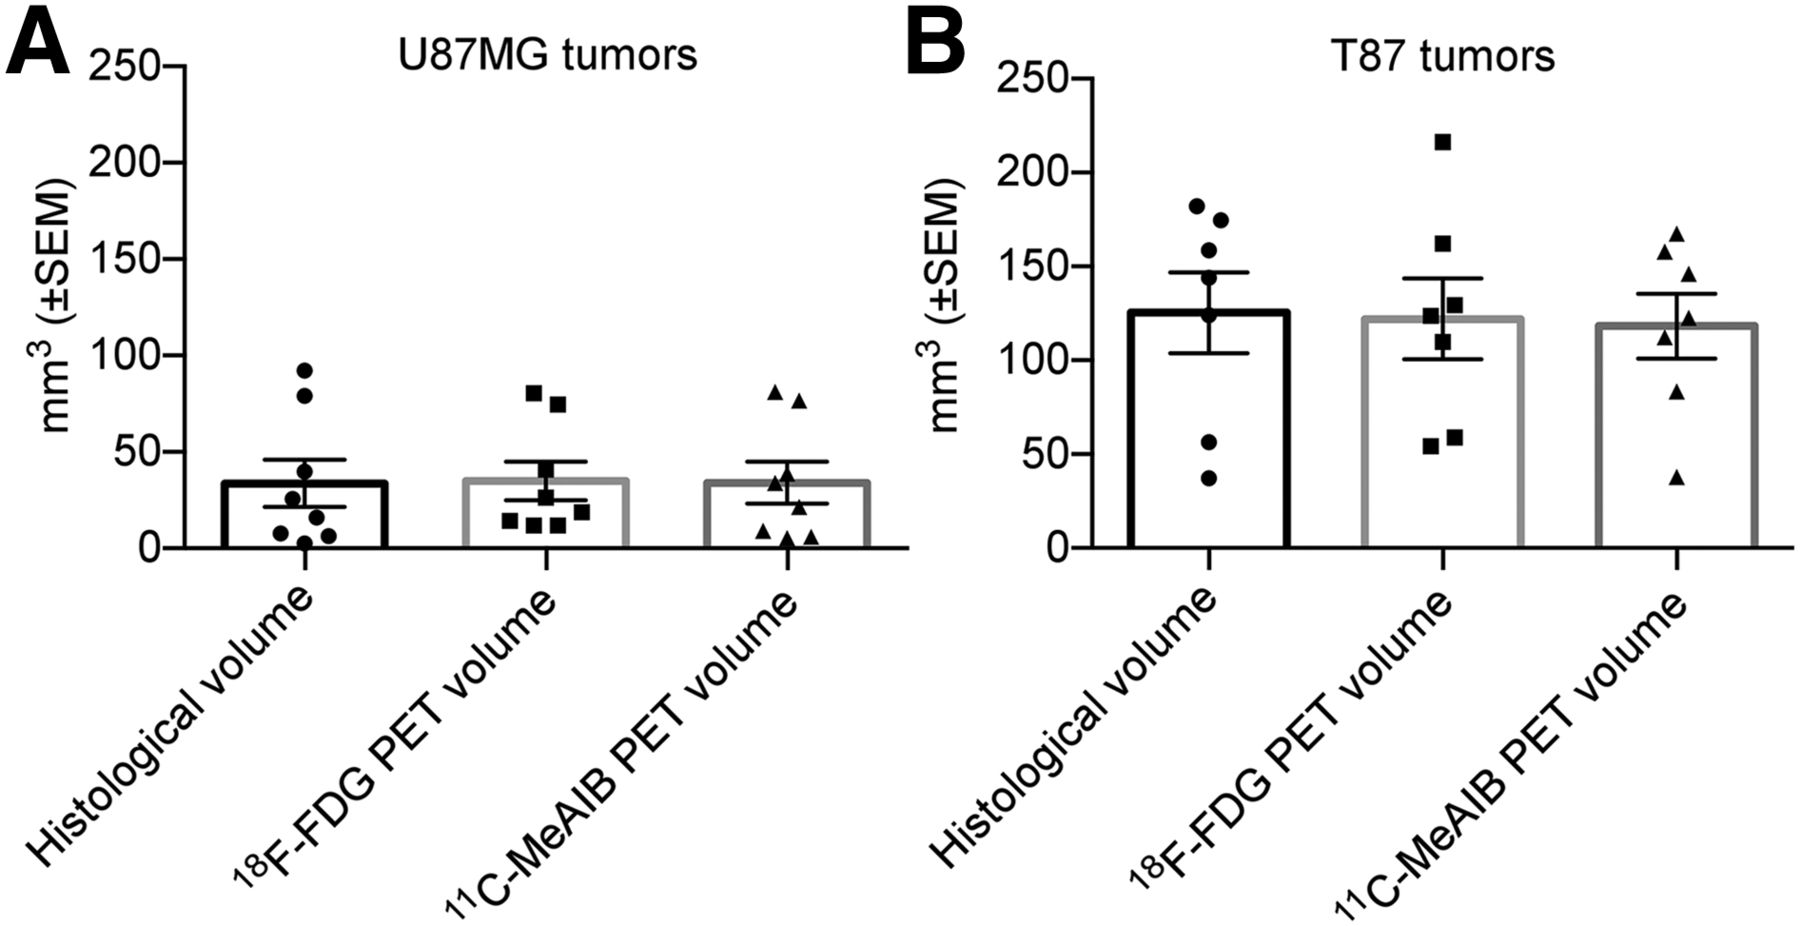
(A) Mean U87MG tumor volumes determined by 18F-FDG PET, OSEM2D, 49% of VImax; 11C-MeAIB PET, MAP3D, 49% of VImax; and histology. (B) Mean T87 tumor volumes determined by 18F-FDG PET, MAP3D, 1.35 × MBI; 11C-MeAIB PET, parametric imaging, 0.1% of VImax; and histology. No statistically significant differences were present.
T/B Ratio over Time
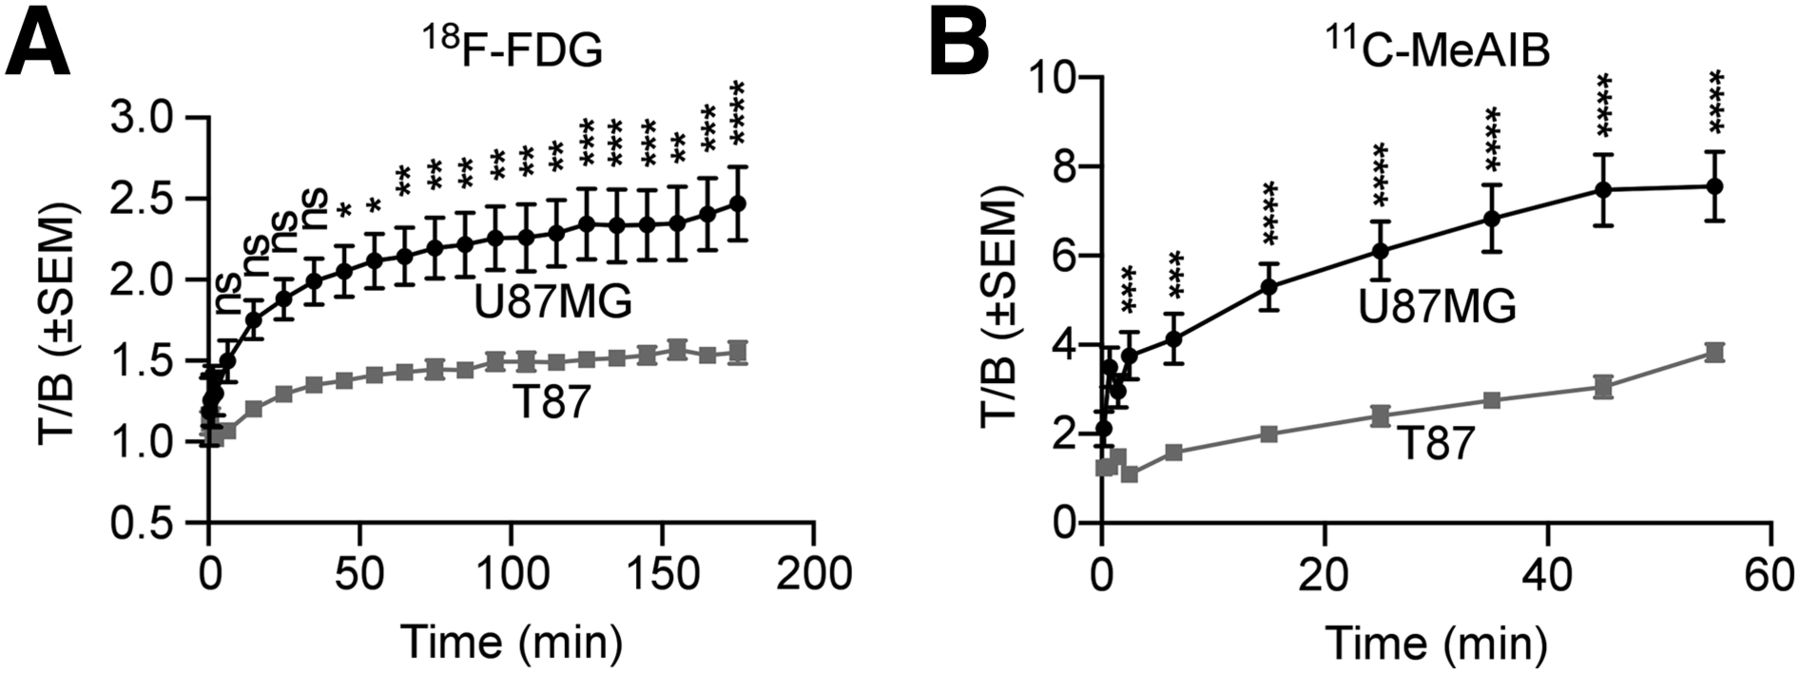
The 3-h dynamic 18F-FDG PET scans revealed that at the end of acquisition the mean T/B ratio reached a maximum of 2.5 (±0.2) for U87MG and 1.6 (±0.1) for T87 tumor-bearing rats (Fig. 4A). Likewise, the 1-h dynamic 11C-MeAIB PET scans revealed that at the end of acquisition the mean T/B ratio had reached a maximum of 7.6 (±0.8) for U87MG and 3.8 (±0.2) for T87 tumor-bearing rats (Fig. 4B).

Mean 18F-FDG (A) and 11C-MeAIB (B) T/B ratios as function of time.
PET Assessment of U87MG Tumor Volume
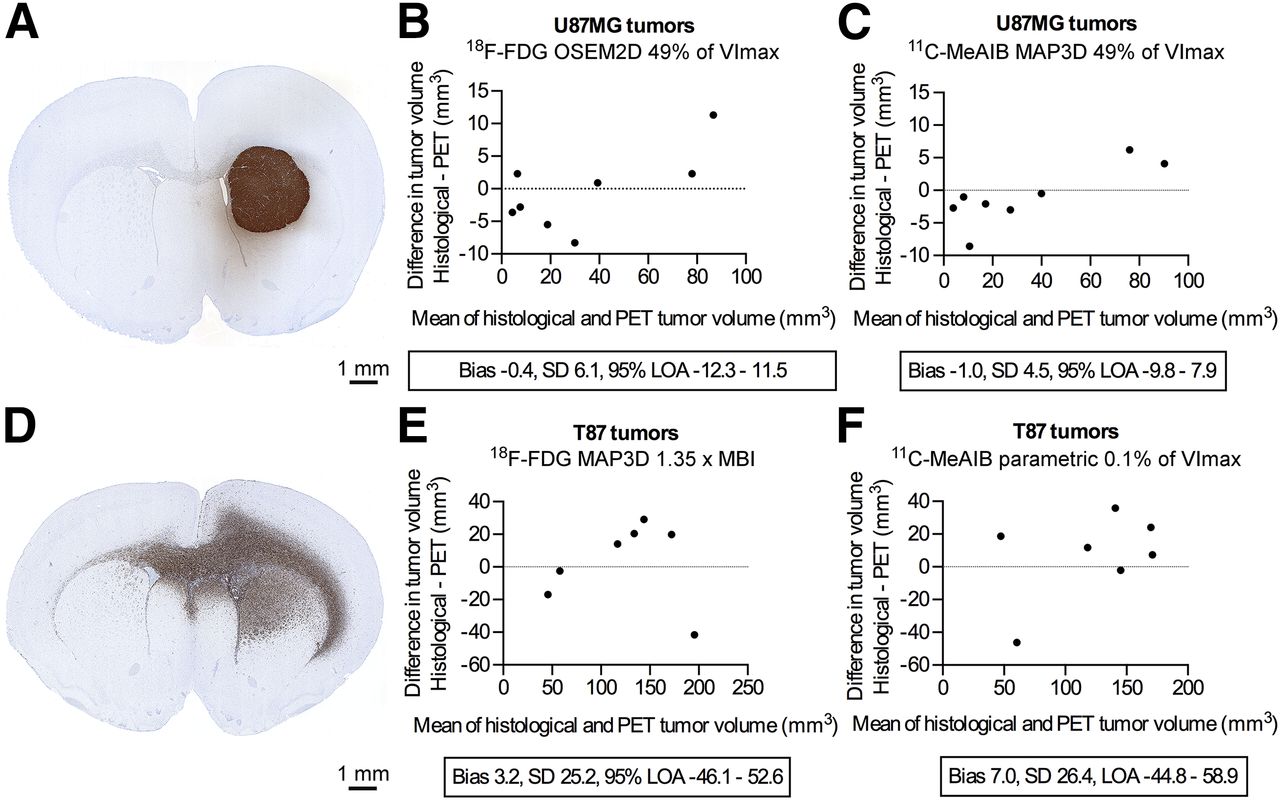
As expected, all U87MG tumors were noninfiltrating (Fig. 5A) and therefore easy to delineate histologically and on the PET images. With 18F-FDG, the best agreement was obtained using fixed thresholding of 49% of VImax on OSEM2D-reconstructed images (Fig. 5B, Table 1), although almost similar results were obtained with MAP3D and 55% of VImax (Table 1). The best overall U87MG tumor volume assessment was achieved with 11C-MeAIB, MAP3D reconstruction, and fixed thresholding using 49% of VImax (Fig. 5C, Table 1). In contrast, with OSEM2D, 44% of VImax, and parametric imaging, 39% of VImax were inferior (Table 1). Image segmentation using fixed thresholding of MBI was also inferior to fixed thresholding of VImax, regardless of radiotracer, reconstruction algorithm, or parametric imaging (Table 1).

Overview of PET methods with highest level of agreement between PET- and histology-derived tumor volumes. (A) Noninfiltrating U87MG tumor. (B and C) Bland–Altman plots of U87MG 18F-FDG (B) and 11C-MeAIB (C) PET-derived tumor volumes. (D) Infiltrating T87 tumor. (E and F) Bland–Altman plots of T87 18F-FDG (E) and 11C-MeAIB (F) PET-derived tumor volumes.
Agreement and Correlation Between PET- and Histology-Derived U87MG Tumor
PET Assessment of T87 Tumor Volume
The T87 tumors, in contrast to the U87MG tumors, were heavily infiltrating and irregular (Fig. 5D) and therefore more difficult to delineate histologically and by PET. The best agreement for T87 tumors was achieved with 18F-FDG, MAP3D reconstruction, and fixed thresholding of 1.35 × MBI (Fig. 5E; Table 2), although almost similar results were obtained with OSEM2D reconstruction and 1.2 × MBI (Table 2). Image segmentation of the 18F-FDG images using fixed thresholding of VImax was inferior to fixed thresholding of MBI regardless of the reconstruction algorithm (Table 2). The best agreement using 11C-MeAIB was obtained applying parametric imaging and fixed thresholding of 0.1% of VImax (Fig. 5F; Table 2). In comparison, fixed thresholding of 1.0 × MBI on the 11C-MeAIB parametric images was only marginally more inaccurate, whereas nonparametric images, regardless of image reconstruction and segmentation, were substantially more inaccurate (Table 2).
Agreement and Correlation Between PET- and Histology-Derived T87 Tumor Volumes
Intra- and Interobserver Variability
To test intraobserver agreement of both histology- and PET-derived tumor volumes, one observer performed measurements twice at least 3 wk apart. To test interobserver agreement, 2 observers performed the measurements separately. The PET results for U87MG tumors are depicted in Figure 6 and those for T87 tumors in Figure 7. As seen, the 11C-MeAIB measurements had a higher level of agreement than the 18F-FDG measurements regardless of tumor phenotype. The histologic intraobserver agreement was high for U87MG (95% LOA, −1.7 to 1.0; bias, 0.3; SD of bias, 0.7; R2, 0.998) and T87 (95% LOA, −16.0 to 14.4; bias, 0.8; SD of bias, 7.7; R2, 0.998) tumors. The interobserver agreement was equally high for U87MG (95% LOA, −1.8 to 2.3; bias, 0.3; SD of bias, 1.0; R2, 0.976) and T87 (95% LOA, −6.1 to 9.6; bias, 1.7; SD of bias, 4.0; R2, 0.992) tumors.
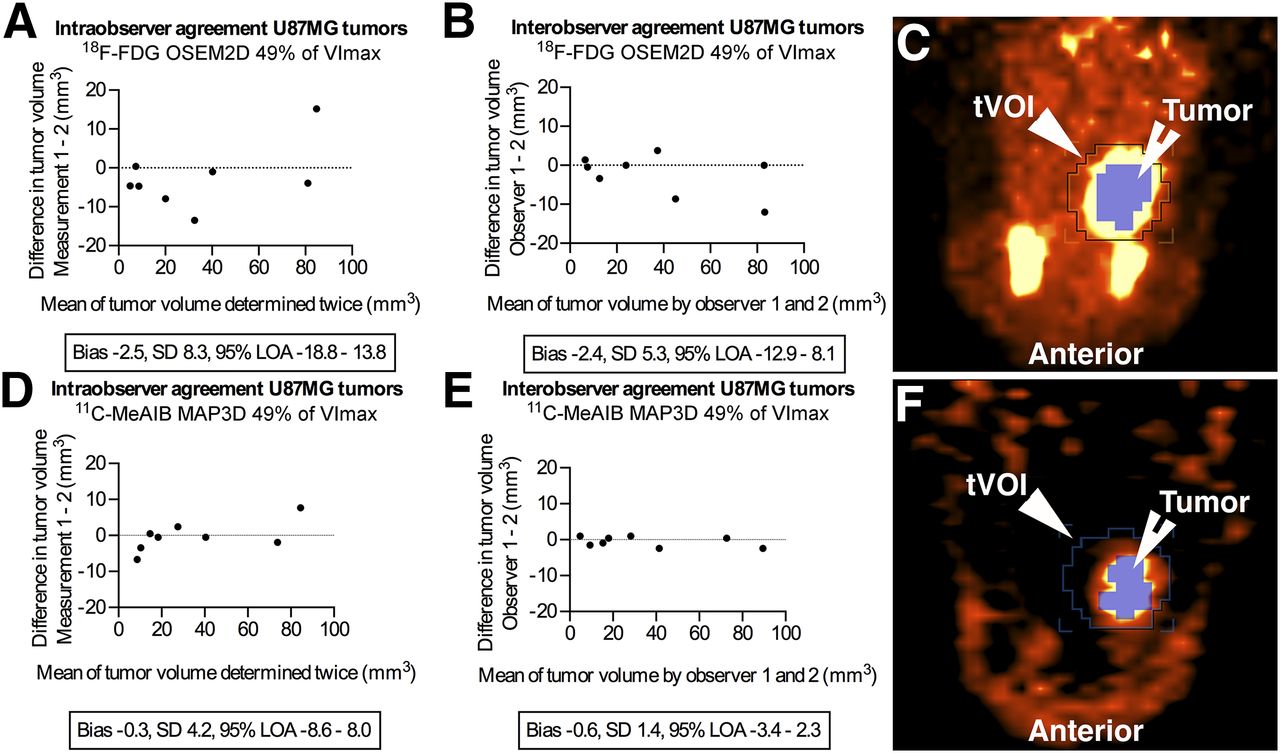
U87MG Bland–Altman plots of 18F-FDG intraobserver (A) and interobserver (B) and 11C-MeAIB intraobserver (D) and interobserver (E) agreement. (C and F) Representative corresponding PET image segmentation images, axial view.

T87 Bland–Altman plots of 18F-FDG intraobserver (A) and interobserver (B) and 11C-MeAIB intraobserver (D) and interobserver (E) agreement. (C and F) Representative corresponding PET image segmentation pictures, axial view.
DISCUSSION
In this study, histology- and PET-derived tumor volumes of 2 phenotypically distinct and different brain tumor types in an orthotopic GBM rat model were compared. Two different radiotracers—the widely used 18F-FDG reflecting the metabolic rate and the amino-acid tracer 11C-MeAIB reflecting the rate of the system A amino-acid transport—were tested. PET images were reconstructed with OSEM2D and MAP3D algorithms, and a parametric image of the 11C-MeAIB MAP3D-reconstructed images was calculated. Image segmentation was performed with fixed thresholding of VImax and MBI. Our aim was to identify the best combination to determine tumor volume by PET.
As reference, histology-derived tumor volumes were used, although doing so presents some inherent limitations. On formaldehyde fixation, the tissue is known to shrink approximately 10%. Assuming that this was the case for all the tumor specimens, the shrinkage ought not to have affected histologic reference volumes after PET scanning, because these presumably were smaller than the tumors were in situ. Moreover, histologic tumor volume was determined manually and was therefore potentially prone to variability. However, when tested, this variability was very small, with narrow 95% LOAs and high R2 values.
All scans were performed as dynamic scans to extract time–activity data. From this, the optimal 20-min scan interval, defined as the interval with the highest T/B ratio, was identified. Previous data on 18F-FDG have shown that extending the time from injection of tracer to acquisition of scan—so-called delayed imaging—improves the T/B ratio (2). Our data support this, in particular for 11C-MeAIB (Figs. 2 and 4). However, it is important to note that the SEM of the T/B ratio increased also (Fig. 4) because of the declining number of annihilations taking place due to radioactive decay. Dynamic time–activity data for 11C-MeAIB have not been previously reported. Interestingly, one study based on autoradiography and using the related, but less specific, tracer α-aminoisobutyric acid in rats with induced subcortical rat gliomas reported T/B ratios of 1.8–6.8 (12). In our study, T/B ratio in the U87MG tumors was 7.6 and in the T87 tumors was 3.8. The reason for this twofold difference is probably the pronounced difference in tumor composition. The U87MG tumors are very dense and consist almost exclusively of tumor cells in contrast to the highly infiltrating T87 tumors that, to a certain extent, like the GBMs seen in humans, are composed of both tumor cells and brain parenchyma. The latter cell composition obviously decreases the T/B ratio, because 11C-MeAIB is hardly taken up by brain parenchyma (Fig. 2B). In summary, our time–activity data support the use of delayed imaging in that it increased the contrast between tumor and the surrounding brain parenchyma. Because no real plateau phase was seen in the 11C-MeAIB time–activity data (Fig. 4), we cannot exclude that further delay in imaging would increase the T/B ratio even more, but at the expense of an increase in statistical noise.
From the 11C-MeAIB time–activity data, a notable difference in tumor and background voxel intensities was observed. After the initial vascular blood flow phase, the tumor tissue showed an almost linearly increasing tracer uptake, whereas normal brain tissue (background) exhibited a minimal uptake throughout (Fig. 2B). Therefore, a parametric image based on the last five 10-min frames was calculated. The derived parametric image represents the kinetic behavior of each single voxel in just one image; in principle, it has the same properties as dual-time-point imaging (13) but with a better statistical behavior because more frames are used in the calculations. In the noninfiltrating U87MG tumors, the agreement between histologically and parametrically derived tumor volumes was inferior to that of standard static PET images (Table 1). In the infiltrating T87 tumors, parametric and standard static PET imaging performed almost equally well (Table 2); but when observer agreement was taken into account (Fig. 7), parametric imaging was optimal for T87 tumors. The best threshold values for the parametric images were remarkably low (0.1% of SUVmax and 1.0 × MBI, Table 2). The latter indicates that some areas of the tumors did not take up enough 11C-MeAIB over time to produce a significant increase in voxel intensity and therefore did not appear on the parametric images. These tumor areas seemed to be the peripheral parts of the tumors when we compared parametric and standard static images. In addition, the parametric imaging technique required long dynamic scans (1 h), and the postprocessing was time-consuming. These factors make this approach less feasible for routine use in a preclinical—and particularly in a clinical—setting, and calls for more automated processing.
We tested 2 different reconstruction algorithms because previous data indicated that MAP3D reconstruction yields superior spatial resolution in the entire field of view compared with OSEM2D (14). Because we scanned 2 animals simultaneously, their heads were not located in the center of the field of view; therefore, MAP3D should a priori be superior in our specific setup. However, as seen from the results in Tables 1 and 2, MAP3D was not consistently superior to OSEM2D reconstruction.
To segment the PET images we applied thresholding, which is just one of the at least 4 broad image segmentation techniques: thresholding (15), variational (16), learning method (17), and stochastic modeling (18). All of these segmentation techniques have pros and cons (6). We chose the thresholding technique because, along with visual delineation performed by experts (19), it is the most frequently used technique (6). Fixed thresholding of VImax and MBI was applied. Two confounding factors using these techniques are variations in tumor size (20) and tumor inhomogeneity (21), both of which may influence the optimal thresholding value (22). Whether any of the more advanced, but less frequently used, segmentation techniques would have improved our results remains unanswered; this issue would be of interest to address in a future study.
From the histologic tumor volume data, the U87MG tumors were clearly smaller than the T87 tumors. The reason for this was that rats were euthanized when tumors were depicted on PET, which happened earlier with the noninfiltrating U87MG tumors than with the infiltrating T87 tumors. On the basis of the small size of some of the U87MG tumors, we would expect partial-volume effects to affect their PET measurements. Because partial-volume effects will make small tumors appear larger (23), we would expect a volume overestimation of the smaller tumors in the Bland–Altman plots. In fact, this was the case in tumors smaller than 40 mm3, because 5 of 7 with 18F-FDG and 7 of 7 with 11C-MeAIB were indeed estimated to be larger than their histologic counterparts (Fig. 5). Still, the overall volume estimation of the U87MG tumors (Figs. 5B and 5C) and the observer agreement (Fig. 6) were good with narrow LOAs. The best combination was 11C-MeAIB imaging reconstructed by MAP3D and image segmentation by fixed thresholding of VImax. Surprisingly, the intraobserver agreement was a little lower than the interobserver agreement (Fig. 6), albeit without an obvious explanation.
Delineating the T87 tumors proved difficult, as expected, because both the 18F-FDG and the 11C-MeAIB scans yielded very wide 95% LOAs regardless of reconstruction algorithm and image segmentation (Table 2). As already described, the better combination, when including both volume estimation (Fig. 5F) and observer agreement (Figs. 7C and 7D), was 11C-MeAIB parametric imaging with fixed thresholding of VImax. The LOA for this combination was −44.8 to 58.9 mm3 for tumors with a median volume of 144 mm3—that is, an approximate deviation of plus or minus 30%—which is hardly acceptable. To our knowledge, comparable studies of histology- and PET-derived brain tumor volume do not exist, but studies comparing MR imaging– and histology-determined brain tumor volumes do. In one study with a mouse brain tumor model, the correlation between MR imaging– and histology-derived tumor volumes showed an R2 value of 0.85 (24). In another, a syngeneic rat glioma model was used, and an R2 value of 0.76 was obtained (25). The respective R2 values in our study were, for U87MG tumors, 0.98 with 18F-FDG and 0.99 with 11C-MeAIB, whereas for T87 tumors, the corresponding values were 0.81 and 0.79, respectively. Based on these correlation analyses, PET determination of tumor volumes seems comparable to or even better than MR imaging–based tumor volume assessment. To address this thoroughly, a head-to-head comparison is needed.
Taken together, our T87 results obtained in a relatively small number of animals indicated that 11C-MeAIB was superior to 18F-FDG when considering both volume and observer agreement. This result can be explained in part by the superior tumor-specific uptake of 11C-MeAIB (4) compared with 18F-FDG, which is known to be taken up in different areas of the normal brain, including the cortex, the basal ganglia, and the thalamus (26). This advantage underlines the potential value of tumor-specific amino acid tracers such as 11C-MeAIB for the future imaging of brain tumors.
For neurosurgeons and radiation oncologists, it is critical to have borders of GBMs delineated before tumor resection or radiation; our results do not support the use of PET for this purpose. But for the neurooncologist, molecular changes on the cellular level, which normally precede the MR imaging–detected structural changes (27), might be an optimal determinant of early treatment response. Potentially, this ability could minimize the times at which individual patients receive ineffective and often toxic treatment. Future studies using clinically relevant orthotopic models such as the model used in our study, as well as clinical studies in patients, need to be performed to address this aspect.
CONCLUSION
Volume estimation of noninfiltrating brain tumors by means of 11C-MeAIB PET is accurate and reproducible. In contrast, tumor volume estimation by PET of highly infiltrating brain tumors is difficult and hard to reproduce. In the future, PET evaluation of highly infiltrating primary brain tumors should be further developed.
DISCLOSURE
This research was supported by grants from Odense University Hospital, Region of Southern Denmark; Familien Erichsens Foundation; and Ekspeditionssekretær, Cand. Jur. Torkil Steenbecks Legat. The bioimaging experiments reported in this paper were performed at DaMBIC, a bioimaging research core facility at the University of Southern Denmark. DaMBIC was established by an equipment grant from the Danish Agency for Science Technology and Innovation and by internal funding from the University of Southern Denmark. No other potential conflict of interest relevant to this article was reported.
Acknowledgments
We thank Christina Baun, Department of Nuclear Medicine, Odense University Hospital, and Helle Wohlleben and Tanja D. Højgaard, Department of Pathology, Odense University Hospital, for their technical assistance. We also thank Kjell Någren, Department of Nuclear Medicine, Odense University Hospital, for sharing his knowledge of 11C-MeAIB with us.
Footnotes
Published online Jul. 30, 2015.
- © 2015 by the Society of Nuclear Medicine and Molecular Imaging, Inc.
REFERENCES
- Received for publication June 20, 2015.
- Accepted for publication July 9, 2015.


Jump to section
Related Articles
Cited By...
- No citing articles found.