


Abstract
A novel radioguided surgery (RGS) technique exploiting β− radiation has been proposed. To develop such a technique, a suitable radiotracer able to deliver a β− emitter to the tumor has to be identified. A first candidate is represented by 90Y-labeled DOTATOC, a compound commonly used today for peptide radioreceptor therapy. The application of this β− RGS to neuroendocrine tumors (NET) requires study of the uptake of DOTATOC and its time evolution both in tumors and in healthy organs and evaluation of the corresponding performance of the technique. Methods: Uptake by lesions and healthy organs (kidneys, spleen, liver and healthy muscle) was estimated on 177Lu-DOTATOC SPECT/CT scans of 15 patients affected by NET with different localizations, treated at IRCCS–Arcispedale Santa Maria Nuova, Reggio Emilia, Italy. For each patient, SPECT/CT images, acquired at 0.5, 4, 20, 40, and 70 h after injection, were studied. For each lesion, the tumor-to-nontumor ratio (TNR) with respect to all healthy organs and its time evolution were studied. A subset of patients showing hepatic lesions was selected, and the TNR with respect to the nearby healthy tissue was calculated. By means of a Monte Carlo simulation of the probe for β− RGS, the activity that is to be administered for a successful detection was estimated lesion-by-lesion. Results: Uptake of DOTATOC on NETs maximized at about 24 h after injection. The cases of hepatic lesions showed a TNR with respect to the tumor margins compatible with the application of β− RGS. In particular, 0.1-mL residuals are expected to be detectable within 1 s with 5% false-negative and 1% false-positive by administering the patient as little as 1 MBq/kg. Conclusion: The balance between tumor uptake and metabolic washout in healthy tissue causes the TNR to increase with time, reaching its maximum after 24 h, and this characteristic can be exploited when a radiotracer with a long half-life, such as 90Y, is used. In particular, if 90Y-DOTATOC is used with liver NET metastases, the proposed RGS technique is believed to be feasible by injecting an activity that is one third of that commonly used for PET imaging.
Radioguided surgery (RGS) helps the surgeon resect a tumor as completely as possible while minimizing the amount of healthy tissue removed (1). Before surgery, the patient is given a radiolabeled tracer that is preferentially taken up by the tumor, and a probe (2) sensitive to the signal emitted by the tracer is used to identify in real time the position of the targeted tumoral cells. As a result, RGS provides the surgeon with real-time information about the location and extent of the lesion, as well as identifying the tumor margins.
To date, established methods make use of a γ-emitting tracer and a γ radiation–detecting probe (3,4). Since γ radiation can traverse large amounts of tissue, any uptake in nearby healthy tissue represents a nonnegligible background, strongly limiting and often preventing the use of this technique.
To overcome these limits and extend the applicability range of RGS, it was suggested (5) that pure β−-emitting radioisotopes be used instead. β− radiation is characterized by a penetration of only a few millimeters of tissue with essentially no γ contamination, since the bremsstrahlung contribution, which has a 0.1% emission probability above 100 keV, can be considered negligible. This novel approach allows the development of a handy and compact probe that, by detecting electrons and operating with a low radiation background, more clearly delineates the margins of lesioned tissues. Thus, the amount of injected activity required to detect tumor residuals is smaller than that for traditional RGS approaches. By implication, the radiation exposure of the medical personnel becomes almost negligible (5).
However, tracers capable of delivering pure β−-emitting radionuclides are needed to make this novel technique applicable. Among the existing tracers, those used for molecular radiotherapy, in particular peptide receptor radionuclide therapy with 90Y, are the first candidates. It has been demonstrated that 90Y-DOTATOC is capable of detecting meningioma and glioma with sufficient accuracy to perform β− RGS (6).
This study investigated the feasibility of this technique in the case of neuroendocrine tumors (NETs), which are widely known to show high uptake of DOTATOC (7). Interest in this clinical field has already been demonstrated by previous studies on the use of RGS with octreotide labeled with the γ-emitting 111In in gastroenteropancreatic (8), lung (9), and breast cancer (10) and in nonmalignant cells surrounding neoplastic tissues (11).
This paper reports our assessment of the potentiality of RGS with 90Y-DOTATOC in NETs: evaluation of the tumor-to-nontumor ratio (TNR) and the kinetics in lesioned and healthy tissues.
MATERIALS AND METHODS
Patient Selection
Fifteen patients with NETs (either primary or secondary) were selected. They underwent peptide receptor radionuclide therapy at the IRCCS–Arcispedale Santa Maria Nuova, Reggio Emilia, Italy. After therapeutic administration of 177Lu-labeled peptides with renal protection, all patients underwent a series of SPECT/CT scans of the abdomen, at about 0.5, 4, 20, 40, and 70 h after injection. For all patients but two, 2 lesions were considered. All patients gave written informed consent to participate in the clinical research in accordance with experimental trials (EUDRACT Nr. 2006-000897-65) approved by the Ethics Committee (institutional review board). The patient characteristics are summarized in Table 1: patient weight, total administered activity, the location of the lesions, their standardized uptake value (SUV), and, only in the case of liver lesions, TNR (AMAX/A0) as defined in “Expected Performance of RGS with β− Decay” 24 h after injection.
Patient Characteristics
Estimate of DOTATOC Uptake
177Lu-DOTATOC uptake by NETs and healthy organs was extracted from 177Lu-DOTATOC SPECT scans and was assumed to be a good estimate of 90Y-DOTATOC uptake: this is valid under the hypothesis that lutetium and yttrium are chemically similar enough not to alter the kinetics of the tracer. Since this paper concentrates on the interplay between the biologic and the physical half-lives (t1/2), we will account for the difference in t1/2 between the 2 radioisotopes.
Patient acquisitions were performed on a Symbia T2 SPECT/CT scanner (Siemens Medical Solutions) with the following characteristics: 3/8-in NaI(Tl) detector; medium-energy high-resolution collimators; 128 × 128 matrix; zoom of 1; 32 × 2 views; 30 s/view; step-and-shoot mode; 180° rotation; noncircular orbit; and 180° detector configuration. The energy windows were centered over the 177Lu photon peaks (208 and 113 keV, 15% width). The SPECT projections were reconstructed by an iterative algorithm (3-dimensional fast low-angle shot: 10 iterations; 8 subsets; gaussian filter cutoff of 4.8 mm; 4.8-mm cubic voxel for body protocol) with compensations for attenuation from CT images, scatter, and full collimator and detector response in the E-Soft workstation (SYNGO MI Applications, version 32B; Siemens Medical Solutions).
Two different analyses were performed on the DICOM images to study the time evolution of the TNR of NETs and the performance of RGS on liver lesions. In the first case, we needed to be confident that tumor and healthy cells have significantly different uptake and that therefore only the bulk of the lesions and distant healthy tissue needed to be considered. In the second case, an estimate of the signal from a realistic tumor margin and from nearby healthy tissues was needed.
Time Evolution Study
The analysis was performed by the SYNGO software. In particular, the 3-dimensional isocontour tool was used to define volumes of interest (VOIs): an oval was drawn onto the slice exhibiting the strongest signal and all voxels with counts greater than 50% of the maximum were included in the VOI. This procedure was used to create VOIs for lesions, liver, spleen, kidneys, and healthy muscle (Fig. 1). The latter was selected in an assuredly inactive area, typically behind the vertebral column. All VOIs had a similar volume of a few milliliters. Examples of VOIs in tumors and healthy organs are shown in Figure 1.

Example of VOIs defined on 1 patient for 2 lesions (red and blue, VOI1 and VOI3), healthy liver (violet, VOI5), kidney (green, VOI8), and muscle (yellow, VOI10).
For each VOI, the total volume (V), the mean value (μ), and the SD (σ) of the counts were calculated. Knowing the volume of the single voxel (Vv), the number of voxels in the VOI was estimated as  , and thus the error on the mean value was calculated as
  .
.
RGS Feasibility Study
To evaluate the feasibility of the proposed RGS in hepatic NETs, the specific activity of the tumor margins needs to be compared with background from nearby healthy tissue. The algorithm described above does not work in this context.
To this aim, therefore, the profile of the counts along a line crossing each lesion was extracted with ImageJ (version 1.47) software (Fig. 2). From these profiles the maximum uptake of the lesion (μMAX) and the uptake of a region close to the lesion but clearly separated from it (the “near background,” or μ0) were estimated.

Example of ImageJ profile used to determine tumor uptake and near-background uptake needed to evaluate expected performance of RGS technique in NETs. The 2 vertical lines correspond to μMAX (violet) and μ0 (green).
Conversion from Counts to Specific Activity
The procedures described so far yield the mean SPECT counts per voxel (μ) during a scan, Tscan, that lasts 1,920 s and starts after a time  has elapsed since injection. To evaluate the performance of the probe for the RGS technique, SPECT counts need to be converted to specific activities.
To this aim, with a dedicated calibration we determined the conversion factor to be k = 11 cps/MBq. Given the procedure adopted in this study to build VOIs, we decided to neglect the so-called partial-volume effect. Since the tumor VOIs are the smallest, this is in any case a conservative choice.
Finally, the specific activity of a VOI before corrections (Araw) is estimated as Eq. 1where the voxel volume, VVoxel, is (4.8 × 4.8 × 4.8)mm3 = 0.11 mL.
To estimate the activity of 90Y expected at the time of the surgical intervention, we accounted for the time elapsed since injection ( ); the time that, as will be shown later, is supposed to elapse before surgery (
 , 24 h); and the half-life difference between 177Lu (
 , 162 h), used in the SPECT scans, and 90Y (
 , 64 h), used for the RGS:
 Eq. 2With this correction, A is an estimate of the specific activity of the VOI under consideration at the hypothetical time of the surgery performed with the RGS with 90Y.
Evaluation of SUV and TNR
We estimate the SUV as Eq. 3where
  is the administered activity per unit weight of the patient and ρ = 1 g/cm3 is a reference density introduced to make the SUV nondimensional.
Also, to compare uptake between the tumor and different organs, the TNR is estimated as the ratio of the specific activities of interest.
The β− Probe
A critical element in the development of the proposed RGS method is the design of the β− probe, which exploits the low penetration power of β− radiation by reducing the size of the lateral shielding. Furthermore, we found that we could minimize the sensitivity to γ radiation using an organic scintillator with low density but high light yield, the p-terphenyl (12). The prototype used as the reference in this study has a sensitive cylinder of p-terphenyl with a radius of 2.55 mm and a 3-mm depth. To maximize the accuracy of the direction of the incoming radiation, the sensitive region is screened by 3 mm of polyvinyl chloride. The scintillation light is transported to a photomultiplier tube (Hamamatsu H10721-210 in the prototype) through 4 optical fibers. The dependence of the response on temperature or other environmental parameters is negligible in the expected operational conditions.
The β− Probe Simulation
To evaluate the effectiveness of the RGS technique, the estimated specific activities need to be translated in the corresponding probe rates ν. To this aim, we performed a full simulation, including all interactions of particles with matter, with the FLUKA (13,14) Monte Carlo software. In this simulation the background was represented by an extended region with a specific activity  of 90Y, whereas the tumor residual used as a benchmark is a cylinder with a radius of 3 mm and a height of 3.5 mm, for a total volume of 0.1 mL. These are indeed the dimension of a typical residual that has to be identified by the probe. The tumor region is assumed to have a specific activity μref of 90Y.
To this aim, the conversion factor between the deposited energy and the electronic signal issued by the probe was determined in laboratory tests with a pointlike source of 90Sr of known activity, which decays into 90Y with t1/2 = 29 y. When the estimated electronic signal overcomes a threshold determined in the same laboratory tests, the probe is considered to have issued a count.
RESULTS
From the measurement of counts in several NET focal spots and healthy organs at several times from injection, we could extract a host of information on the time dependence of the TNR, the comparison between different NETs, and the potentiality of the proposed RGS technique.
Time Dependence of TNR
The first goal of this study was to follow uptake by the tumors and healthy tissues over time to optimize the time required between injection and surgery and minimize the activity that needs to be injected. We first looked at the time evolution of the SUV in the tumors and healthy organs. Regarding this aspect, the SUV has the advantage of correcting for radioisotope decay, thus showing only biologic information. All the patients exhibited saturation in the lesions after 24 h, as shown in Figure 3 for a sample patient. In healthy tissues there is instead a biologic washout, although some show an initial increase of uptake (accumulation) and some do not.

SUV as function of time after injection in lesions and healthy organs of patient 1.
Figure 4 shows the activity of tumors and healthy tissues as a function of time after injection for all patients in the sample, having normalized the first points to the same value to compare the relative trends. Most of the lesions exhibit an increase as a function of time, whereas almost all the VOIs in the liver show a constant decrease and almost all the VOIs in the spleen show an initial accumulation before washout. VOIs in the kidneys, as already noted (15), can either present accumulation or not, depending on the patient.

Time dependence of SUV for all lesions and healthy tissues considered. To allow comparisons between patients, values are normalized to t = 0 measurements.
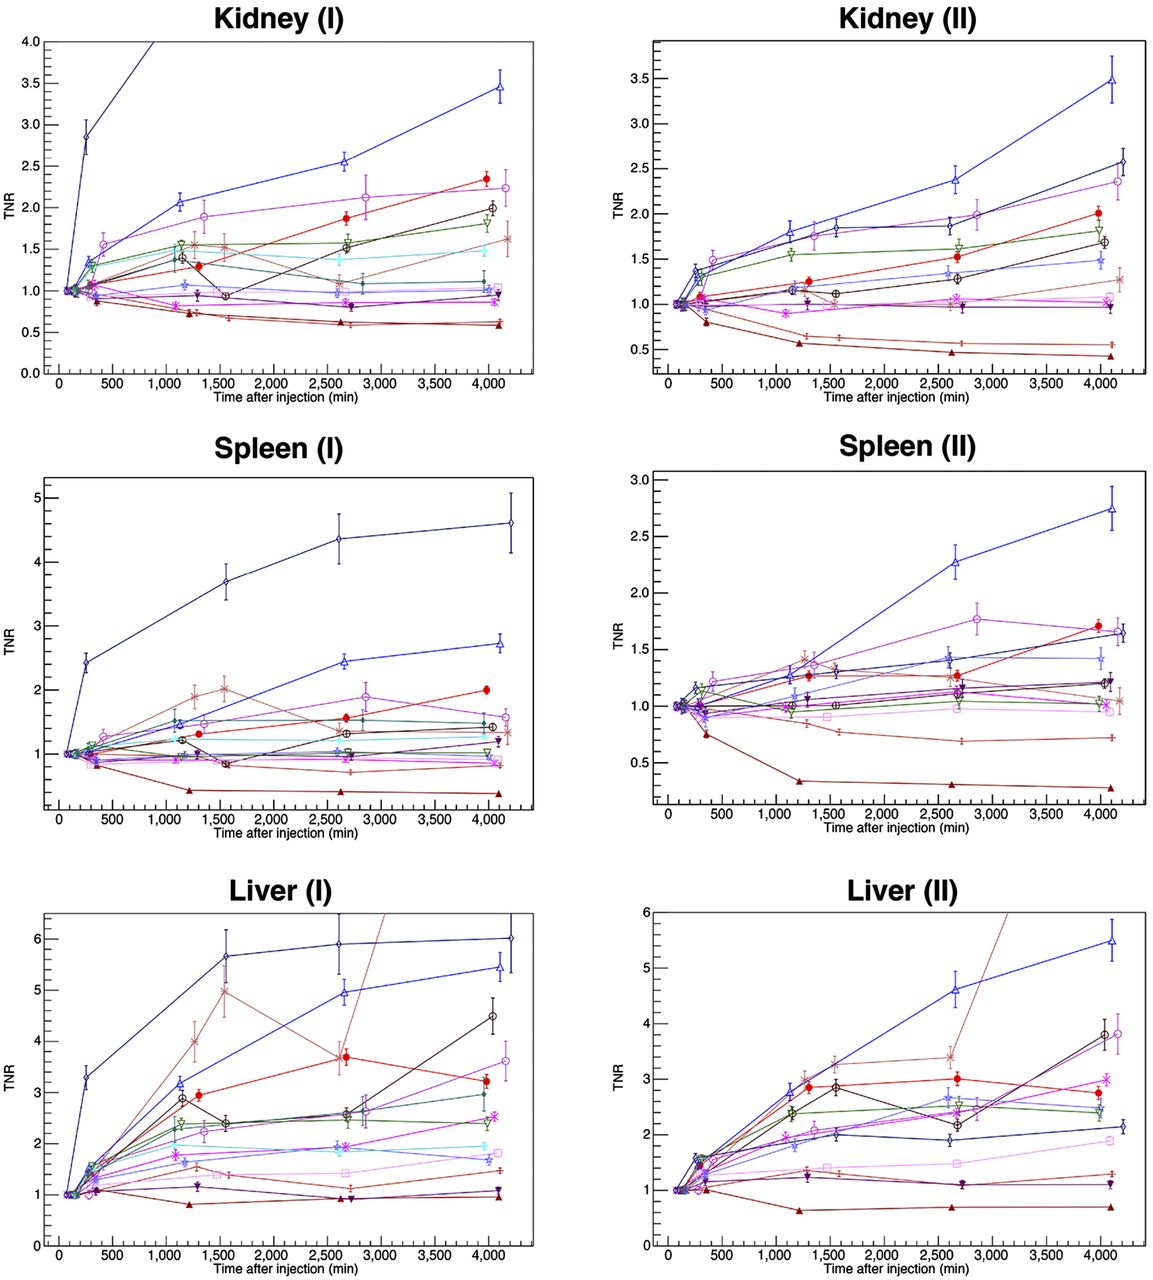
The quantity of interest for RGS is the time evolution of the TNR, which is reported in Figure 5 after normalization at the initial value. It is evident that when not indefinitely growing, the TNRs reach a maximum value at about 24 h after injection. This constitutes a crucial parameter in view of a possible application protocol of β− RGS. In fact, operating with the most favorable TNR results in the maximum achievable sensitivity, or, conversely, the minimal activity to be injected. The 90Y decay does not affect this conclusion since the optimal time is much shorter than its half-life ( = 64 h).

TNRs for considered lesions as function of time after injection. Each lesion is compared with VOI in healthy organ (kidney, spleen, or liver). I and II refer to the 2 lesions considered for each patient. Key is in Figure 4.
Finally, the TNRs discussed here are not those of interest for RGS. In fact, each tumor was compared with liver as well as kidneys and spleen, independently of its real localization. However, this general study allows us to conclude that the time dependence of the TNR is sufficiently independent of the organ of interest and can thus be used as a general reference for RGS.
Comparison Between NETs
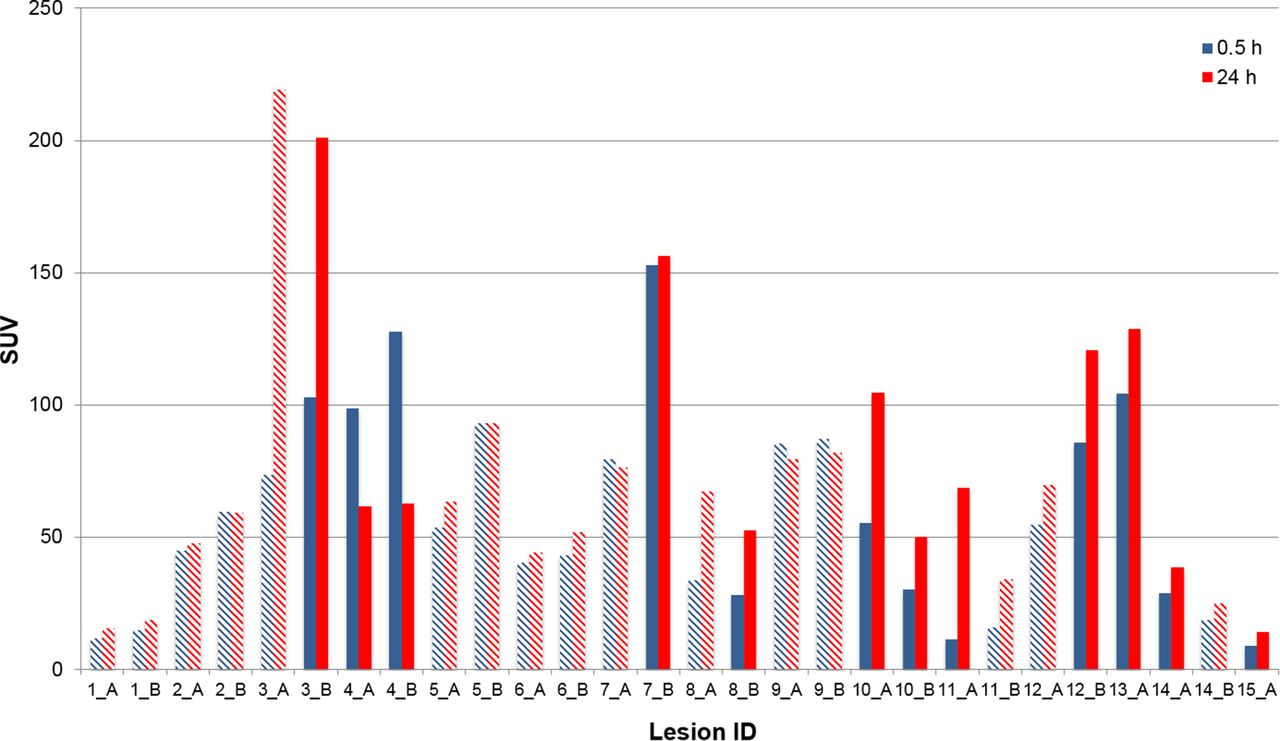
Our sample includes a variety of different locations for NET lesions. It is therefore of interest to compare SUVs among them to verify whether uptake depends on the location of the tumor or whether all NETs are comparable in this respect. The result is shown in Figure 6. No clear pattern appears, the variability of the SUV being reasonably independent of the localization of the NET.

Measured SUV for several lesions 0.5 and 24 h after administration. The hatched shading identifies liver lesions. A and B refer to the 2 lesions considered for each patient.
Expected Performance of RGS with β− Decay
To study the expected applicability of β− RGS to NETs, we restricted our patient sample to only those with NETs in the liver, for a total of 16 lesions from 11 patients of the cohort. According to the results on the time dependence of uptake for each patient, the DICOM image nearest the 24-h interval from radiopharmaceutical administration was considered for this study, to resemble as closely as possible the optimal scenario. For each lesion, the specific activities in the area of maximum uptake (AMAX) and the nearby background (A0) were evaluated from μMAX and μ0, respectively, as described in the “Materials and Methods.”
From the FLUKA simulation, we then extracted the signal rates that we expect to measure with a realistic β− probe in the presence of a tumor residual or in the presence of only healthy tissue. From such estimates the false-negative and false-positive rates after a given measurement time can be computed. The minimum time that a surgeon needs to spend on a sample to evaluate whether it is healthy,  , is determined by finding the minimal acquisition time of the probe for which there exists a threshold in counts that allows a false-negative rate of less than 5% and a false-positive rate of less than 1%.
These calculations allowed us to conclude that the SUVs in the lesions are so high, compared with the nearby background, that even after administration of only 1 MBq/kg the required measurement time is less than 1 s for each lesion. However, AMAX estimates the activity of the bulk of the tumor whereas RGS targets the tumor margins that have lower uptake. We therefore conservatively repeated the simulations with a third of the activity and found the measurement time to still be below 1 s.
DISCUSSION
The novel RGS technique under development relies on the existence of a radiotracer that efficiently and selectively delivers a β− emitter to the tumor. Previous studies have demonstrated the applicability of such a technique exploiting 90Y-labeled peptides as a radiotracer in cases of meningioma and high-grade glioma (6). This paper represents the extension of those studies to NETs. This study, being a first general investigation, considers lesions in several organs.
These tumors are known to show high uptake of 90Y-labeled peptides, which are, in fact, commonly used in radioreceptor therapy. In the context of radioguided surgery, however, the evolution of this uptake gains importance. To address this topic, we studied uptake by NET lesions, healthy liver, spleen, and kidneys in 15 patients injected with 177Lu-DOTATOC. We concluded that all lesions show an accumulation in the first 24 h, whereas in healthy tissue metabolic washout starts earlier. As a consequence, TNR is optimal 24 h after injection, and given the long half-life of 90Y, this is the optimal time for surgery.
Since the uptake of the NET lesions may depend on their localization, we also compared the SUVs of different NETs 24 h after injection, and we found no significant difference among them. Clinical studies can therefore concentrate on the type of NET that may profit most from RGS.
Furthermore, to evaluate the applicability of the novel RGS technique to NETs, we considered specifically the liver, where background from nearby healthy organs is under control. We therefore selected 16 liver NET lesions for which we evaluated the time needed to identify with sufficient accuracy a residual of 0.1 mL. The results show that all considered lesions would be identified within a second by injecting an activity of as low as 1 MBq/kg, suggesting that β− RGS can be applied to liver NETs.
The clinical cases already explored with 111In-octreotide (8–11) would certainly profit from the reduced background in healthy tissues brought about by the technique described in this paper.
CONCLUSION
We estimated the uptake of DOTATOC in NETs in the context of a feasibility study of a novel RGS technique exploiting β− decay. In particular, we focused on the time evolution of this uptake, showing that a maximum TNR is reached at about 24 h after injection. Regarding the applicability of the proposed RGS technique, by injecting a reference activity of 1 MBq/kg—about a third of that commonly injected for PET—all lesions are estimated to be identified within a second.
Although there are aspects requiring clinical tests, such as the impact of limited radiation penetration or of uptake inhomogeneity, particularly in the margins, our results suggest a good chance of extending this technique to NETs.
DISCLOSURE
The costs of publication of this article were defrayed in part by the payment of page charges. Therefore, and solely to indicate this fact, this article is hereby marked “advertisement” in accordance with 18 USC section 1734. The study was financed by the research funds of the Università di Roma “La Sapienza,” INFN, IIT, and Centro Fermi. Francesco Collamati, Fabio Bellini, Erika De Lucia, Michela Marafini, Vincenzo Patera, Alessio Sarti, Adalberto Sciubba, Cecilia Voena, and Riccardo Faccini are listed as inventors on an Italian patent application (RM2013A000053) entitled “Utilizzo di radiazione beta− per la identificazione intraoperatoria di residui tumorali e la corrispondente sonda di rivelazione” dealing with the implementation of an intraoperative β− probe for radioguided surgery according to the results presented in this paper. The same authors are also inventors in the PCT patent application (PCT/IT2014/000025) entitled “Intraoperative detection of tumor residues using beta− radiation and corresponding probes” covering the method and the instruments described in this paper. No other potential conflict of interest relevant to this article was reported.
Footnotes
Published online Sep. 3, 2015.
- © 2015 by the Society of Nuclear Medicine and Molecular Imaging, Inc.
REFERENCES
- Received for publication May 15, 2015.
- Accepted for publication July 13, 2015.


Jump to section
Related Articles
Cited By...
- No citing articles found.