


Abstract
Time-of-flight (TOF) PET was initially introduced in the early days of PET. The TOF PET scanners developed in the 1980s had limited sensitivity and spatial resolution, were operated in 2-dimensional mode with septa, and used analytic image reconstruction methods. The current generation of TOF PET scanners has the highest sensitivity and spatial resolution ever achieved in commercial whole-body PET, is operated in fully-3-dimensional mode, and uses iterative reconstruction with full system modeling. Previously, it was shown that TOF provides a gain in image signal-to-noise ratio that is proportional to the square root of the object size divided by the system timing resolution. With oncologic studies being the primary application of PET, more recent work has shown that in modern TOF PET scanners there is an improved tradeoff between lesion contrast, image noise, and total imaging time, leading to a combination of improved lesion detectability, reduced scan time or injected dose, and more accurate and precise lesion uptake measurement. Because the benefit of TOF PET is also higher for heavier patients, clinical performance is more uniform over all patient sizes.
The signal in PET is produced by the annihilation of an emitted positron with an electron in the surrounding medium or tissue. Positron annihilation leads to the production of two 511-keV photons emitted almost back-to-back that are detected in time coincidence by the surrounding PET detectors to form a line of response (LOR). The emission distance along the LOR (d) is determined by d = c × (t2 − t1)/2, where c is the speed of light and t1 and t2 are the arrival times of the 2 photons (Fig. 1A). In conventional PET, the difference in arrival time (t2 − t1) of these 2 photons is not measured precisely enough to localize the emission point along the LOR. By collecting all possible LORs around the object (full angular coverage) and assuming uniform probability that the emission points lie along the full length of the LORs (and within the object boundary), it is mathematically possible to reconstruct the emission object accurately. Knowledge of emission point locations along the LORs is not necessary to reconstruct the emission object. However, by assuming a uniform probability of the event location along the full LOR length, noise from different emission events is forward- and backward-projected during image reconstruction over many image voxels, leading to increased noise correlation. Hence, the image signal-to-noise ratio (SNR) becomes reduced (Fig. 1B).
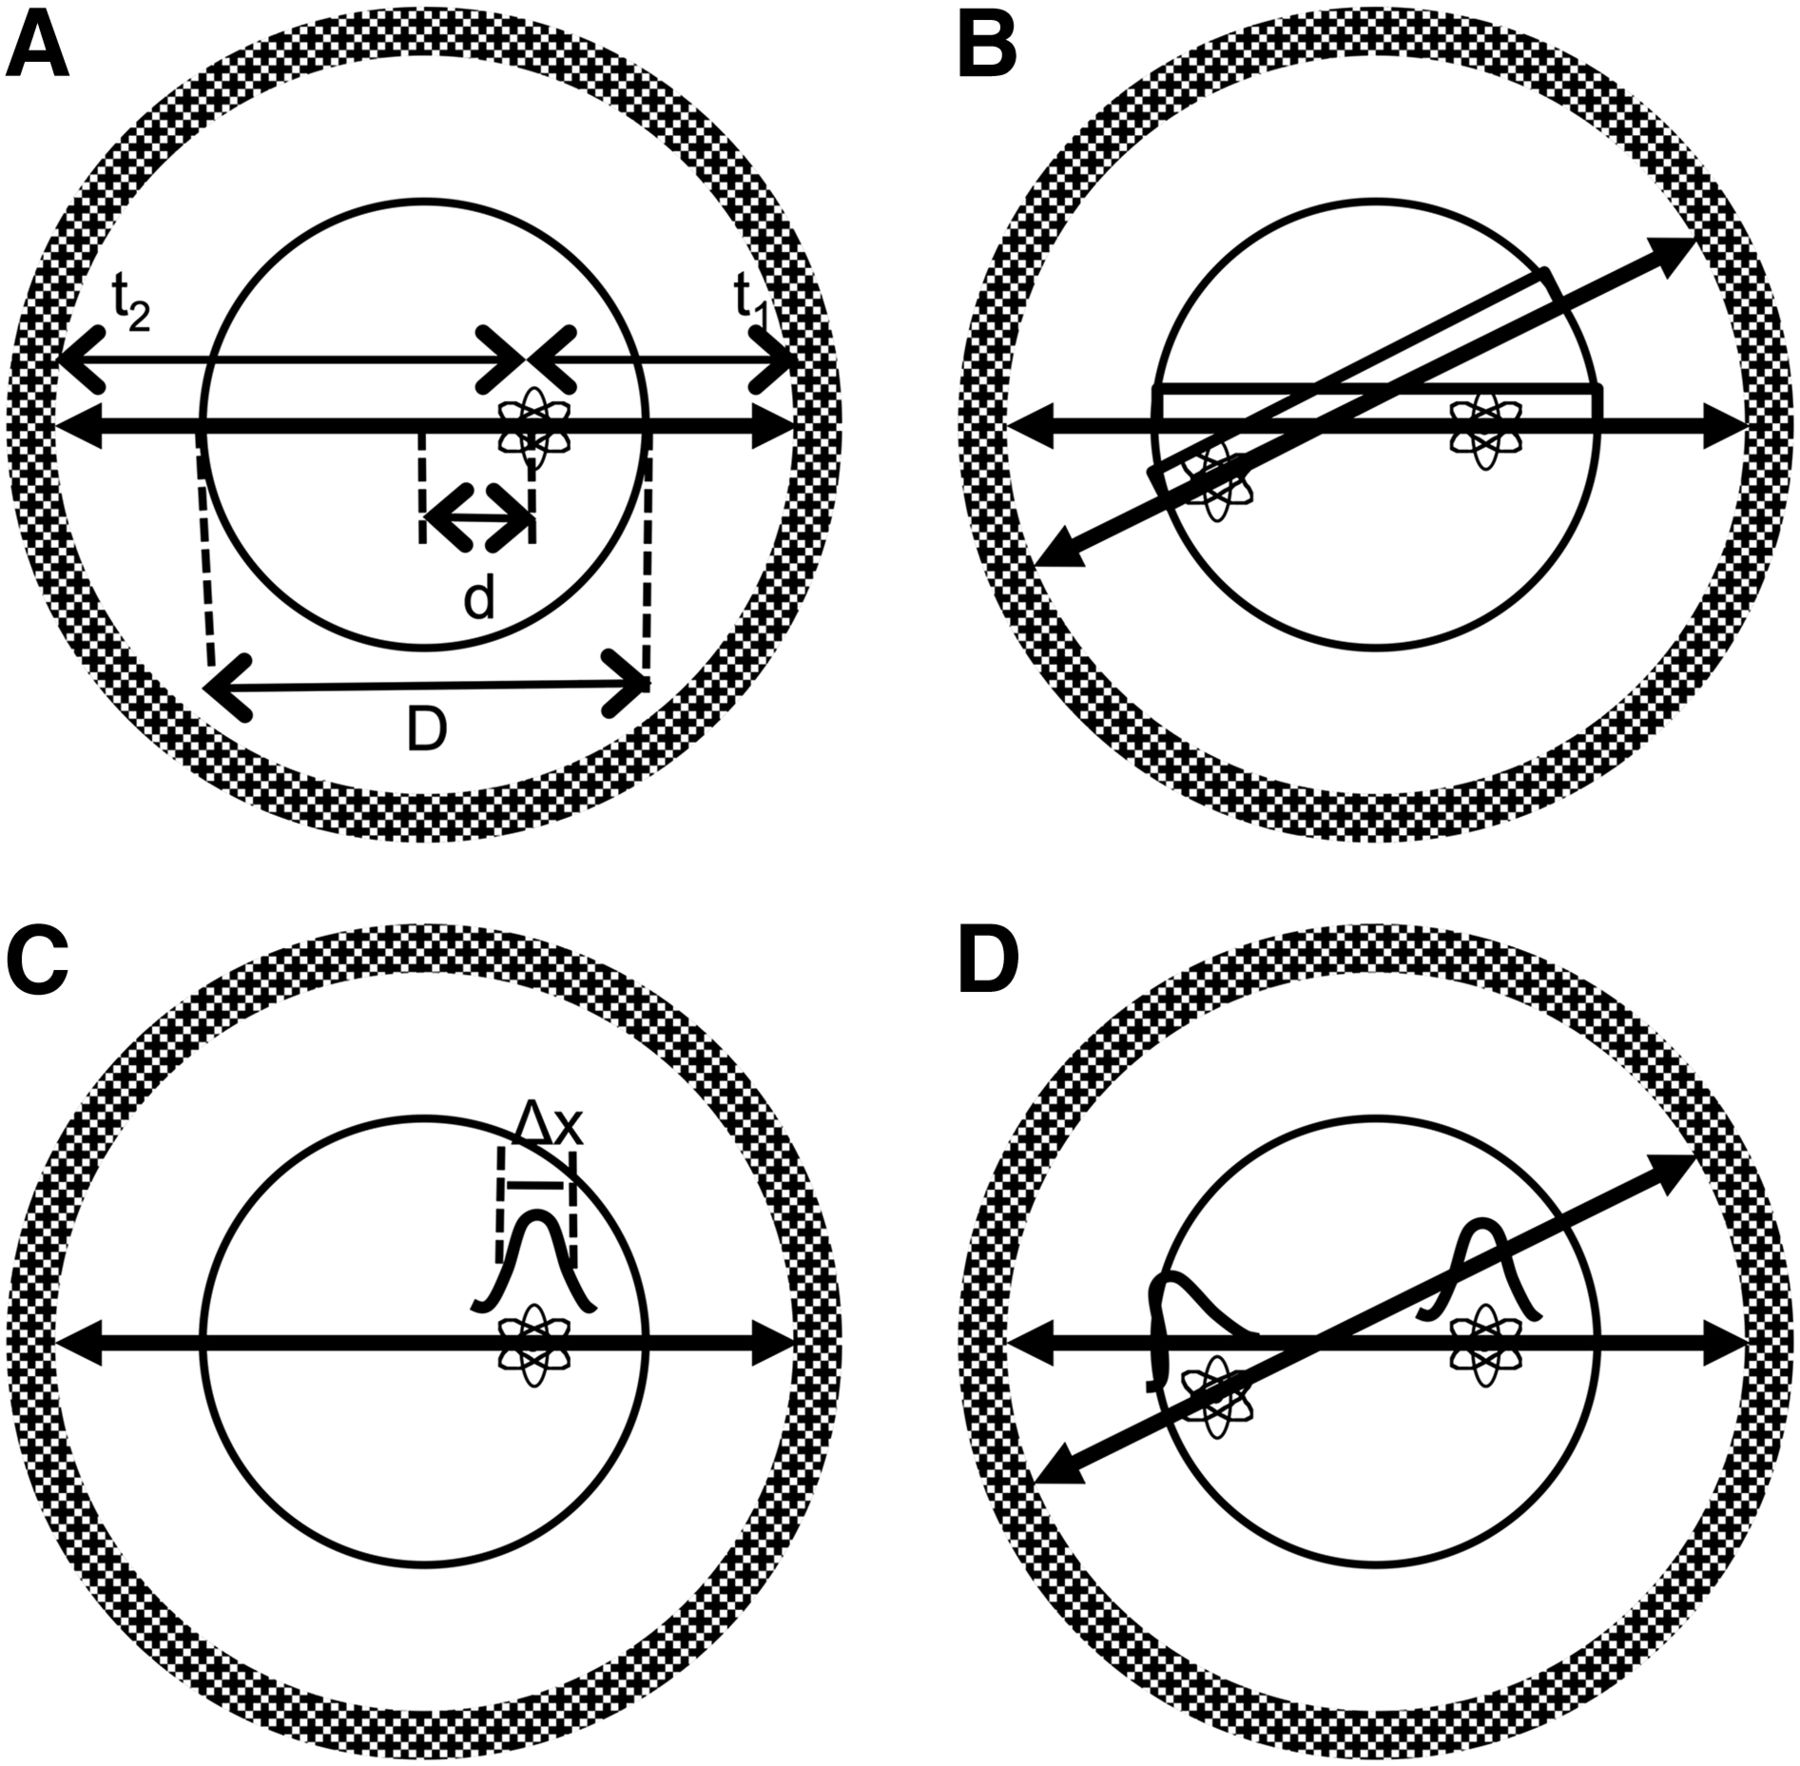
(A) Emission point at distance d from center of scanner within object of diameter D. The two 511-keV photons are detected in coincidence at times t1 and t2. (B) Without precise TOF measurement, uniform probability along LOR within object is assumed for each emission point, leading to noise correlations over portion of image space between the 2 events as shown here. (C) With TOF information, position of emission point is localized along LOR with precision that is defined by gaussian distribution of width Δx. (D) Better localization of the 2 emission events along their individual LORs leads to reduced (or no, as shown here) noise correlation of events in image space during image reconstruction.
In time-of-flight (TOF) PET, the difference in the arrival times of the 2 photons is measured with high precision, which helps localize the emission point along the LOR within a small region of the object (Fig. 1C). The uncertainty in this localization is determined by the system coincidence timing resolution, Δt, which is measured as the full width at half maximum of the histogram of TOF measurements from a point source (timing spectrum). The corresponding uncertainty in spatial localization (Δx) along the LOR is given by Δx = c × Δt/2. If Δx is the same as or smaller than the detector spatial resolution (∼4–5 mm for modern PET scanners), then in principle image reconstruction is not needed. Typically, this spatial localization is an order of magnitude lower than the detector spatial resolution, and hence image reconstruction is still necessary to produce tomographic images. However, during reconstruction, noise from different events is now forward- and backward-projected over only a limited number of image voxels as defined by the spatial uncertainty, leading to reduced noise correlations and improved image SNR (Fig. 1D).
HISTORICAL BACKGROUND
Use of TOF information to localize the emission point along an LOR was recognized from the very early days (1960s) of PET (1–3). However, it was not until the 1980s that the first TOF PET machines were developed for clinical use (4–9). The primary application of PET in those days was in cardiology and brain imaging with tracers using short-lived isotopes such as 15O and 13N. Hence, the motivation for developing TOF PET was driven by the need to improve SNR in reconstructed images and reduce random coincidences in the collected data. These early TOF PET systems used CsF and later BaF2 as the scintillators and had a system coincidence timing resolution in the range of 450–750 ps. Compared with the slower scintillators such as bismuth germanium oxide (BGO) and NaI(Tl) that were being used in non-TOF PET scanners, both CsF and BaF2 had poor detection efficiency and low light output. Consequently, system spatial resolution in these early TOF PET systems was poor because of the need to use larger crystals, and the SNR gains due to TOF were not large enough to compensate for the reduced detector sensitivity. Although these TOF PET systems met the early demands of high-counting-rate brain and cardiac studies, by the early 1990s they were superseded by the non-TOF PET scanners based primarily on bismuth germanium oxide and to a lesser extent on NaI(Tl), since the lower detection efficiency overwhelmed the advantage of TOF in these systems. A good summary of this history has been presented by Lewellen (10).
PAST ESTIMATES OF TOF GAIN
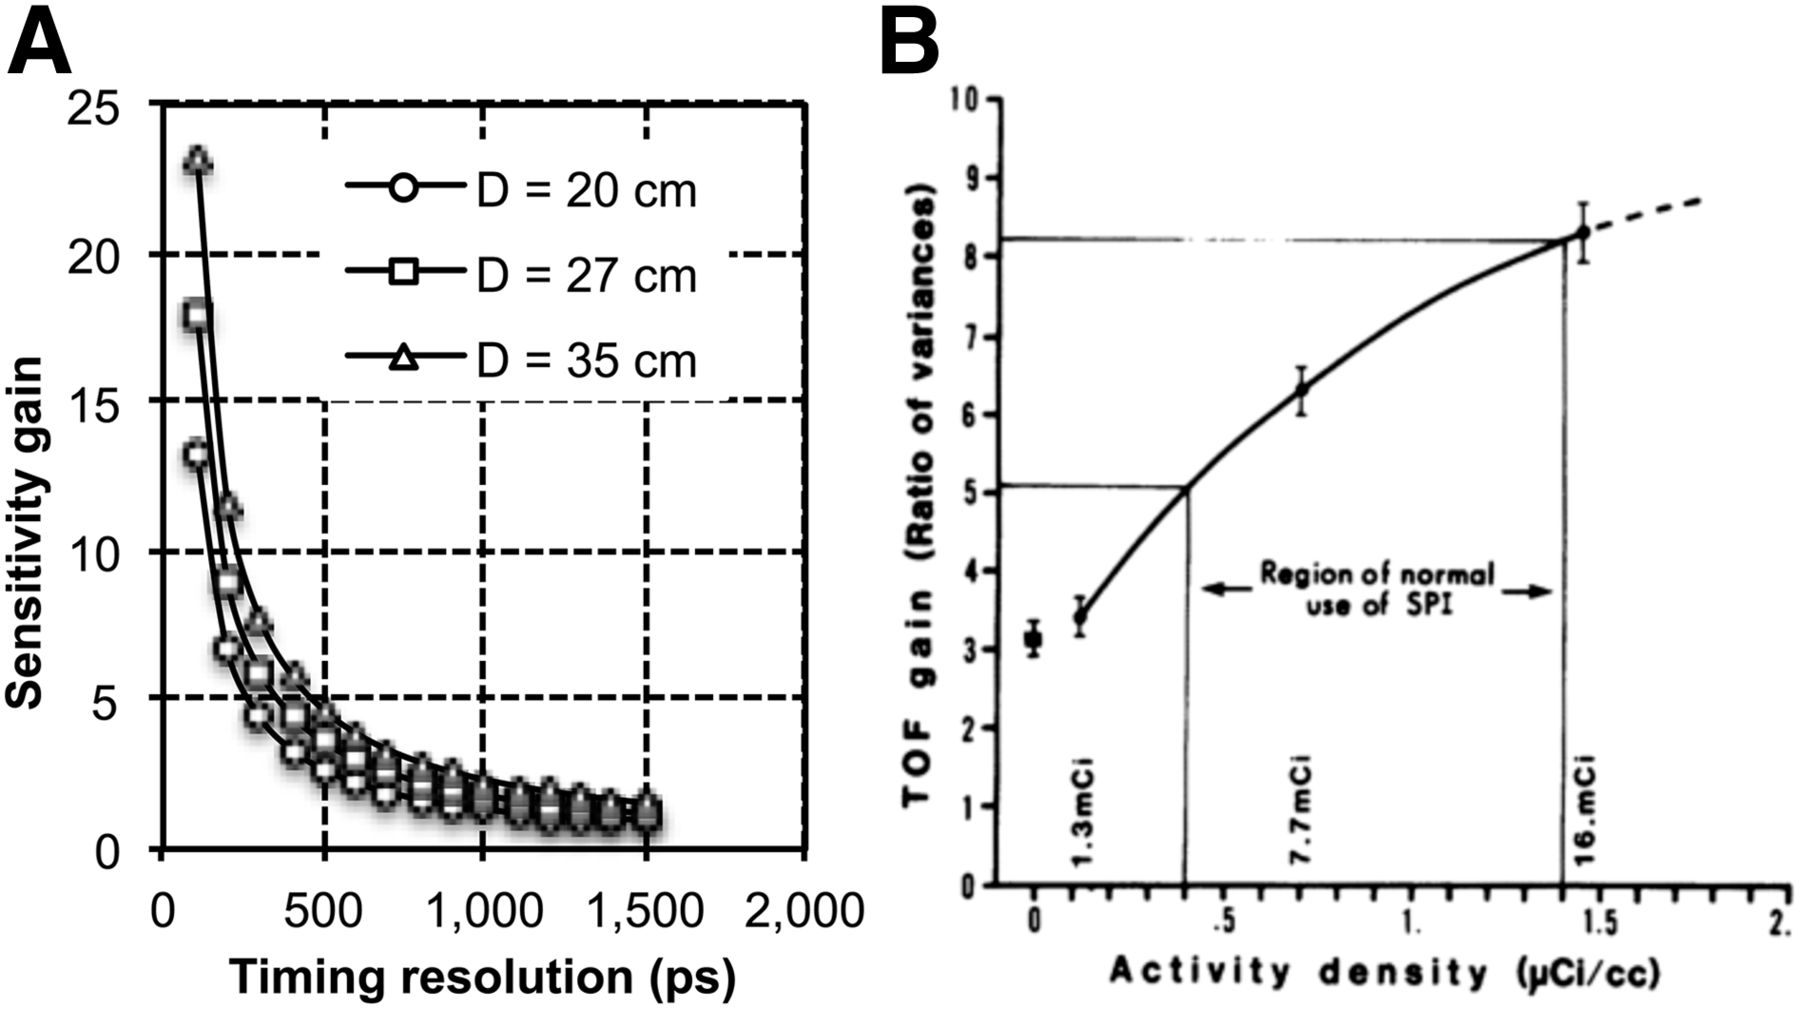
With the knowledge that during the forward- and backward-projection steps in image reconstruction noise will be spread over fewer voxels along the LOR (defined by Δx), it was shown previously (11,12) that the effective gain in sensitivity at the center of a uniform cylinder due to TOF information is given by D/Δx. Figure 2A shows this gain in sensitivity plotted as a function of timing resolution and for varying object sizes. As the object size increases or timing resolution improves, the gain due to TOF PET increases. This derivation of TOF PET is based on the assumption that the histogram for TOF measurements (timing spectrum) from a fixed point source has a uniform distribution with a width equal to the system timing resolution, Δt (or Δx). However, in practice the timing spectrum has a gaussian shape with tails that spread noise over pixels beyond those defined by Δx. Hence, this sensitivity gain metric is an overestimate. A more detailed estimation of TOF gain performed by Tomitani (13) included the effects of filtering during the reconstruction process to arrive at an estimate for TOF gain given by D/(1.6 × Δx) under the condition that Δx is at least twice the detector spatial resolution. Both these derivations, however, showed that the gain in TOF sensitivity is proportional to the object size (D) and inversely proportional to the detector timing resolution (Δt or Δx). These results were also consistent with subsequent evaluations performed in the 1980s (14,15). PET imaging in the 1980s was geared more toward high-activity, or high-counting-rate, brain and cardiac studies in which random coincidences are a significant component of the collected data. It was originally suggested (16) and subsequently shown (17) through uniform cylinder measurements that the sensitivity gain due to TOF as defined by the above formulas for low activity levels also increases as a function of activity level because of the reduced impact of random coincidences in TOF images. Figure 2B (17) shows a plot of measured gain due to TOF as a function of activity concentration in a uniform cylinder. The TOF gain was measured as the ratio of the variance in reconstructed non-TOF and TOF images. As activity concentration and hence randoms fraction increases, TOF gain also increases.

(A) Gain in sensitivity as defined by D/Δx plotted as function of timing resolution for cylindric phantoms with 3 different diameters. (B) TOF gain as function of activity concentration in 35-cm diameter by 11.5-cm-long uniform cylinder measured on Super PETT I (SPI) scanner (5). (Reprinted with permission of (17).)
NEW GENERATION OF TOF PET SCANNERS
The advent of the lutetium oxyorthosilicate (LSO) crystal in the mid to late 1990s led to recognition that a new class of fast scintillators existed that could provide a combination of high light output and high stopping efficiency for 511-keV photons. The immediate advantage of a crystal such as LSO over BGO was the ability to achieve a high counting-rate capability, reduce the random coincidence rate with a tight coincidence timing window (≤±3 ns), improve system spatial resolution, and provide maximum benefits from fully-3-dimensional (3D) imaging (without septa). In addition, it was recognized that the combination of the high light output and short decay time of LSO provides the good timing resolution necessary for TOF PET (18,19). In 2005, early results from a commercial LSO PET system showed that a system timing resolution of 1.2 ns could be achieved with photomultiplier tubes (PMTs) and electronics that were not optimized for TOF imaging (20). Subsequently, the first commercial TOF PET scanner using lutetium-yttrium oxyorthosilicate (LYSO, another crystal with properties similar to LSO) was introduced with a timing resolution of 585 ps (21). Since then, all 3 commercial manufacturers have introduced some version of an LSO- or LYSO-based TOF PET scanner with system timing resolution in the 450- to 500-ps range. Compared with the first-generation TOF PET scanners from the 1980s, these systems do not compromise system sensitivity or spatial resolution. In fact, the non-TOF performance of these scanners is the highest that has been achieved historically. Also, compared with the first-generation systems, the current TOF scanners operate in fully-3D mode because of good system energy resolution and the ability to correct and reconstruct large datasets because of advances in computer hardware. The new systems also benefit from the development of new small, cost-effective PMTs with good timing performance. Developments in electronics with new application-specific integrated circuit and field-programmable gate array designs have also led to a more stable timing performance for these new systems over extended periods. Finally, image reconstruction techniques have developed significantly since the 1980s, when primarily analytic algorithms such as most-likely-position (11) and confidence-weighted backward projection (11,13,22) were used for image generation. In recent years, there have been significant developments in iterative list-mode reconstruction algorithms, with full system modeling—including TOF kernel—included in the reconstruction (23–28). In combination with faster central processing units and parallelization of reconstruction algorithms, these techniques have become practical and feasible for clinical use. Although all these technical advances have led to significant improvements in TOF PET technology and made it a necessary component of all modern PET scanners, the growth of 18F-FDG PET imaging in oncology is now the primary driver for most advances in PET technology.
GAIN IN IMAGE SNR FROM FULLY-3D TOF PET
The recent introduction of fully-3D TOF PET scanners led to an initial focus on estimating the gain in sensitivity or SNR due to TOF information along lines similar to what was done previously in the 1980s. However, the physical noise equivalent count (NEC) metric was now used to better estimate the impact of increased true, random, and scatter coincidences in fully-3D PET. The NEC metric was developed as a physical surrogate to estimate the image SNR (NEC = SNR2) at the center of a uniform cylinder after taking into account the contributions of not only true coincidences but also scatter and random coincidences (29). NEC, therefore, represents the effective sensitivity of a PET scanner. For TOF PET, the NEC metric was extended (30) to show that Eq. 1where β = D/DFOV; DFOV is the diameter of the imaging field of view; and T, Sc, and R are the number of true, scatter, and random coincidences, respectively. As can be seen, this formulation of NEC is consistent with the past observation that the gain in sensitivity from TOF is proportional to the object size, is inversely proportional to the timing resolution, and increases as the relative number of random coincidences is increased. This derivation of gain in NEC due to TOF information was verified in a scanner with a 1.2-ns timing resolution (30) (with some limitations at low activity levels) when a special implementation of the TOF filtered backward-projection reconstruction algorithm was used (20). Although this formulation of NEC gives a reasonable starting point for understanding the potential benefits of TOF, the effect of iterative image reconstruction, especially the choice of number of iterations to use, and data correction schemes as implemented on clinical scanners is not captured by this metric. Also, a better understanding of the impact of TOF in clinical studies with a nonuniform activity distribution requires the use of task-dependent metrics that are closer to the clinical process of patient disease evaluation. However, the multiparameter effect on the resultant images and the nonlinear characteristics of these task-dependent metrics make it impossible to assign a single gain factor in the resultant images due to TOF information.
BENEFIT OF MODERN TOF PET SCANNERS IN CLINICALLY RELEVANT IMAGING TASKS
Lesion uptake measurement is commonly performed on 18F-FDG images to distinguish between benign and malignant tumors and to determine disease progression during therapy. With iterative reconstruction, each additional iteration of the algorithm brings the lesion uptake measurement closer to convergence but with the penalty of increased noise in the image. Investigations performed over the last decade using both physical phantoms (20,31–37) and clinical studies (33,36) have shown that with TOF imaging the lesion uptake or contrast recovery coefficient (CRC) converges more quickly or requires fewer iterations to achieve the maximal contrast. Figure 3A (33) shows TOF and non-TOF images reconstructed from the same dataset for a 35-cm-diameter lesion phantom as a function of iteration number. From this set of images, it is clearly observed that the smallest hot sphere (10 mm in diameter) is easily visible even after 1 iteration (because of fast recovery of lesion uptake). For non-TOF images, even after 20 iterations the 10-mm sphere is not clearly visible and the noise in the image is significantly enhanced. Figure 3B (33) shows TOF (5 iterations) and non-TOF (10 iterations) images as a function of varying scan times. The choice of the iteration number was based on the relative convergence of the 2 image sets, with very little increase in lesion uptake as the number of iterations increased. From this image, we observe that for the non-TOF image the 10-mm sphere is not visible even after a 5-min scan whereas we need a scan time of greater than 2 min to see the 13-mm-diameter sphere. With TOF, all lesions are visible after a scan time of 2 min. Figure 3C (33) shows lesion CRC plotted as a function of image noise for the 13-mm-diameter sphere. For the same scan time and noise, TOF leads to a higher CRC. For a similar CRC, the non-TOF image has higher noise, and increasing the scan time from 2 to 5 min still does not lead to a noise level similar to the 2-min TOF image, indicating the potential to reduce scan time with TOF imaging. Because clinical studies are performed to achieve a certain fixed level of image noise for either TOF or non-TOF data, these phantom studies indicate that in patients TOF imaging should lead to increased lesion uptake measurements. In Figure 3D (33), we present results from a 5-patient study showing the average gain in contrast due to TOF information for several lesions within each patient. The TOF and non-TOF images were chosen for a fixed number of iterations over all patients that gave a similar pixel-to-pixel noise within the liver. As seen in the phantom studies, TOF leads to a gain in lesion contrast measurement, with a trend toward higher gain in larger patients.

(A) Reconstructed non-TOF (top row) and TOF (bottom row) images for 35-cm-diameter cylindric lesion phantom for iteration numbers (left to right) 1, 2, 5, 10, and 20. Phantom has hot spheres (diameters of 22, 17, 13, and 10 mm) with 6:1 uptake relative to background and 2 cold spheres (37 and 28 mm). (B) Non-TOF (top row) and TOF (bottom row) images for 35-cm-diameter cylindric lesion phantom for scan times of (left to right) 5, 3, 2, and 1 min. Non-TOF and TOF images are shown for iterations 10 and 5, respectively, where lesion CRC values are at or close to convergence. (C) CRC for 13-mm-diameter sphere plotted as function of image noise at iteration numbers 1, 2, 5, 10, 15, and 20. Closed symbols are for non-TOF and open symbols for TOF images with scan times of 2 (▲), 3 (♦), 4 (▪), and 5 (●) min. (D) Gain in lesion contrast as measured over several lesions in 5 different patients. TOF and non-TOF images were chosen for fixed number of iterations to achieve similar pixel-to-pixel noise in images.
Lesion Detectability in a Uniform-Background Phantom
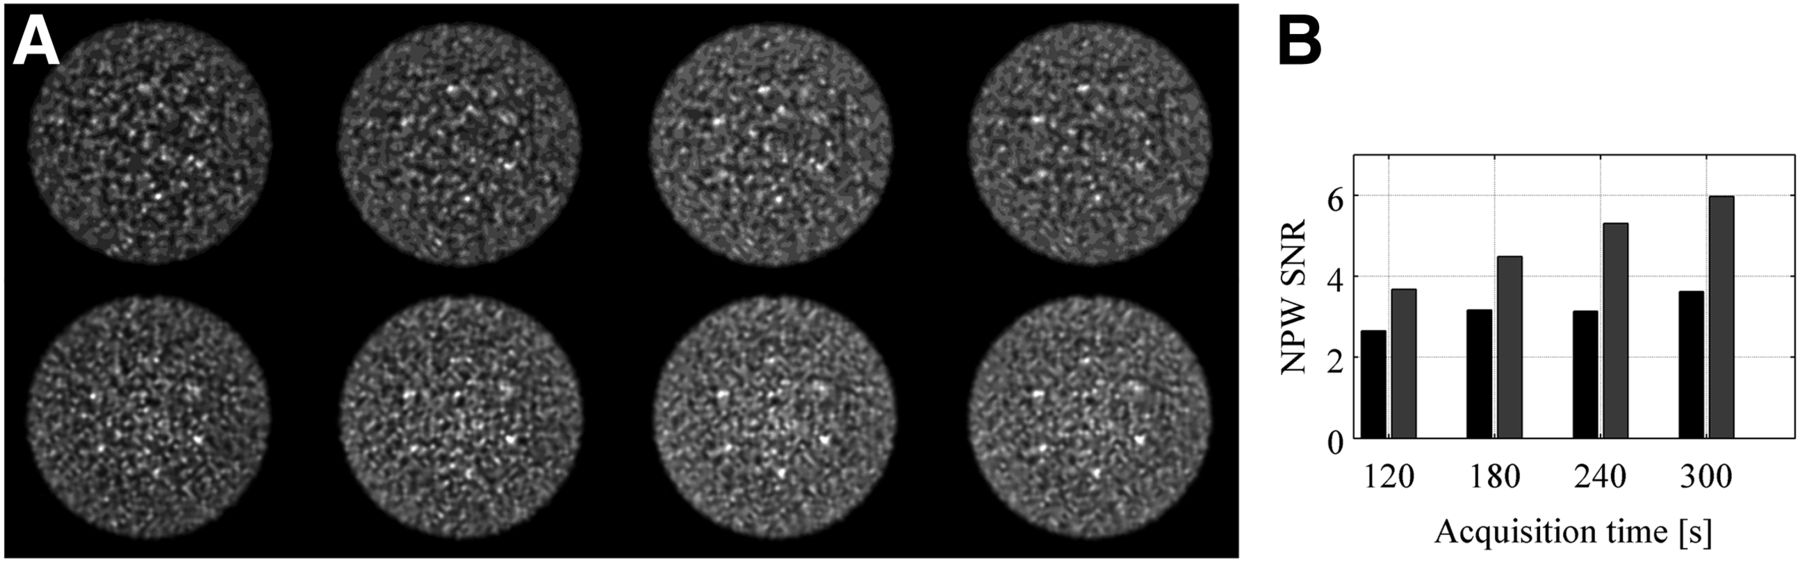
The interplay between image noise (function of scan time and number of iterations of reconstruction algorithm) and lesion uptake (or CRC) measurement has a direct impact on lesion detectability in a PET image, especially in the case of TOF data, which has a faster CRC convergence. An early simulation study (31) using a numeric observer (nonprewhitening matched filter SNR, NPWSNR) showed a gain in small-lesion (10-mm diameter) detectability with TOF PET in a uniform cylinder. The nonprewhitening matched filter SNR metric showed a nonlinear increase as a function of count statistics and timing resolution, and the gains were proportional to (but less than) the simplified estimate of (D/Δx)1/2. These results were subsequently verified experimentally (34). Figure 4 (34) shows sample reconstructed images from this study after a 5-min scan and the NPWSNR results as a function of scan time. Nonprewhitening matched filter SNR is always higher for TOF images, and the relative gain increases with scan time.

(A) Reconstructed non-TOF (top row) and TOF (bottom row) images for 35-cm-diameter lesion phantom containing six 10-mm-diameter spheres with 6:1 uptake relative to background. All images are shown after 20 iterations and are for scan times of (left to right) 1, 2, 3, 4, and 5 min. (B) NPWSNR for 10-mm-diameter spheres plotted as functin of scan time for non-TOF (light bars) and TOF (dark bars) images. (Reprinted with permission of (34).)
Lesion Detectability in a Nonuniform, Anthropomorphic Phantom
A simplification in the above lesion detection studies was the task of detecting lesions at a fixed known position (i.e., “signal known exactly,” or SKE) in a uniform background. Clinically, patient habitus is nonuniform and the presence of statistical noise in PET data significantly affects the ability to detect lesions at previously unknown positions. Working toward this direction, Kadrmas et al. (38) performed a detailed study for detecting focal lesion hot spots in an anthropomorphic phantom. Using numeric observers, as well as untrained (nonclinical) human observers, Kadrmas et al. showed a significant gain in the area under the localization receiver operating characteristic curve (ALROC) after including TOF information in image reconstruction. The ALROC metric represents the probability that an observer correctly identifies the presence and location of a lesion in the image, and the metric hence represents a more clinically realistic measure to quantify the benefit of TOF PET. A follow-up study (39) using numeric observers and a larger anthropomorphic phantom showed that with TOF PET, the scan time could be reduced by as much as 40% to achieve an ALROC value similar to that in non-TOF PET.
Lesion Detectability in Clinical Patients
Finally, a study utilizing 100 healthy-patient datasets was developed in which synthetic, measured lesion data were introduced in the list data from the scanner followed by image reconstruction (40,41). Lesions were added in the lung and liver regions of the patients. The first part of this study used a numeric observer to calculate lesion detectability for a signal-known-exactly task. Results from this work (40) showed a gain in lesion detectability from TOF information over all patient sizes, lesion contrasts, and scan times and were used to set up a human observer study with a selected subsection of the images. The second part of this study (41) used human observers (combination of clinicians and a nonclinician) to interpret the images and determine the presence (and location) or absence of a lesion. Figure 5A (41) shows sample reconstructed images for a patient (body mass index of 28.4) with a lesion inserted in the liver. A longer scan time and TOF imaging led to a qualitative improvement in lesion detection. Figure 5B (41) summarizes the ALROC results for the liver lesions. This study showed that although, overall, heavier patients have lower ALROC values than lighter patients, longer scans (3 min per bed position) lead to improved ALROC values. Also, TOF information leads to improved performance, with a larger benefit in heavier patients. Hence, in heavier patients the use of TOF information together with longer scan times (3 min per bed position) leads to ALROC values that are similar to those achieved in lighter patients, indicating that TOF imaging leads to a more uniform performance over different patient habitus.
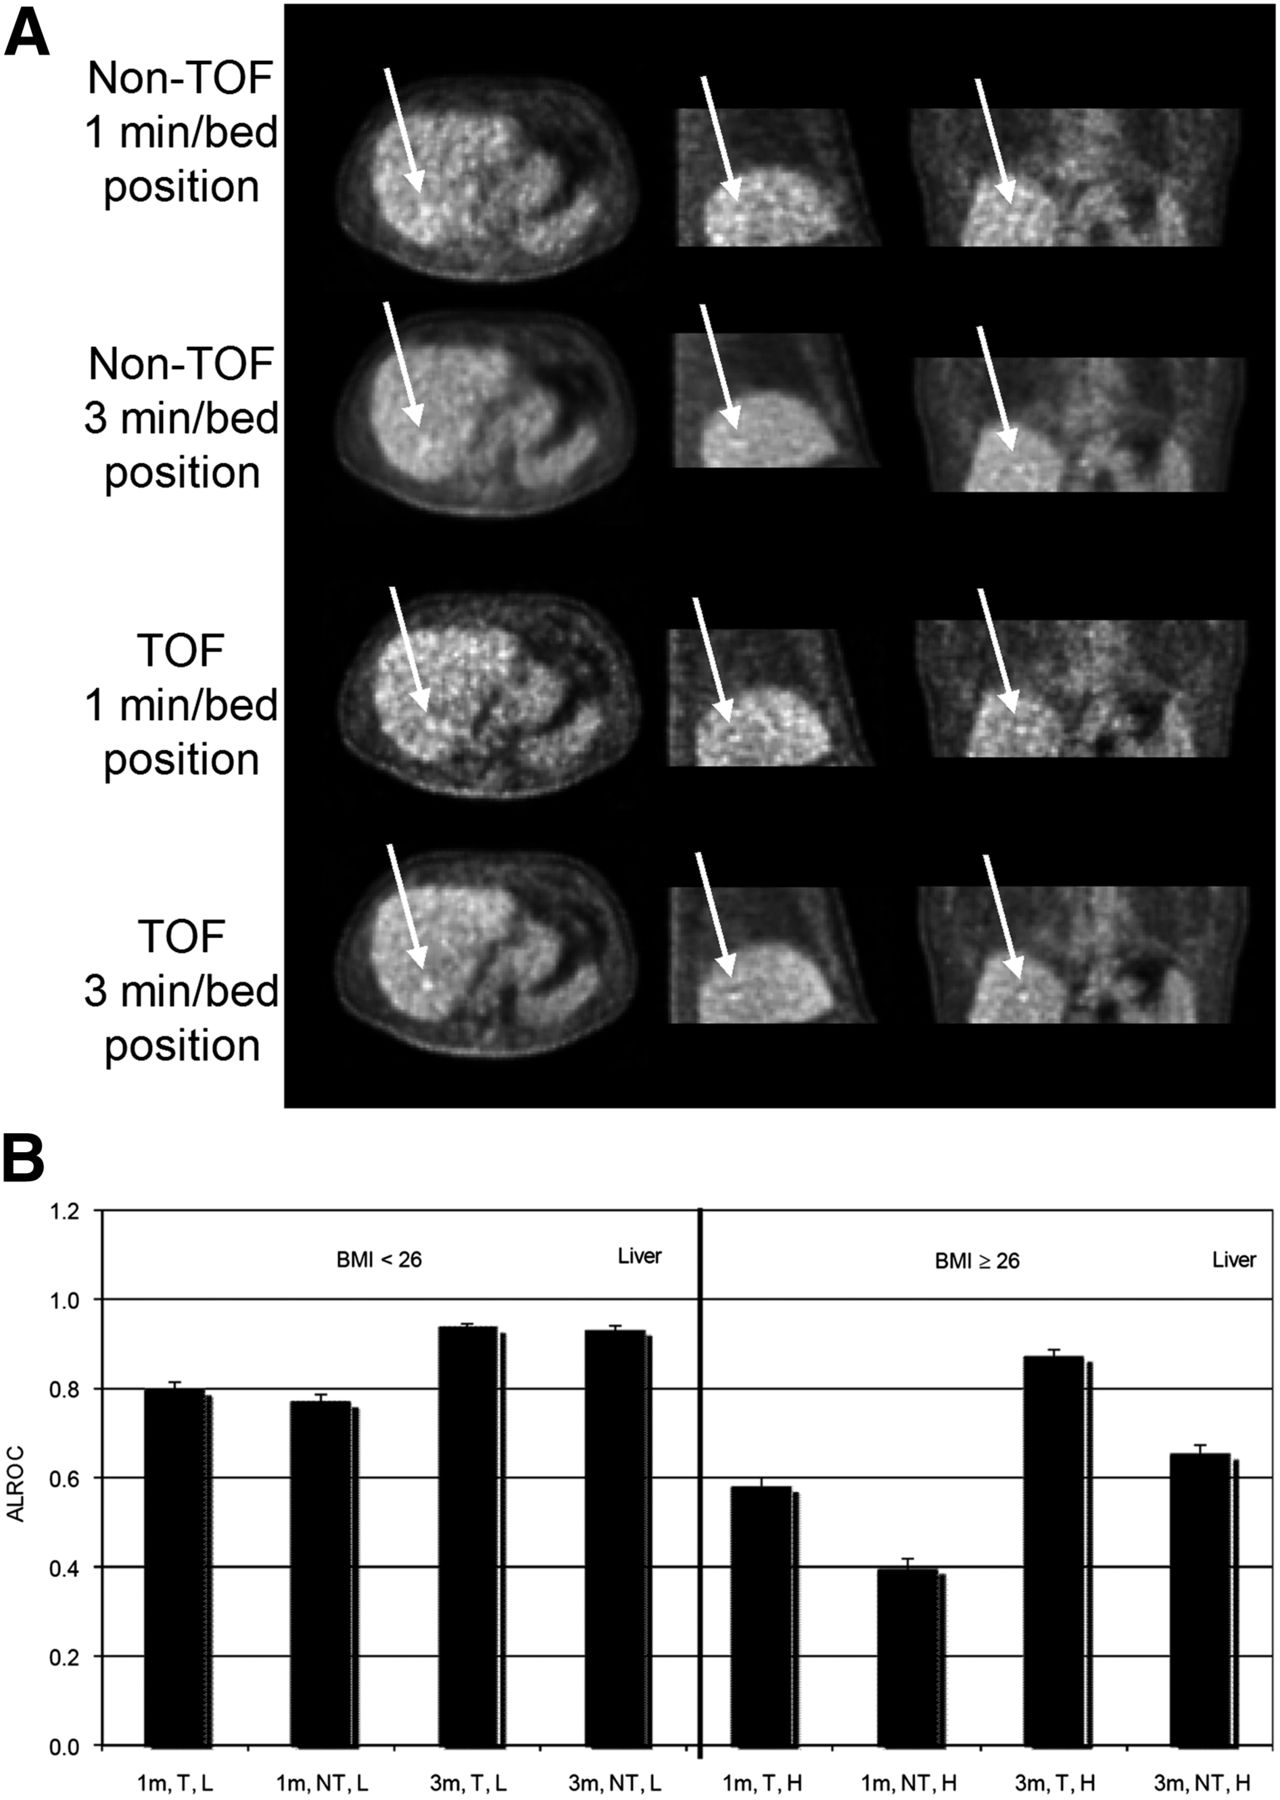
(A) Reconstructed images for patient study showing lesion synthetically inserted in liver. Arrows indicate location of inserted lesion. (B) Results for average ALROC values for liver lesions shown as function of body mass index (BMI) (labels of L for BMI < 26 and H for BMI ≥ 26), scan time (labels of 1m or 3m for scan times of 1 min and 3 min, respectively), and image reconstruction (labels of NT for non-TOF and T for TOF).
Accuracy and Precision of Lesion Uptake Measurement in Patients
The technique of synthetically added lesions to healthy-patient data before image reconstruction has also been used to quantitatively measure the benefit of TOF imaging on the accuracy and precision of lesion uptake measurements in patients (42,43). In a study performed on a research whole-body scanner with 375-ps timing resolution (44), 6 healthy volunteers were imaged, and 10-mm-diameter spheres with a 10:1 uptake ratio relative to whole-body activity concentration were inserted in the lung and liver regions. Figure 6 (43) summarizes the results from that study. Normalized uptake value (NUV) is the average lesion uptake normalized to the whole-body uptake and should equal 10 for full uptake recovery. In that study, the number of TOF and non-TOF reconstruction algorithm iterations was fixed to achieve similar image noise. As shown in Figure 6A, the average NUV was higher with TOF than non-TOF and was higher overall in the liver lesions than in the lung lesions. However, the ratio of NUV in lung to liver was less with TOF (1.48 vs. 1.85). In Figure 6B, we also see that the variability in the NUVs was always lower with TOF—over different replicates of the same lesion, over different lesions within the same organ, and over different subjects. The reduced NUV variability indicates increased precision and higher confidence in lesion uptake measurement for routine clinical studies.
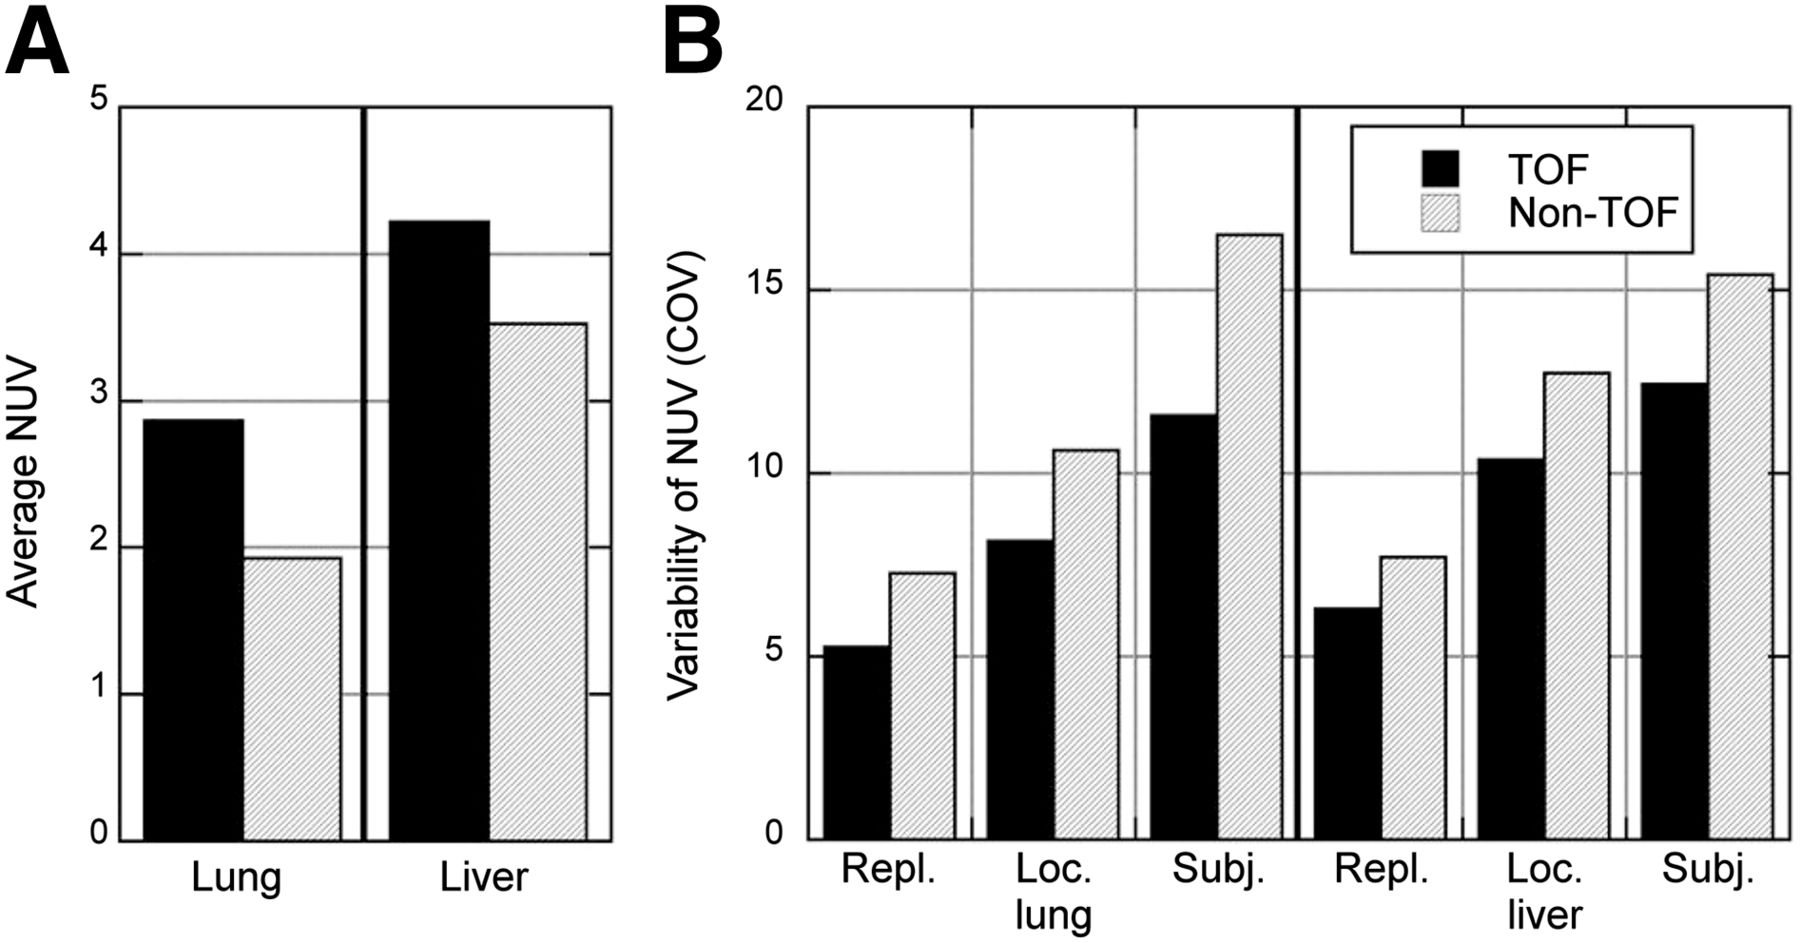
(A) Average sphere uptake or NUV measured in lung and liver. (B) Variability of sphere uptake or NUV measurement in liver and lung is shown as function of statistical replicates (Repl.), location within same organ (Loc.), and over different patients (Subj.). COV = coefficient of variation.
OTHER BENEFITS OF TOF INFORMATION IN PET IMAGING STUDIES
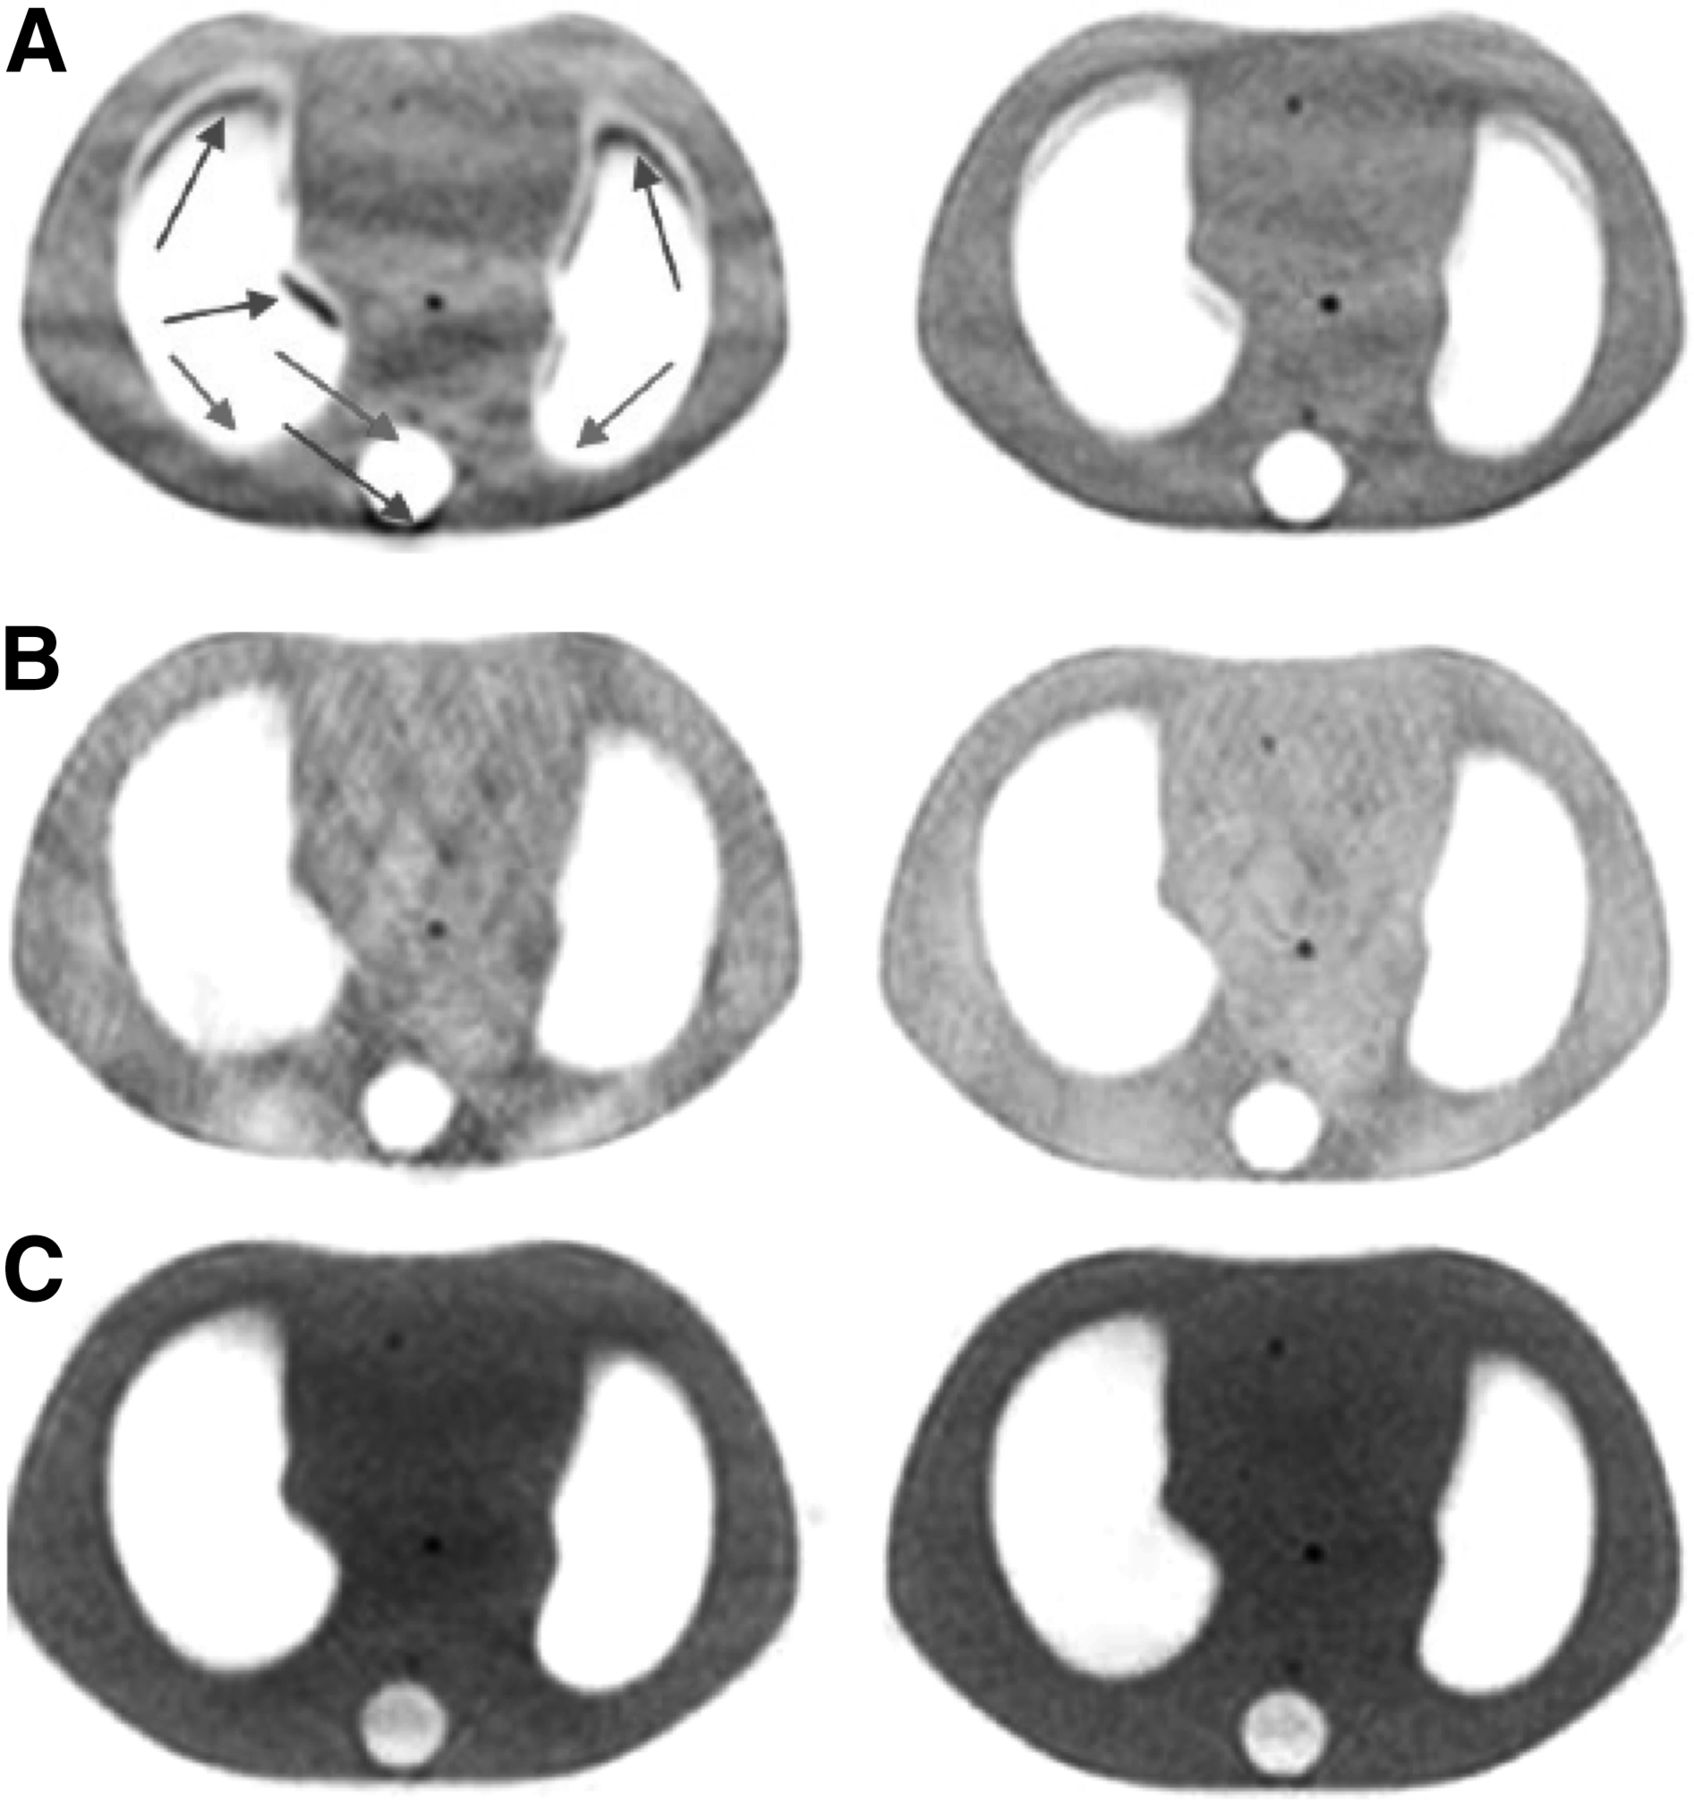
Non-TOF PET data acquired in 2-dimensional mode (with septa) collect all angular projections necessary to tomographically reconstruct the entire 3D patient volume. Fully-3D PET (no septa) was previously recognized to provide redundant information that helps improve the statistical noise properties of the reconstructed PET image. Similarly, TOF information with good timing resolution provides additional information that helps produce the consistency required in the image reconstruction process. Hence, as recognized by several groups (45,46), TOF PET images are more robust, being less sensitive to errors in data correction techniques (such as normalization, scatter correction, and attenuation correction) and leading to good image quality despite these limitations. Figure 7 (46) shows non-TOF and TOF PET images from a thorax phantom study in which the transmission image was offset from the emission image (Fig. 7A), inconsistent normalization data were used for image reconstruction (Fig. 7B), and no scatter correction was applied (Fig. 7C). These images show that TOF PET imaging is less sensitive to errors in data correction and can provide benefits in certain clinical imaging scenarios. For instance, patient motion or truncation of the attenuation map (from CT) will affect not only attenuation correction but also the scatter estimate. Precise TOF information will be useful in these scenarios to produce meaningful clinical images.

(A) Transverse non-TOF (left) and TOF (right) images of thorax phantom with shifted attenuation correction map applied to data. Arrows in non-TOF image show areas of incorrect increased (dark arrows) and decreased (light arrows) counts, leading to artifacts in image. (B) Transverse non-TOF (left) and TOF (right) images of thorax phantom with incorrect normalization applied to data. Not all 3 hot lesions are visible in non-TOF image, which also shows increased artifacts. (C) Transverse non-TOF (left) and TOF (right) images of thorax phantom with no scatter correction applied to data. (Reprinted with permission of (46).)
Another potential benefit of TOF information is in the area of limited-angle reconstruction, in which a full PET detector ring may not be available or may be impractical. This application has been evaluated though simulation studies for clinical whole-body PET (in which the cost of a PET scanner can potentially be reduced) (47), dedicated breast PET (in which 2 PET detectors can be used to image the breast in a flexible geometry) (48,49), and proton therapy (in which in-beam PET can be used to monitor the proton beam range) (50,51).
FUTURE APPLICATIONS IN LOW-COUNT IMAGING SCENARIOS
Currently, the benefits of improved imaging performance of TOF PET in the clinic have been used mainly to reduce patient imaging times or improve image quality in heavy patients. Routine clinical 18F-FDG imaging involves injection of 370−555 MBq (10–15 mCi) of the radiotracer followed by patient imaging times ranging from 0.5–2 min per bed position, depending on patient size. Improved image quality from TOF PET might be used in these routine clinical situations to perform respiratory gating with a reduced penalty of noise in the image due to a loss of counts. Another area of application in PET lies in monitoring disease progression or assessing tumor response to therapy. To perform these tasks, traditional techniques such as CT and MR imaging depend on macroscopic anatomic or morphologic changes in tumor size. By providing functional information, PET imaging can lead to early disease-assessment and help reduce treatment costs and patient morbidity from drug toxicity. Multiple PET scans are needed in this scenario, and injected patient dose becomes an important consideration. By using TOF PET to reduce injected dose, one could potentially maintain good imaging performance with moderate imaging times to obtain the multiple PET scans needed for this application. Finally, immuno-PET is a rapidly growing area that uses long-lived positron-emitting radioisotopes to label and track the localization of monoclonal antibodies (52). New studies using 89Zr- and 124I-based radiotracers to identify and determine the optimal dose for therapeutic targets such as HER2 in breast cancer (53) perform imaging at 2–4 d after injection of small (a few millicuries) doses of radiotracer. TOF PET with moderate imaging times can provide accurate, quantitative images for these applications (54).
SUMMARY
In the 1980s, the first generation of TOF PET scanners was developed and demonstrated improved SNR in the reconstructed images compared with the same scanners operated in non-TOF mode. The limited sensitivity and spatial resolution of these systems led to a migration of commercial whole-body PET scanners toward higher-sensitivity, non-TOF systems with improved spatial resolution and, eventually, even higher sensitivity with the introduction of fully-3D imaging. After the development of new, fast scintillators, which not only improved the non-TOF performance of PET but also provided TOF capability, the last decade has seen a reintroduction of TOF PET as a commercial product with 2 major technical differences from the previous generation of TOF PET scanners: the new TOF PET scanners operate in fully-3D mode without septa, and the image reconstruction algorithms are iterative 3D algorithms as opposed to 2-dimensional analytic algorithms. Consequently, the previous measures of TOF gain estimated simply as a reduction in noise (or an increase in sensitivity or SNR) become harder to apply, because the impact of scatter and random coincidences has changed and the choice of number of iterations for image reconstruction nonlinearly affects the contrast and noise in the image. The technologic differences, together with the current primary clinical application of PET in oncology, has led to use of more clinically relevant (and nonlinear) metrics to evaluate the gains in image quality due to TOF information. These image evaluation studies have demonstrated improved lesion detection and quantitative performance for routine clinical 18F-FDG imaging tasks, leading to shorter imaging times and a more uniform performance over varying patient habitus. Because of the nonlinear behavior of these metrics, assigning a single value to the gain in image quality due to TOF information is not possible, but in agreement with past work the impact of TOF information is higher for larger patients and increases with improved timing resolution. In smaller patients, although the benefit of TOF information may not be significant, one could consider using shorter scan times to achieve good-quality images. The robustness of TOF image reconstruction could also be beneficial for all patients in that small errors in data correction or patient motion will have a reduced impact on the reconstructed image. As a result, TOF PET has become a standard technology in almost all commercial systems and is used routinely for clinical and research studies.
From a hardware perspective, although achieving good timing resolution requires paying some attention to the electronics design and the type of PMT being used, the technical goals are relatively easy to achieve without significantly increasing the cost of the system. The large size of TOF PET data and the need to reconstruct images efficiently could be considered a drawback to the routine use of TOF PET, but advances in computational hardware have already made TOF PET practical, and future developments will only reduce the complexity of this task. The development of new scintillators that improve on the performance of existing systems can lead to further improvements in the system timing resolution. For example, lanthanum bromide (LaBr3) is a scintillator that has been used to develop a research whole-body PET scanner with a system timing resolution of 375 ps (44). Compared with lutetium-based scintillators (LSO or LYSO), LaBr3 has a lower detection efficiency but high light output, which leads to improved timing and energy resolution. Alternately, the used of new co-dopants such as calcium or magnesium has been shown to increase the light output and shorten the decay time of LSO (55) and leads to improved timing resolution over standard LSO (56). In addition to new scintillators, the choice of photodetector also has a big impact on the detector timing resolution. PMTs have fast timing performance and have been used in all commercial TOF PET scanners until recently. Because of PMT size limitations, PET detectors typically use some form of light-sharing method to decode crystals, which generally are about a factor of 10 smaller in size than the PMT. New silicon PMTs (SiPMs) provide fast timing performance with small detectors that allow direct one-to-one coupling to the scintillator. Because minimal or no light-sharing methods are used here, the intrinsic timing resolution of PET systems using these photodetectors will be lower. A commercial whole-body PET/CT scanner with a reported system timing resolution of 309 ps has already been developed (57). An added advantage of the SiPMs is their ability to operate within a magnetic field. With the current introduction of PET/MR scanners, SiPMs provide the only technologic solution to achieving TOF PET in a simultaneous PET/MR system. A prototype simultaneous TOF PET/MR scanner using this technology has also recently been developed and shown to achieve a 390-ps timing resolution (58). Hence, TOF PET systems with 300- to 400-ps timing resolution soon will become widespread using currently available scintillators, and it is conceivable that an even higher performance will be reached with new scintillators such as LaBr3 or calcium co-doped LSO.
In the future, TOF PET may play an important role in situations that require low-dose serial 18F-FDG imaging of patients and imaging with long-lived radioisotopes for targeted therapy. These applications require low-noise images with reduced counts that are also quantitatively accurate—an area in which TOF PET provides significant advantages. Further utilization of PET in these areas will benefit from ongoing instrumentation efforts to provide further improvements in system timing resolution, as well as more accurate data correction and image reconstruction algorithms.
Footnotes
Published online Dec. 18, 2014.
Learning Objectives: On successful completion of this activity, participants should be able to (1) understand the differences between the current generation of time-of-flight (TOF) PET scanners and the earlier generation produced in the 1980s; (2) understand that TOF information leads to bigger gains in image quality for larger patients; and (3) understand that gains in TOF image quality are task-specific but that, overall, TOF information leads to better lesion detection and uptake measurement for oncologic tasks.
Financial Disclosure: This work was supported by National Institutes of Health grants R01-CA113941 and R01-EB009056. The author of this article has indicated no other relevant relationships that could be perceived as a real or apparent conflict of interest.
CME Credit: SNMMI is accredited by the Accreditation Council for Continuing Medical Education (ACCME) to sponsor continuing education for physicians. SNMMI designates each JNM continuing education article for a maximum of 2.0 AMA PRA Category 1 Credits. Physicians should claim only credit commensurate with the extent of their participation in the activity. For CE credit, SAM, and other credit types, participants can access this activity through the SNMMI website (http://www.snmmilearningcenter.org) through January 2018.
- © 2015 by the Society of Nuclear Medicine and Molecular Imaging, Inc.
REFERENCES
- Received for publication October 2, 2014.
- Accepted for publication November 21, 2014.


Jump to section
- Article
- Abstract
- HISTORICAL BACKGROUND
- PAST ESTIMATES OF TOF GAIN
- NEW GENERATION OF TOF PET SCANNERS
- GAIN IN IMAGE SNR FROM FULLY-3D TOF PET
- BENEFIT OF MODERN TOF PET SCANNERS IN CLINICALLY RELEVANT IMAGING TASKS
- OTHER BENEFITS OF TOF INFORMATION IN PET IMAGING STUDIES
- FUTURE APPLICATIONS IN LOW-COUNT IMAGING SCENARIOS
- SUMMARY
- Footnotes
- REFERENCES
- Figures & Data
- Info & Metrics
Related Articles
Cited By...
- Hot Spot Imaging in Cardiovascular Diseases: An Information Statement from SNMMI, ASNC, and EANM
- High-Resolution Depth-Encoding PET Detector Module with Prismatoid Light-Guide Array
- The Future of Health Care and the Importance of the Nuclear Medicine Technologist
- Image Quality and Semiquantitative Measurements on the Biograph Vision PET/CT System: Initial Experiences and Comparison with the Biograph mCT
- Decoupling of Dopamine Release and Neural Activity in Major Depressive Disorder during Reward Processing Assessed by Simultaneous fPET-fMRI
- Performance Characteristics of the Digital Biograph Vision PET/CT System
- Technical Advances in Image Guidance of Radionuclide Therapy
- The Effect of Susceptibility Artifacts Related to Metallic Implants on Adjacent-Lesion Assessment in Simultaneous TOF PET/MR
- Clinical Evaluation of Zero-Echo-Time Attenuation Correction for Brain 18F-FDG PET/MRI: Comparison with Atlas Attenuation Correction
- Multi-Atlas-Based Attenuation Correction for Brain 18F-FDG PET Imaging Using a Time-of-Flight PET/MR Scanner: Comparison with Clinical Single-Atlas- and CT-Based Attenuation Correction
- The Effect of Misregistration Between CT-Attenuation and PET-Emission Images in 13N-Ammonia Myocardial PET/CT
- Clinical Assessment of Emission- and Segmentation-Based MR-Guided Attenuation Correction in Whole-Body Time-of-Flight PET/MR Imaging