


Abstract
Technologic specifications of recently introduced integrated PET/MR instrumentation, such as MR-based attenuation correction, may particularly affect brain imaging procedures. To evaluate the qualitative performance of PET/MR in clinical neuroimaging, we systematically compared results obtained with integrated PET/MR with conventional PET/CT in the same patients examined for assessment of cognitive impairment. Methods: Thirty patients underwent a single-injection (18F-FDG), dual-imaging protocol including PET/CT and integrated PET/MR imaging in randomized order. Attenuation and scatter correction were performed using low-dose CT for the PET/CT and segmented Dixon MR imaging data for the PET/MR. Differences between PET/MR and PET/CT were assessed via region-of-interest (ROI)–based and voxel-based statistical group comparison. Analyses involved attenuation-corrected (AC) and non–attenuation-corrected (NAC) data. Individual PET/MR and PET/CT datasets were compared versus a predefined independent control population, using 3-dimensional stereotactic surface projections. Results: Generally, lower measured PET signal values were obtained throughout the brain in ROI-based quantification of the PET signal for PET/MR as compared with PET/CT in AC and NAC data, independently of the scan order. After elimination of global effects, voxel-based and ROI-based group comparison still revealed significantly lower relative tracer signal in PET/MR images in frontoparietal portions of the neocortex but significantly higher relative signal in subcortical and basal regions of the brain than the corresponding PET/CT images of the AC data. In the corresponding NAC images, the discrepancies in frontoparietal portions of the neocortex were diminished, but the subcortical overestimation of tracer intensity by PET/MR persisted. Conclusion: Considerable region-dependent differences were observed between brain imaging data acquired on the PET/MR, compared with corresponding PET/CT images, in patients evaluated for neurodegenerative disorders. These findings may only in part be explained by inconsistencies in the attenuation-correction procedures. The observed differences may interfere with semiquantitative evaluation and with individual qualitative clinical assessment and they need to be considered, for example, for clinical trials. Improved attenuation-correction algorithms and a PET/MR-specific healthy control database are recommended for reliable and consistent application of PET/MR for clinical neuroimaging.
Because of their high prevalence in the aging population, dementing disorders such as Alzheimer disease (AD) increasingly represent a most serious medical and socioeconomic issue. With regard to new and specific treatment strategies (e.g., immunization, secretase blockers), early and reliable differential diagnosis is gaining importance (1). Moreover, new therapeutic approaches will require reliable tools for monitoring treatment success. Because of the relatively low sensitivity and specificity of mere neuropsychologic evaluation (2) and the limited accessibility of brain tissue for histopathologic analysis (3), neuroimaging procedures may play an important complementary role (4), possibly offering the closest in vivo reflection of disease progress when put in clinical context (5).
According to current guidelines, structural imaging is recommended to exclude nonneurodegenerative causes of cognitive impairment (2,6) and also allows the assessment of brain atrophy. Concerning the excellent soft-tissue contrast, MR imaging is clearly superior to CT for this purpose. However, brain atrophy is considered a relatively late phenomenon in the progress of neurodegeneration, and atrophy patterns may be overlapping between the different neurodegenerative disorders (3,7). In contrast, functional imaging procedures such as 18F-FDG PET have demonstrated reliable differential diagnosis between AD and other forms of neurodegenerative disorders and show performance superior to MR imaging with regard to prediction of AD in predementia stages such as mild cognitive impairment (4,8,9). Recently, new PET molecular imaging markers for in vivo detection of β-amyloid aggregates in the brain have been introduced (10–12), which may also be of high value in dementia assessment. However, amyloid imaging has certain limitations, such as the high rates of amyloid-positive elderly healthy individuals (~20%–30%) (13), and 18F-FDG PET may still be considered a well-established diagnostic tool with a broad clinical applicability in the diagnostic work-up of dementia.
Simultaneous acquisition of 18F-FDG PET and MR data in 1 integrated PET/MR scanner may potentially represent a method of choice for dementia assessment. Not only will an integrated scanner allow an optimal coregistration and atrophy correction of the PET data, but it could also facilitate correction of patient motion (2) and may provide better patient comfort and optimized logistics (14).
The different scanner technology of this device, such as the avalanche photodiodes, the scanner geometry, the need for an MR head coil, and the lack of CT data for attenuation correction, may, however, influence image quality and, hence, the diagnostic accuracy. At present, attenuation correction using a segmented 2-point Dixon MR imaging sequence is considered the standard method in processing PET data obtained from the fully integrated PET/MR. This method relies on the MR-based tissue segmentation for the calculation of a μ-map for attenuation correction, but it ignores the specific contribution of bone to photon attenuation, which is why PET/MR brain imaging may be particularly error-prone (15).
Veit-Haibach et al. recently highlighted the potential of a sequential trimodality PET/CT/MR system in comparison to fully integrated PET/MR (16). They argued that the higher logistic flexibility in a routine clinical environment and the possibility of the up-to-date, more reliable CT-based attenuation correction outweigh advantages of a simultaneous system. However, they acknowledged that a sequential system currently is not suited for relevant application in neuroimaging because of rather long examination times.
Several studies have already demonstrated that the technical performance of integrated PET/MR imaging generally compares favorably with conventional PET/CT regarding detection of lesions in whole-body oncologic studies (17–19). However, these focused only on PET findings outside the brain, which may not allow direct conclusions on diagnostic potential in neuroimaging to be drawn.
Therefore, the aim of this study was to evaluate integrated whole-body PET/MR imaging (using segmented Dixon MR-based attenuation correction) for the diagnosis of neurodegenerative disorders by systematical comparison to conventional PET/CT data in the same patients.
MATERIALS AND METHODS
Patient Population
Patients were collected chronologically out of a pool of subjects with cognitive impairment, who, based on clinical evaluation, were suspected of having AD. They had been referred to our institute from the University Department of Psychiatry and Psychotherapy and from external partners for clinical routine 18F-FDG PET brain examination. Only patients referred from specialists with documented expertise in neuropsychiatry were accepted to ensure validity of the indication for a clinical 18F-FDG PET examination. Further inclusion criteria were informed consent and the ability to undergo 2 PET examinations. Exclusion criteria were pregnancy, age below 18 y, and standard contraindications for MR imaging examinations (e.g., magnetic metal implants, pacemakers). Furthermore, patients with potential reasons other than neurodegenerative disorders for their cognitive impairment (substance abuse, brain tumors, stroke, trauma, or psychiatric disorders such as schizophrenia) were excluded to minimize heterogeneity of the data. We also did not include patients undergoing diagnostic CT with application of intravenous contrast agents to ensure homogeneity in the datasets used for CT-based attenuation correction. The collected population consisted of 10 men and 20 women with a median age of 64 y (Tables 1 and 2). The research protocol was approved by an institutional review board (Ethics Committee) and the radiation protection authorities and was performed according to the latest version of the Declaration of Helsinki. All subjects signed a written informed consent form.
Patients’ Characteristics
Study Characteristics
General Imaging Protocol
All subjects underwent a single-injection, dual-imaging protocol including PET/CT (Biograph Sensation 64; Siemens AG—Healthcare Sector) and PET/MR (Biograph mMR; Siemens AG—Healthcare Sector) in a randomized sequence of examinations to eliminate order effects resulting from radioactivity decay and tracer kinetics. Two groups with equal shares of patients, who underwent either PET/CT or PET/MR first, were collected. After completion of their first scan, patients were subsequently positioned on either the PET/CT or the PET/MR scanner with the smallest possible temporal delay. Consequently, this approach did not require another injection of 18F-FDG and was therefore not associated with any additional radiation exposure.
PET/CT and PET/MR Acquisition
Preparation
Patients were supposed to fast for at least 6 h before undergoing scanning. Their blood glucose levels were measured just before tracer injection to ensure values below 150 mg/dL. Although the aim was for a standardized dose of 185 MBq of 18F-FDG (for a body weight of 75 kg), the dose was weight-adapted individually. In this collective, a mean of 203 ± 8 MBq of 18F-FDG was injected intravenously, with no application of contrast agents. The acquisition of the first scan was started at 32 ± 4 min and the second at 69 ± 10 min after injection. To ensure a precise alignment of the image data between the 2 subsequent scans, the head position was arranged to be as similar as possible in both examinations.
PET/CT Acquisition and Instrumentation
The PET/CT scan followed the standard clinical protocol for neurologic diagnostics on a PET/CT scanning device as previously reported (20).
The patient’s head was positioned in a plug-on-type head support device and fixed by straps. A single-bed-position PET scan was acquired for 15 min in list mode. Additionally, for attenuation and scatter correction, a low-dose CT scan (120 keV, 25 mAs care dose) was obtained.
PET/MR Acquisition and Instrumentation
We acquired PET/MR data on a fully integrated whole-body PET/MR scanning device. This system includes a 3-T MR imaging scanner, featuring high-performance gradient systems (45 mT/m) and a slew rate of 200 T/m/s. A fully functional PET system, based on the avalanche photodiode technology, is integrated in the scanner gantry (21).
The patient’s head was located in a support device on the examination table and covered with a specific head coil. Image acquisition included the following steps: first, a localizer MR imaging scan was obtained to define the bed position (localizer turbo). After correct positioning, the combined PET/MR acquisition was initiated. For the purpose of generating an attenuation map (μ-map), a coronal 2-point Dixon 3-dimensional volumetric interpolated T1-weighted MR imaging sequence was acquired as previously described (15,18).
The PET scan on the PET/MR scanner was obtained in analogy to the PET/CT scan with a list-mode acquisition time of 15 min at a single bed position.
The supplemental data provide further technical details on both scanners and the corresponding acquisition procedures (supplemental materials are available at http://jnm.snmjournals.org).
Data Processing and Reconstruction
Both scanners were calibrated daily with a cylindric 68 phantom (GE Healthcare) placed centrally in the field of view according to criteria of the National Electrical Manufacturers Association (17). To obtain comparable PET data between both scanners, analogous reconstruction algorithms were applied using the software Syngo CT 2009A for PET/CT and Syngo MR B18P 2010 (both Siemens AC—Healthcare Sector) for PET/MR (supplemental data). Emission data were corrected for randoms, dead time, scatter, and attenuation for both systems. For both PET/CT and PET/MR, a filtered backprojection reconstruction algorithm (Hamming 3.0 list-mode) with a zoom of 2.5 and gaussian smoothing of 3 mm in full width at half maximum was applied. For the purpose of attenuation and scatter correction of the PET data acquired on the PET/CT scanner, conversion of spatially aligned low-dose CT data from Hounsfield units to attenuation factors at 511 keV was performed (22) using integrated postprocessing software (23). For attenuation correction of the PET/MR data, MR-based tissue segmentation was performed as implemented by the manufacturer (15,18). An attenuation map (μ-map) was created based on a 2-point Dixon MR imaging sequence obtained for 1 bed position, with segmentation into 4 classes of tissue (background, lungs, fat, and soft tissue) (15,18). Artifacts caused by the absence of MR imaging signal (i.e., cortical bone tissue) are adjusted via a morphologic closing filter (5 mm in each spatial direction) to the binary tissue–air image (15). Attenuating factors such as the fixed head coil and the examination table are incorporated in the attenuation-correction algorithm (17).
Image Analysis
Image analysis was accomplished in the following 3 steps.
Voxel-Based Statistical Group Comparison
First, we performed voxel-based statistical group analysis using SPM5 (Wellcome Trust Centre for Neuroimaging, UCL) to identify systematic statistical differences in the relative tracer distribution between PET/MR and PET/CT data. Group comparison was performed without a priori hypothesis between PET/MR and PET/CT data of identical individuals using the attenuation-corrected (AC) and the non–attenuation-corrected (NAC) data. To enable statistical comparison, basic image processing was necessary, including stereotactic normalization and smoothing in analogy to similar, previously published studies (supplemental data) (24,25). To allow comparison of the relative tracer distribution patterns between PET/CT and PET/MR, signal intensities of both modalities were normalized to the global mean as determined for each collective. As a statistical model, we chose a paired t test (dependent samples). A threshold of P less than 0.05, false discovery rate–corrected for multiple comparisons, and a threshold for minimum spatial extent of 20 contiguous voxels throughout all PET analyses were chosen, as previously reported (24).
Region-of-Interest (ROI)–Based Semiquantitative Analysis
To gain insight into the magnitude of differences between PET/CT and PET/MR findings and to validate the differences observed by voxel-based comparison, an ROI-based analysis was performed. A series of standardized anatomic ROIs based on the automated anatomical labeling (AAL) template (http://fmri.wfubmc.edu/software/PickAtlas) was defined, including the basal ganglia, pons, temporal, parietal, sensorimotor, frontal, and occipital regions of the brain. The MarsBaR toolbox (http://marsbar.sourceforge.net/about.html) was used for ROI evaluation within SPM5 as described previously (24). Mean individual 18F-FDG uptake from all voxels within the predefined ROIs was extracted from SPM-preprocessed data (i.e., realigned, stereotactically normalized, smoothed, and unscaled data) and used for statistical comparison between PET/MR and PET/CT data. To eliminate global effects and allow the identification of relative differences in regional distribution, the measured values in each ROI were scaled to the global mean value as determined for each individual (adding all AAL template ROIs). These normalized values were then used to calculate relative percentage differences between the regional values obtained in PET/MR and PET/CT data.
Individual Visual-Qualitative Rating
Last, an individual visual evaluation of the scans was performed, to visualize potential clinical effects of the systematic differences between PET/CT and PET/MR on a single-subject basis. To minimize observer-dependent effects, the PET image data of 29 subjects (with 1 drop-out due to failure of stereotactic normalization of the program) were analyzed in the form of 3-dimensional stereotactic surface projections (3DSSPs) and corresponding z score images (comparison of individual data with a control population). This approach has been demonstrated to be highly standardized and less susceptible to the level of experience of the raters (26). For this purpose, a fully automated image analysis software (Neurostat; University of Michigan) was used. As for the SPM analysis, we selected the global mean value as a reference for quantitative normalization of the data to ensure comparability. The exact processing algorithm of this software has been described and evaluated previously for diagnosis of dementia (26,27). Clinical rating of the generated individual 3DSSPs was performed by 4 observers and inter- and intraobserver reliability was examined (further details on the methods and results of this analysis are provided in the supplemental data).
Phantom Study
To complement the clinical data, a phantom study was performed using a Hoffman brain phantom on both scanners (details and results are provided in the supplemental data).
RESULTS
Patients
All included patients were able to finish the single-injection/dual-imaging protocol. None of the subjects reported any irregular events during PET/CT or PET/MR acquisition, and no scans had to be removed because of major movement or incompliance during acquisition.
Image Analysis
Voxel-Based Group Comparison with SPM5
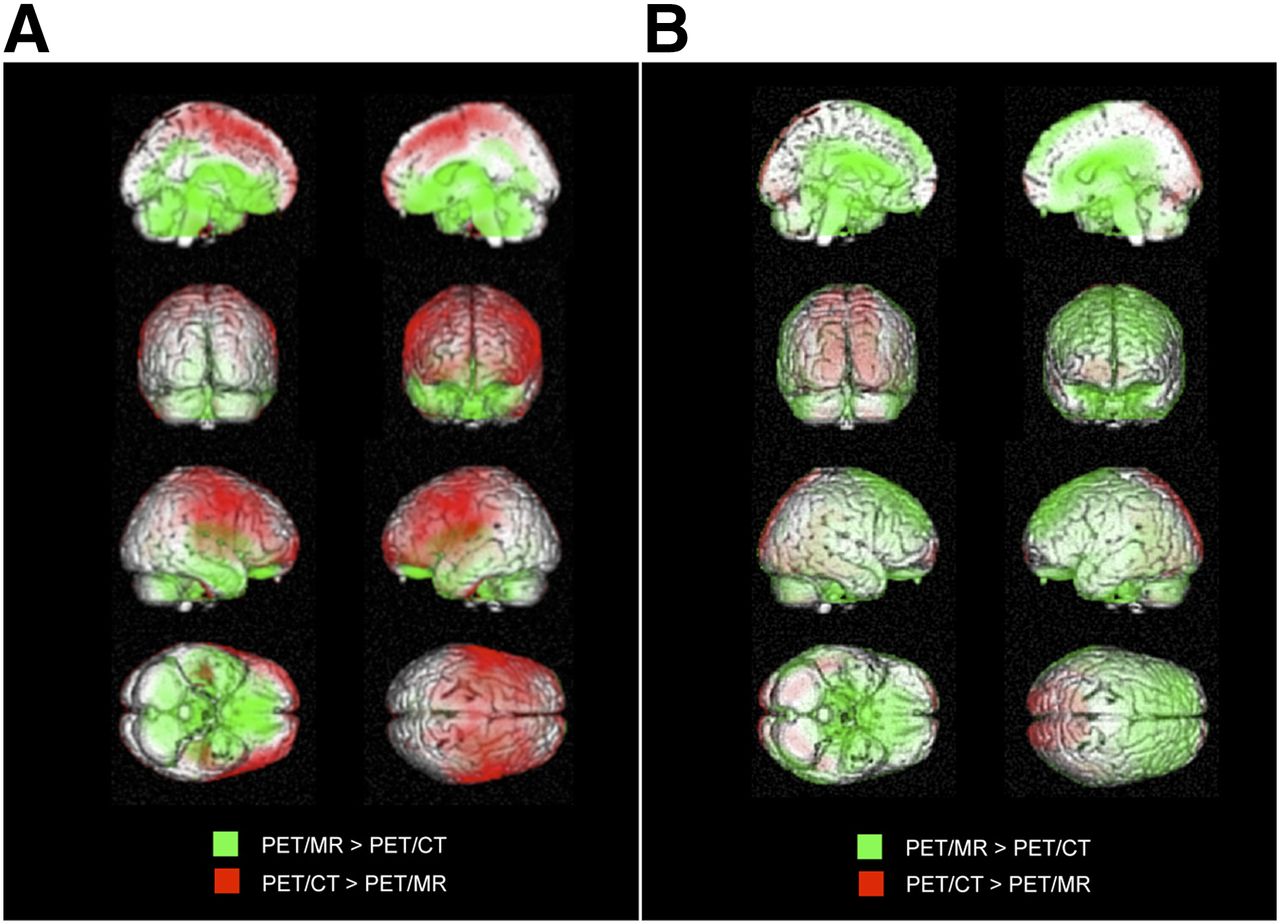
The statistical group comparison with SPM5 revealed tracer signal that was significantly lower in frontoparietal portions of the neocortex in AC PET/MR images than in prefrontal, sensorimotor, and parietal cortices as well as medial frontal gyri regions in AC PET/CT images (Fig. 1). The Montreal Neurological Institute coordinates of the local maximum of each cluster converted into Talairach coordinates, along with the T values, P values, and associated Broca Areals, are listed in tables in the supplemental data.

Voxel-based group comparison reveals statistically significant differences in measured regional activity in AC (left) and NAC (right) data between PET/MR and PET/CT. For display, green was used for relatively higher measured PET signal in PET/MR than PET/CT (extent threshold in AC, T = 2.50, P < 0.05, false discovery rate–corrected; in NAC, T = 2.05, P < 0.05, false discovery rate–corrected), and red represented relatively higher measured PET signal in PET/CT (extent threshold in AC, T = 2.12, P < 0.05, false discovery rate–corrected; in NAC, T = 2.77, P < 0.05, false discovery rate–corrected).
On the other hand, AC PET/MR images showed a significantly higher relative tracer signal in subcortical and basal regions of the brain—including anterior and posterior cingulate gyri, the basal ganglia (putamen, thalamus), hypothalamus, pons, cerebellum, and inferior frontal cortices—when compared with the corresponding AC PET/CT images (Fig. 1).
In the statistical voxel-based comparison between non-AC and non–scatter-corrected PET/CT and PET/MR images, the extended reductions of frontoparietal PET signal observed in the AC PET/MR data were not reproducible to the same extent. Less distinct reductions were observed in the parasagittal and occipital areas of the brain in NAC PET/MR as compared with NAC PET/CT, whereas a few clusters with higher activity in PET/MR occurred in the bilateral frontal cortex (Fig. 1).
However, in analogy to the AC PET/MR data, relatively increased signal was still observed in subcortical and basal regions of the brain, including basal ganglia, pons, cerebellum, and central cortices (Fig. 1).
Individual ROI-Based Analysis in SPM5
The ROI-based assessment of measured signal intensity in a series of predefined anatomic brain regions revealed significantly lower values in the unscaled data acquired on the PET/MR scanner, independently of the order of measurements (i.e., performed before or after PET/CT). This effect was present in all anatomic regions of the brain but to a different degree. The difference was present in both AC and NAC data; however, the magnitude of deviation of PET/MR from PET/CT was significantly greater in AC data, as compared with NAC data, for all ROIs (Fig. 2). Central and subcortical regions of the brain (i.e., pons, basal ganglia) were less affected than peripheral and cortical regions, such as parietal cortex or sensorimotor cortex.
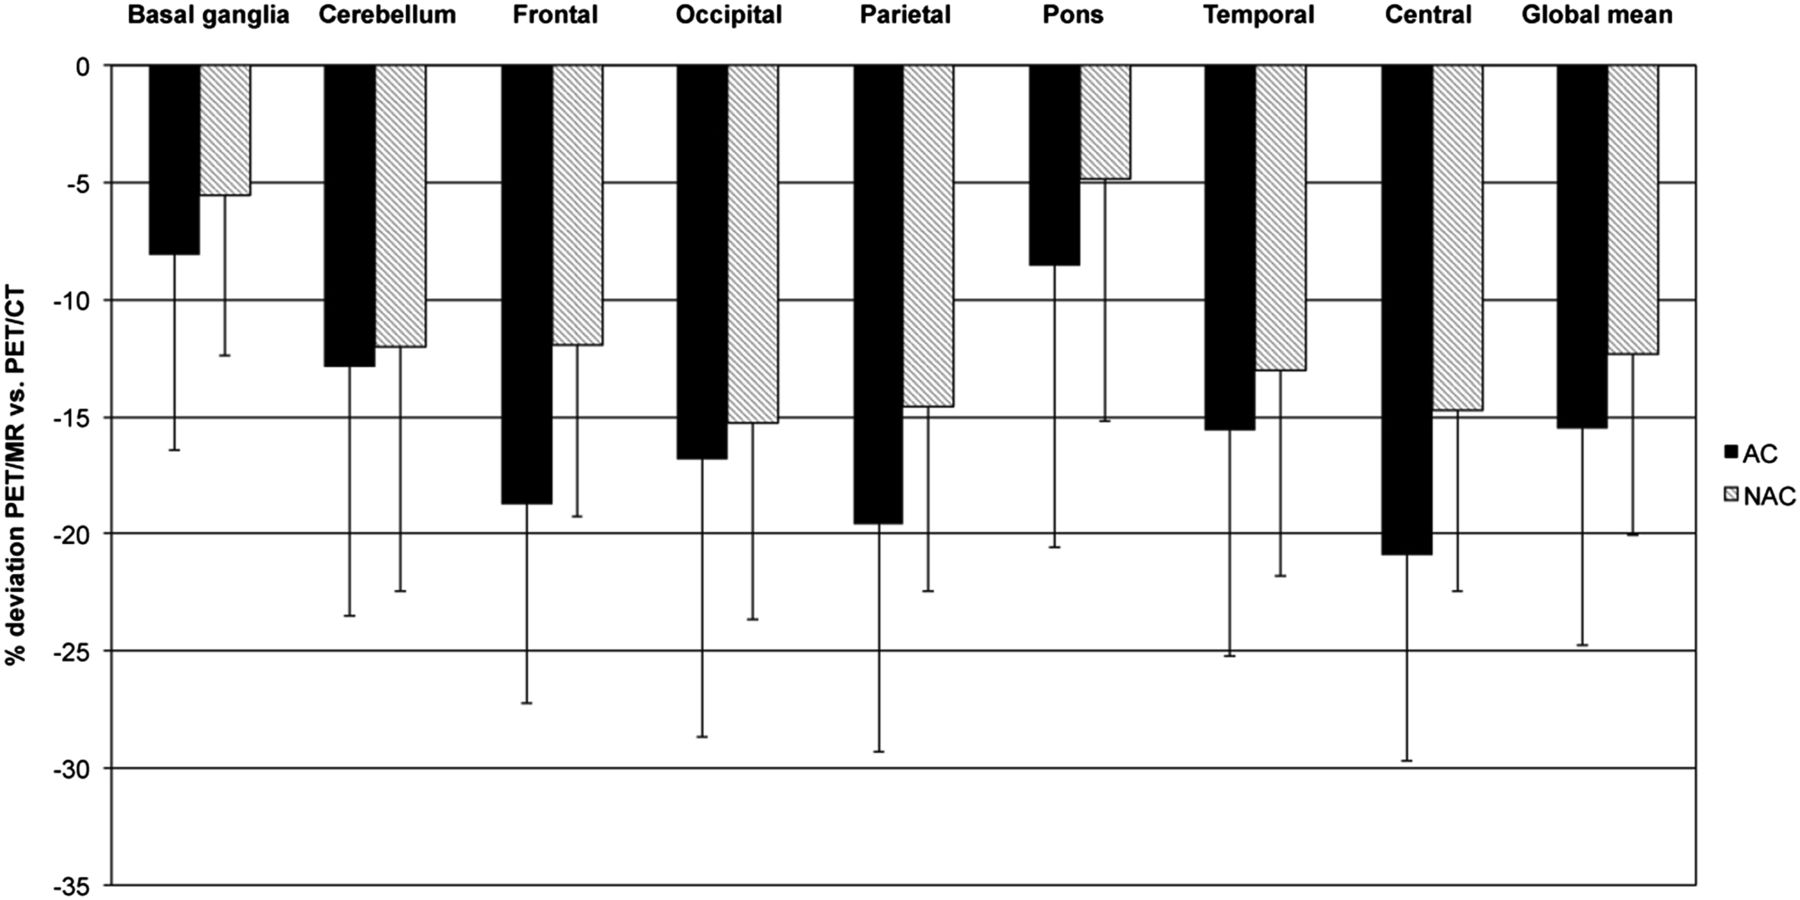
Percentage differences of values in different anatomic regions by ROI-based analysis. Error bars indicate SD.
After scaling and quantitative normalization to the individual global mean, the ROI-based analysis revealed the results displayed in Table 3 and Figure 3.
ROI Analysis
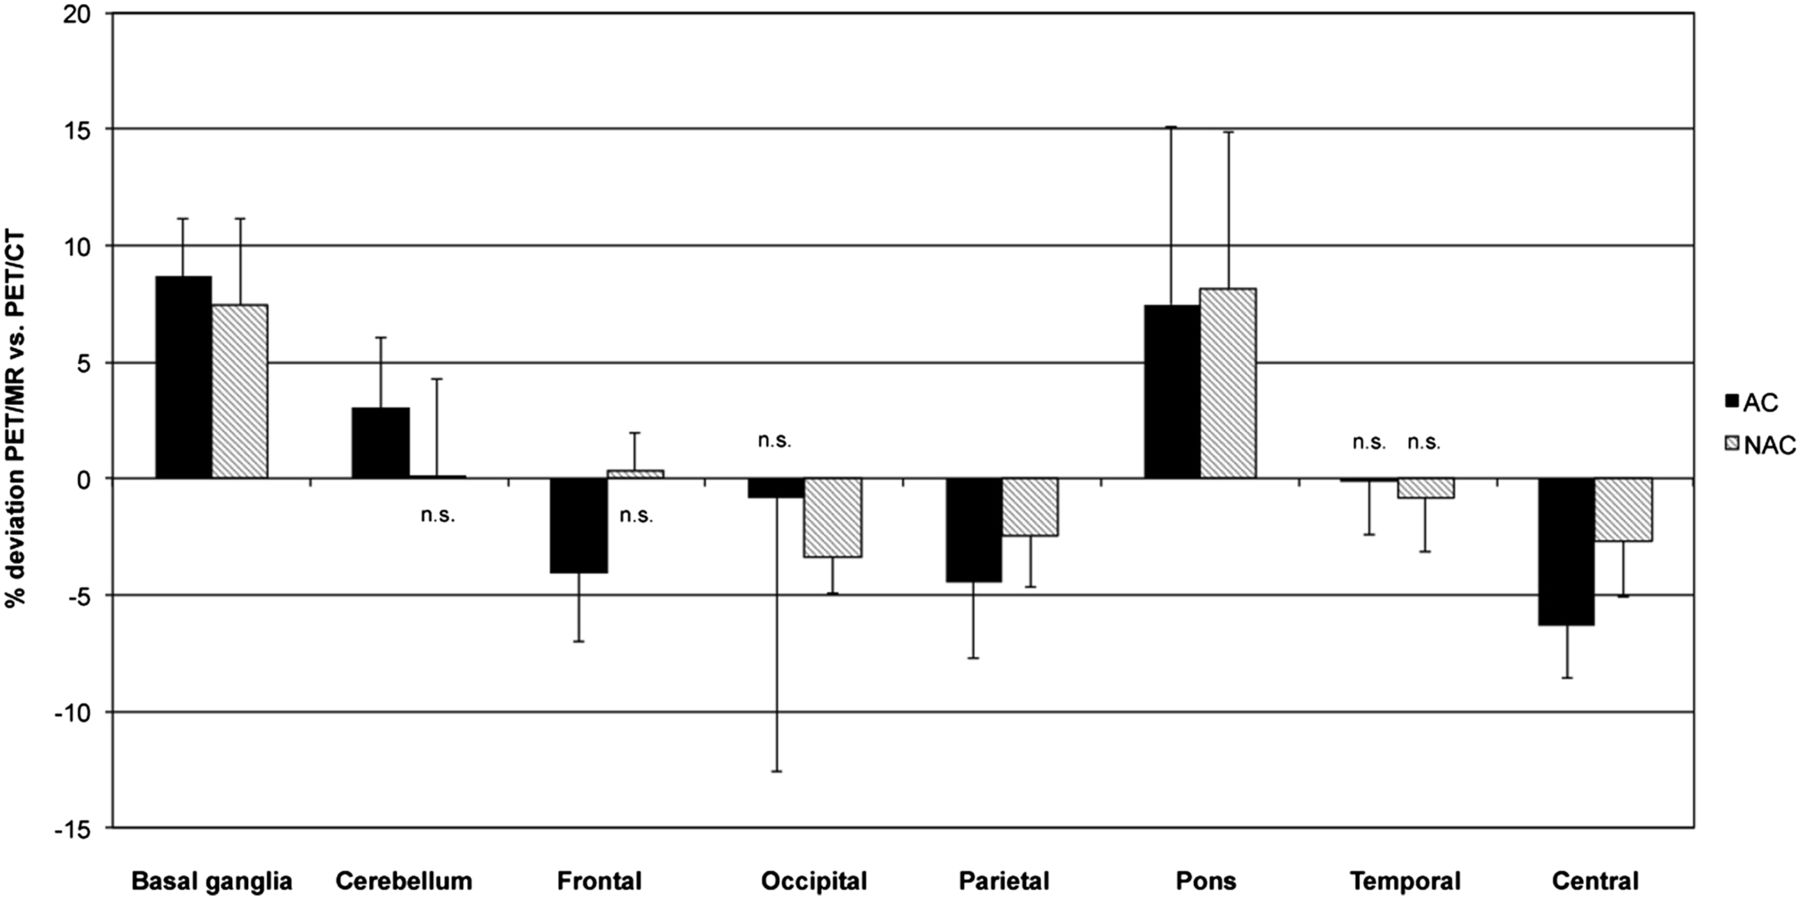
Percentage differences of values in different anatomic regions by ROI-based analysis in data corrected for global differences. Error bars indicate SD. n.s. = no significant difference between PET/MR and PET/CT.
In good correspondence with the voxel-based approach, this analysis demonstrated that significant differences between PET/MR and PET/CT data remained present even after normalization to the global mean. The strongest negative deviation was observed in the sensorimotor cortical regions, with PET/MR attenuation correction revealing 6.33% lower values than PET/CT attenuation correction. The strongest positive deviation was found in the basal ganglia, with 8.66% higher values in PET/MR attenuation correction than PET/CT attenuation correction. The only regions showing no significant difference between PET/MR and PET/CT in AC data were the temporal and occipital cortex.
In the ROI-based comparison of the NAC, but scaled, data, the negative deviation of values measured with PET/MR NAC as compared with PET/CT in the sensorimotor cortex was less obvious. However, similar to the AC data, an apparent overestimation of PET/MR versus PET/CT was still observed in the subcortical brain regions—that is, in the pons (8.13%) and basal ganglia (7.41%). Regions not showing a significant difference between PET/MR and PET/CT in NAC data were the cerebellum, frontal, and temporal cortex.
Individual 3DSSP Analysis and Clinical Assessment
On visual assessment of 3DSSP and z score images, differences between single-subject PET/CT and PET/MR images were apparent. As expected, patterns of hypometabolism generally appeared more pronounced in the scans obtained second, independently of the modality. However, independently of the sequence of scans, more extended cortical patterns of abnormality were observed in the PET/MR scans (as highlighted in a typical example [Fig. 4]). Thus, the differences observed in group-based analyses were also reproducible for the individual subject. Furthermore, clinical reads demonstrated that these discrepancies may influence clinical qualitative assessment to some extent (supplemental data).

Patient 1 (PET/CT first): 3DSSPs generated by Neurostat after anatomic stereotactic normalization of same patient examined with PET/CT (A) and PET/MR (B). 3DSSPs of individual patient’s 18F-FDG PET data (upper) and pixelwise comparison of individual patient’s PET data to age-matched reference database, resulting in z score images (high z score = significantly reduced glucose metabolism; reference region: global mean) (lower). Compared with PET/CT, lower relative metabolic rate can be observed in frontoparietal portions of neocortex in PET/MR data on 3DSSP images (red arrows). On z score images, relatively stronger deviations from control are detected (green arrows) for PET/MR data.
Phantom Study
Additional phantom-based experiments indicate that the abovementioned differences observed between the 2 scanners seem to be restricted to examinations in human subjects—that is, a situation involving potential attenuation by cortical bone and cross-contamination with signal from below the head (supplemental data).
DISCUSSION
In summary, 18F-FDG brain PET measurements revealed significantly lower values throughout the brain with PET/MR than with conventional PET/CT in the same patients. This effect was present for all regions of the brain but regionally heterogeneous. The differences were stronger in the AC data, indicating an effect of the different attenuation-correction algorithms of the 2 modalities (Dixon MR imaging–based for PET/MR and low-dose CT-based for PET/CT). Even after elimination of global effects, voxel- and ROI-based analyses still confirmed significant differences in the relative tracer distribution patterns obtained by PET/MR and PET/CT. Some of the observed differences persisted in the NAC data, and they also seemed to have an impact on clinical grading of patients to some extent, as demonstrated by the intraobserver comparison.
At least part of the detected discrepancies observed with PET/MR brain imaging as compared with PET/CT may be assigned to the different attenuation-correction approaches. Since the advent of hybrid PET/CT, low-dose CT-based attenuation correction is the most commonly applied procedure (28) and has demonstrated a good reproducibility, as compared with transmission source–based algorithms (29). Also, CT-based attenuation correction shows some limitations, but it has been discussed to represent a silver standard of truth (30).
Regarding the PET/MR scanner used in the current study, a Dixon MR-based attenuation-correction algorithm is implemented from the manufacturer as the standard attenuation-correction routine. Our group was able to demonstrate that this approach may be applied with satisfying success in the whole body, with regard to standardized uptake value quantification of 18F-FDG PET data (15) and reproducibility of clinical assessment in patients with oncologic diseases (19). However, these previous studies were not designed to detect particular problems of PET/MR brain imaging, such as the presence of head coils and of attenuation effects induced by skull bone surrounding the brain. These problems raise the question whether the Dixon attenuation-correction approach can be applied also for brain imaging, despite the problems already demonstrated in previous studies (30). The clinical impact of such a strategy has not been previously addressed.
With regard to the constitution of the skull, the Dixon MR data are segmented into background, lung, fat, and soft tissue for the calculation of a μ-map for attenuation correction. Thus, it does not accurately reflect the distribution of air-filled cavities and bone in the skull. Correspondingly, a previous study by Catana et al., using phantom simulations and experimental measurements in the brain PET insert PET/MR prototype, was able to demonstrate that the incorrect assessment of attenuation induced by bone tissue may lead to underestimations (20%) of the cortical radiotracer accumulation and that the nonidentification of internal air cavities may result in large overestimations (20%) in adjacent structures (30). Despite the fact that these data have been acquired on a different scanner type, the results correspond to our data in part, at least regarding the underestimation of frontoparietal portions of the neocortex in PET/MR when using Dixon MR-based attenuation correction, which may be due to incorrect assessment of the cranial bone. This finding supports the notion that incorrect attenuation correction may indeed induce part of the differences detected in our study. This hypothesis is further underpinned by a study of Andersen et al., who also found an underestimation of 18F-FDG brain PET data acquired on the integrated PET/MR scanner as compared with conventional PET/CT in a phantom study. This difference was removed when information about bone distribution was added to the MR attenuation-correction algorithm. The authors observed a substantial radial dependency (−25% in cortical regions and −10% in central regions) and argued that photons emitted by peripheral (close to the skull) regions travel a relatively longer tangential path through bone than photons emitted by more central regions of the brain (31). This effect may well be related also to the effects observed in our study. In particular, our finding that attenuation correction increased the discrepancies between PET/MR and PET/CT more distinctly in cortical than in subcortical regions could be explained by this proposition. It is somewhat more difficult to explain our finding that signal underestimation in PET/MR seems to be less pronounced in temporal as compared with sensorimotor cortical regions (Fig. 2). Again, the tracer signals from more central portions of the temporal cortex (anatomically winding toward the brain center) may take a more orthogonal way through the surrounding bone, as compared with the cortical ribbon located closer to the bone (e.g., in the sensorimotor cortex), and thus experience less bone-induced attenuation. More importantly, the diameter of the cortical bone lateral to the temporal lobes is indeed frequently less as compared with the skull surrounding more cranial portions of the brain (such as the sensorimotor cortex), which may explain why less effects, related to bone attenuation, occur in this brain region.
The fact that no major differences were observed between the PET/CT and PET/MR image data acquired in our additional phantom study supports the notion that attenuation effects induced by cortical bone and potential cross-contamination from regions below the head (both factors are nonexistent in the phantom) may be responsible for some of our findings (supplemental data).
Several alternative attenuation-correction approaches for brain PET/MR have already been suggested. Hofmann et al. introduced an approach combining pattern recognition and atlas registration for calculation of an attenuation-correction map, which, however, may be too time-consuming for routine clinical application (32,33). Another option may be the employment of a dual-echo ultrashort echo time (DUTE) MR imaging sequence, which allows an approximation of bone and air cavities in the skull (30,34,35). However, previous studies indicate that the currently available DUTE-based attenuation-correction approaches may still be prone to random errors and may require further optimization and systematic evaluation before they can be considered sufficiently validated for clinical application (30).
Although much of the deviations from PET/CT observed in the PET/MR brain imaging data in our study may be explained by differences in the attenuation-correction, algorithm, we also found discrepancies between PET/MR and PET/CT in the NAC data, suggesting potential NAC-related effects. In general, these discrepancies were somewhat less distinct but still regionally heterogeneous, thus not representing a global scaling error. Consistently, we observed systematic regional differences between PET/MR and PET/CT even after elimination of global differences also in the NAC data (see below). Whereas these findings cannot be directly explained by different attenuation-correction procedures, they may still represent a consequence of different attenuating factors present in the PET/MR scanner as opposed to the PET/CT, for example, the head coil and the different examination table. These factors may introduce variance in the NAC PET data, which, despite incorporation into the reconstruction algorithm, may also survive attenuation correction to some extent. Furthermore, the observed effects may represent a consequence of other general differences in scanner geometry, in detector technology, in scatter characteristics, or of the patient position in the scanner. Particularly, the larger field of view of the PET/MR (axial field of view, 25.8 vs. 21.8 cm in PET/CT) and the higher detector sensitivity (15.0 kcps/MBq at the center of the field of view as compared with 8.1 kcps/MBq) may possibly increase the susceptibility of the PET/MR to cross-contamination of activity from body parts below the brain. Generally, it is beyond the scope of this article to provide a definite explanation for the differences observed. Future studies should try to identify and potentially eliminate responsible sources of error, for it is obvious that the introduction of optimized attenuation-correction algorithms may not necessarily lead to elimination of all differences.
For routine clinical assessment, 18F-FDG PET brain imaging data are often normalized to an internal reference value (e.g., global mean, pons, or cerebellum) to allow the identification of relative rather than absolute abnormalities (36). This procedure leads to elimination of global signal differences, for example, also between different scanner types. However, in the current study, region-dependent differences between PET/MR and PET/CT were still present after elimination of global differences, including both over- and underestimations. These differences indicate that semiquantitative assessment of abnormalities, as usually performed in an 18F-FDG PET study for diagnosis of dementia, may result in different results between the 2 modalities, depending on the localization of the findings. These results also demonstrate that it will not be possible to account for these differences using, for example, a systematic global-correction factor. The mentioned effects may lead to a lower sensitivity to detect abnormalities in some brain regions and to false-positive results in other brain regions in the same patient. A particular problem may be found in the relative overestimation of the signal in the pons and cerebellum in PET/MR as compared with PET/CT. Both of these structures are often selected as a reference region for normalization (36,37). Thus, overestimation of the PET signal in these regions will lead to a systematic underestimation of the cortical signal.
In the current study, we also tried to identify effects of the observed differences between PET/CT and PET/MR on clinical rating (supplemental data). Considerable disagreement was observed between rating of PET/CT and PET/MR data by the same observers in the same subjects. Particularly for subjective rating of the degree of abnormality, intraobserver agreement was low for both experienced and less experienced observers. Such discrepancies in rating were not observed in previous PET/MR studies, focusing mainly on regions outside the brain, which may be less affected by effects such as bone-related attenuation (19). The assessment of 18F-FDG PET for neurodegenerative disorders is based on the detection of patchy signal reductions and may be more susceptible to effects of image inhomogeneity as compared with the detection of tumor lesions with focally increased tracer uptake.
There are several limitations to our study. First, with regard to true signal quantification in the brain of the examined patients, no absolute gold standard has been available and low-dose CT-based attenuation correction itself may not reflect the true tracer distribution most accurately. However, PET/CT using low-dose CT for attenuation correction represents today’s best-established clinical reality. Without absolute quantification, our study protocol allowed only the detection of relative differences. However, normalization to an internal reference, as performed in our study, represents the method of choice for semiquantitative evaluation of 18F-FDG PET brain imaging data in a clinical setting.
For observer-dependent visual-qualitative evaluation of the data, we performed comparison of individual patient data with an independent healthy control population, acquired on a different scanner. This approach was selected to compare the two methods with one independent common ground, which may have had an effect on the images, but it would have affected PET/MR and PET/CT image data symmetrically. Finally, no definite—that is, histopathologic—information on the type of neurodegenerative disorder was available for the examined patients (i.e., no standard of reference regarding the clinical diagnosis was available). However, the observer-dependent analysis nevertheless confirmed the notion that methodologic differences between the 2 modalities will result, when applied to patients in a realistic clinical situation.
CONCLUSION
In patients evaluated for cognitive impairment, significant discrepancies were observed between 18F-FDG PET data acquired on an integrated PET/MR scanner and a conventional PET/CT scanner, suggesting that full quantitative comparability between PET/CT and PET/MR data may not be guaranteed. Differences included over- and underestimations, even after elimination of global effects. Some of the discrepancies may be explained by application of different attenuation-correction algorithms but others remained present also in NAC data. Masked reads demonstrated that these effects may have an impact on subjective clinical grading and, thus, need to be considered, for example, for clinical trials. Further studies are recommended to explore the nature of the differences not explained by different attenuation-correction algorithms and on the optimization and validation of alternative attenuation-correction approaches, such as DUTE. Also, the collection of PET/MR-specific healthy control data can be regarded a prevailing requirement for reliable and consistent application of PET/MR in clinical neuroimaging.
DISCLOSURE
The costs of publication of this article were defrayed in part by the payment of page charges. Therefore, and solely to indicate this fact, this article is hereby marked “advertisement” in accordance with 18 USC section 1734. This study was supported by the DFG (Deutsche Forschungsgemeinschaft, Grossgeräteinitiative), which funded the installation of the PET/MR scanner at the Technische Universität München. In addition, this work was supported by grants from the DFG (DR 445/3-1, 4-1) by the Graduate School of Information Science in Health, by the Technische Universität München Graduate School, and by the SFB 824. The Department of Nuclear Medicine, Technische Universität München, has established a research cooperation contract with Siemens Healthcare AG, and several of the authors have been invited to present lectures on PET/MR by Siemens Healthcare AG. Gaspar Delso is employed by GE Healthcare. No other potential conflict of interest relevant to this article was reported.
Acknowledgments
We thank Gitti Dzewas, Sylvia Schachoff, Anna Winter, and Coletta Kruschke and both teams of PET/CT and PET/MR for their valuable support in organization of the dual-imaging procedure. Moreover, we thank the Cyclotron team for the reliable tracer supply. Finally, we thank all the patients participating in this study and their relatives.
Footnotes
↵* Contributed equally to this work.
Published online May 15, 2014.
- © 2014 by the Society of Nuclear Medicine and Molecular Imaging, Inc.
REFERENCES
- Received for publication July 27, 2013.
- Accepted for publication February 10, 2014.


