


Abstract
In a prospective study of newly diagnosed or relapsed histologically proven extranodal natural killer/T-cell lymphoma (ENKTL) patients, we aimed to determine the accuracy of midtreatment 18F-FDG PET for response assessment using both visual and quantitative analyses. Methods: Twenty-four patients (12 men, 12 women; median age, 50 y; age range, 16–83 y) were referred for pre-, mid- (after 2–3 cycles of SMILE [prednisolone, methotrexate, ifosfamide, L-asparaginase, etoposide] chemotherapy), and end-treatment PET/CT scans (n = 24, 24, and 17, respectively) using a standardized protocol. Sixty-five PET/CT scans were analyzed visually using the Deauville 5-point score (DS), and the lesion with the highest maximum standardized uptake value (SUVmax) was recorded. Survival curves were obtained using Kaplan–Meier analysis and compared using the log rank test, followed by multivariate analysis using the Cox proportional hazards model to assess the independent effects of International Prognostic Index (IPI) score (0–1 vs. 2–5), stage (stage I/II vs. stage III/IV), sex, DS (1–3 vs. 4–5), SUVmax, and change in SUVmax on overall survival (OS) and progression-free survival (PFS). The mean (±SD) follow-up period was 32 mo (±21 mo). Results: For 2-y OS, the following parameters were predictive: IPI score (P = 0.047), DS at mid- and end-treatment (P < 0.001), and SUVmax at mid- and end-treatment (P < 0.001 and 0.045, respectively). For 2-y PFS, the following parameters were predictive: sex (P = 0.006), stage (P = 0.034), IPI score (P = 0.038), DS at mid- and end-treatment (P < 0.001 and 0.001, respectively), and SUVmax at midtreatment (P = 0.001). Multivariate analysis showed DS on mid- and end-treatment scans to be the only significant independent predictor of both OS (P = 0.004 and 0.018, respectively) and PFS (P = 0.004 and 0.014, respectively). The 2-y estimate for OS and PFS was 81% and 62%, respectively, in patients with a DS of 1–3, compared with 17% in patients with a DS of 4–5 (P < 0.001 and 0.001, respectively). The sensitivity, specificity, positive predictive value, negative predictive value, and accuracy of the midtreatment DS for prediction of OS and PFS were 63%, 94%, 83%, 83%, and 83%, respectively. Conclusion: Midtreatment PET/CT is a valuable tool for early treatment response assessment in extranodal natural killer/T-cell lymphoma patients.
- 18F-FDG PET/CT
- extranodal natural killer/T-cell lymphoma (ENKTL)
- Deauville score (DS)
- response assessment
Extranodal natural killer/T-cell lymphoma (ENKTL) is a rare tumor with a higher relative incidence in Asia and South America, as compared with Western countries where it is extremely uncommon, although the lymphoma is reported worldwide (1). In Asia, it constitutes about 6.5% of the non-Hodgkin lymphoma cases (2). Because of the rarity of the disease, published experience and recommendations on the role of 18F-FDG PET in ENKTL are limited. The few reports in the literature have found ENKTL to be consistently 18F-FDG–avid, with PET superior to conventional cross-sectional imaging and therefore useful in disease staging (3–6). The mean 18F-FDG uptake measured by maximum standardized uptake value (SUVmax) was found to be significantly higher in the more common B-cell lymphomas than in indolent B-cell lymphomas and significantly lower than in aggressive B-cell lymphomas (7). There is emerging evidence in a few studies that various semiquantitative PET parameters before treatment, including SUVmax, metabolic tumor volume, and total lesion glycolysis, may be predictors of survival independent of the International Prognostic Index (IPI) (8–10). However, the role of 18F-FDG PET in therapy response monitoring of ENKTL is relatively unexplored, with only 2 series reported in the literature (11,12). Both are retrospective studies and limited by a mixture of various mature T-cell and natural killer cell neoplasms treated with highly heterogeneous protocols. The findings were contradictory on whether interim and end-therapy PET were predictive of progression free survival (PFS) and overall survival (OS). Therefore, unlike the better-studied diffuse large B-cell lymphomas (DLBCL) and Hodgkin lymphoma for which interim PET has been found promising in being a prognostic indicator of therapy response, the role of interim 18F-FDG PET in ENKTL is yet undefined. Midtreatment early assessment is helpful in evaluating the effectiveness of the given treatment and for excluding the possibility of disease progression, potentially allowing response-adapted treatment strategies for which therapy can be tailored for the individual’s response.
We report the results of a prospective study of newly diagnosed or relapsed ENKTL patients in a single-center treated with a standardized chemotherapy regimen SMILE (prednisolone, methotrexate, ifosfamide, L-asparaginase, etoposide) (13), all of whom underwent 18F-FDG PET/CT after 2–3 cycles of treatment. The aim of our study was to determine the predictive value of midtreatment 18F-FDG PET using both visual and quantitative analyses.
MATERIALS AND METHODS
Patient Population
The study was approved by the Institutional Review Board, and all subjects signed a written consent form. Consecutive biopsy-proven new or relapsed ENKTL patients were prospectively recruited for pretreatment, midtreatment, and end-treatment PET/CT scans between January 2008 and May 2013 in a single center. Relapsed patients were in complete remission and treatment-free for 2 mo to 10 y at relapse.
Lymphoma diagnosis was based on the World Health Organization lymphoma classification, and all pathology materials were centrally reviewed. Patients with diabetes mellitus and with blood glucose levels greater than 200 mg/dL at the time of the scan were excluded. Also, patients with concomitant infection or other malignancies were excluded.
All patients underwent full Ann Arbor staging with bilateral iliac crest trephine biopsy. IPI was evaluated on presentation. All patients underwent 6 cycles of SMILE, given at 28-d cycles. Involved field radiotherapy was administered after 3 courses of SMILE in 13 patients. Four patients underwent hematopoietic stem cell transplantation on completion of treatment. Initial pretreatment scans were obtained before commencement of treatment. Midtreatment scans were obtained at least 2 wk after the first 2 or 3 cycles of SMILE treatment. All midtreatment scans were acquired before involved-field radiotherapy in patients who required it. End-treatment scans were obtained 4–6 wk after completion of 6 cycles of SMILE chemotherapy and before hematopoietic stem cell transplantation if applicable.
PET/CT Scan Protocol
For all patients, whole-body 18F FDG PET/CT (from the base of the skull to the upper one third of the thighs) was performed with a combined PET/CT scanner (Discovery VCT, 64 multislice spiral CT; GE Healthcare Bio-Sciences Corp.), using a standardized protocol. After 6 h of fasting, 222–370 MBq (4.8 MBq/kg) of weight-adjusted 18F-FDG was administered intravenously, and after a 60-min uptake time, whole-body emission PET scans were obtained with 6 bed positions of 2 min 30 s acquisition time in each bed position. Attenuation-corrected PET images with CT data were reconstructed with an ordered-subset expectation maximization iterative reconstruction algorithm (14 subsets and 2 iterations) and fused with CT images (Advanced Workstation 4.3; GE Healthcare Bio-Sciences). The CT imaging parameters were as follows: 120 kVp; 200–400 mA; 0.5 s per CT rotation; pitch, 0.984:1; and 2.5-mm intervals, with or without 60–100 mL (1.5 mL/kg) intravenous contrast medium. A low-dose CT scan protocol without intravenous contrast medium was generally performed if a diagnostic contrast-enhanced CT scan was obtained within the last 3 mo.
PET/CT Scan Analysis
PET images were analyzed by 2 experienced radiologists with 6 and 3 y experience in the clinical reporting of PET/CT scans in consensus, with knowledge of the initial clinical data but masked to patient outcome.
Visual Analysis
Positive uptake was defined as any focal or diffuse area of increased activity, in a location incompatible with normal anatomy or normal variant. For mid- and end-treatment scans for response assessment, the lesions were scored according to the Deauville score (DS) using a 5-point scale with the following criteria: 1, no uptake; 2, uptake ≤ mediastinum; 3, uptake > mediastinum but ≤ liver; 4, uptake moderately higher than liver; and 5, uptake markedly higher than liver or new lesions (14).
Quantitative Analysis
Standardized uptake value (SUV) measurement was by normalization to the injected dose and lean body mass. Lean body mass was used for normalization instead of total body mass because it is less dependent on body habitus across populations (15). Regions of interest were determined using an automated thresholding technique available in the workstation. Regions of interest were placed manually over all lesions, and the SUVmax (SUVmax) was recorded for every lesion. Also, the highest SUVmax for every scan was recorded, and these lesions were identified as indicator lesions. For mid- and end-treatment scans, we recorded the change in SUVmax (ΔSUVmax), comparing the index lesion and the highest SUVmax in the scan regardless of the index lesion. If the lesion was no longer seen after treatment, a region of interest was drawn in the same area as the lesion in the pretreatment PET scan, avoiding adjacent normal physiologic uptake. ΔSUVmax was calculated as:
Clinical and Imaging Follow-up Assessment
Patients were followed up by the attending physicians 1–2 mo after the end of treatment and then every 6 mo for a minimum of 1 y. Imaging follow-up was performed at 1- and 2-y time points from diagnosis with conventional CT or PET/CT or at an earlier time point if there was suspicion of progression/relapse for confirmation.
PFS was defined as time from SMILE treatment to disease relapse or progression, initiation of next treatment, death, or last follow-up. Data were censored at hematopoietic stem cell transplantation. OS was defined as time from diagnosis to death or last follow-up.
Statistical Analysis
To determine the optimal cutoff values of parameters extracted from PET images and clinical variables (sex, age, stage, IPI score), receiver-operating-characteristic curve analysis was performed, and the value with the highest sum of sensitivity and specificity was used as the cutoff. Univariate analysis using the Kaplan–Meier method was performed for each variable: sex, stage, IPI score, DS, SUVmax of the hottest lesion at pretreatment scan, SUVmax of the hottest lesion at midtreatment scan, ΔSUVmax between pretreatment and midtreatment scans of the hottest lesion, SUVmax of the hottest lesion at end-treatment scan, and ΔSUVmax between pretreatment and end-treatment scans of the hottest lesion. The log-rank test was used to compare the PFS or OS difference between the 2 groups divided according to the cutoff value. For the significant variables in univariate analysis, multivariate analysis using the Cox proportional hazards model was performed to assess the potential independent effects on PFS and OS.
All statistical analyses were performed using SPSS 20 (SPSS Inc.), and a P value of less than 0.05 was considered statistically significant.
RESULTS
Patient Demographics and Clinical Follow-up
This study comprised 24 patients (newly diagnosed, n = 19; relapsed, n = 5). Sixty-five PET/CT scans were obtained. All 24 patients were scanned at pretreatment, followed by midtreatment scans, and 17 patients underwent end-treatment scans. Patient demographics are shown in Table 1.
Clinical Characteristics of Study Population (n = 24)
The mean (±SD) clinical follow-up period was 32 mo (±21 mo). Of the 24 patients, 14 were in remission at the last follow up, 2 patients had recurrent disease, and 8 died. Of the 5 patients recruited with relapsed disease, 1 patient who was disease-free for 2 mo before recruitment experienced recurrent disease (to the skin), whereas the other patients were in remission. The estimates for 2-y OS and 2-y PFS for the whole cohort were 65% (SE, 10%) and 52% (SE, 12%), respectively.
Pretreatment PET/CT Scans
SUVmax of the hottest lesion measured in each patient ranged from 1.7 to 21.2 (mean ± SD, 8.5 ± 5.1). Of these lesions, the mean SUVmax of the lesions in newly diagnosed patients was 8.8 ± 4.9 and 7.2 ± 4.1 for lesions in relapsed patients.
Mid- and End-Treatment PET/CT Scans
The DSs of the 24 midtreatment scans and 17 end-treatment scans are shown in Table 2. Three patients who underwent scans with a DS of 3 at midtreatment had DSs of 5, 2, and 1 at end-treatment, of which the former was in a newly diagnosed patient with disease progression detected at the end-treatment scan. One patient with a DS of 5 at midtreatment had a DS of 1 at end-treatment. One patient, newly diagnosed, with a DS of 1 at midtreatment had a DS of 5 at end-treatment because of the appearance of new lesions. Otherwise, all other patients had DSs that were the same at mid- and end-treatment scans. Of the 5 patients recruited with relapsed disease, 3 also underwent end-treatment scans; DSs in 2 patients were 3 at midtreatment, becoming 1 and 2 at end-treatment, and 5 in 1 patient at midtreatment, becoming 1 at end-treatment.
DSs of Mid- and End-Treatment Scans
Mean SUVmax (±SD) of the hottest lesion in the midtreatment and end-treatment scans was 2.2 ± 1.5 and 1.9 ± 1.8, respectively.
ΔSUVmax between pretreatment and midtreatment scans was 62% ± 39% and between pretreatment and end-treatment scans was 72% ± 27%.
Statistical Analysis
On the basis of receiver-operating-curve analysis, the following cutoff values were used: IPI (0–1 vs. 2–5), Ann Arbor stage (stage I/II vs. stage III/IV), SUVmax at pretreatment scan (7.6), SUVmax at midtreatment and end-treatment scan (3 and 2, respectively), and ΔSUVmax between pretreatment and mid- or end-treatment scan (88% reduction). For DS, a cutoff value of 1–3 versus 4–5 was selected using receiver-operating-characteristic analysis for OS. Although this cutoff value was not found for PFS, we maintained this for the evaluation of PFS for consistency.
The parameters predictive of 2-y OS and PFS, and the estimate for 2-y PFS and OS by these parameters using univariate Kaplan –Meier analysis, are listed in Tables 3 and 4.
Prediction of OS Using Sex, IPI, Stage, Visual Analysis, and SUV-Based Semiquantitative Assessment
Prediction of PFS Using Sex, IPI, Stage, Visual Analysis, and SUV-Based Semiquantitative Assessment
For OS, the following parameters were predictive: IPI (P = 0.047), DS of midtreatment scan (P < 0.001), SUVmax of midtreatment scan (P < 0.001), DS of end-treatment scan (P < 0.001), and SUVmax of end-treatment scan (P = 0.045).
For PFS, the following parameters were predictive: sex (P = 0.006), stage (P = 0.034), IPI (P = 0.038), DS of midtreatment scan (P < 0.001), SUVmax of midtreatment scan (P = 0.001), and DS of end-treatment scan (P < 0.001).
Sensitivities, specificities, negative predictive values (NPVs), positive predictive values (PPVs), and accuracies for the above parameters are reported in Table 3 (for OS) and Table 4 (for PFS).
Multivariate analysis showed DS at midtreatment and end-treatment scans to be the only significant independent predictor of both OS (P = 0.004 and 0.018, respectively) and PFS (P = 0.004 and 0.014, respectively).
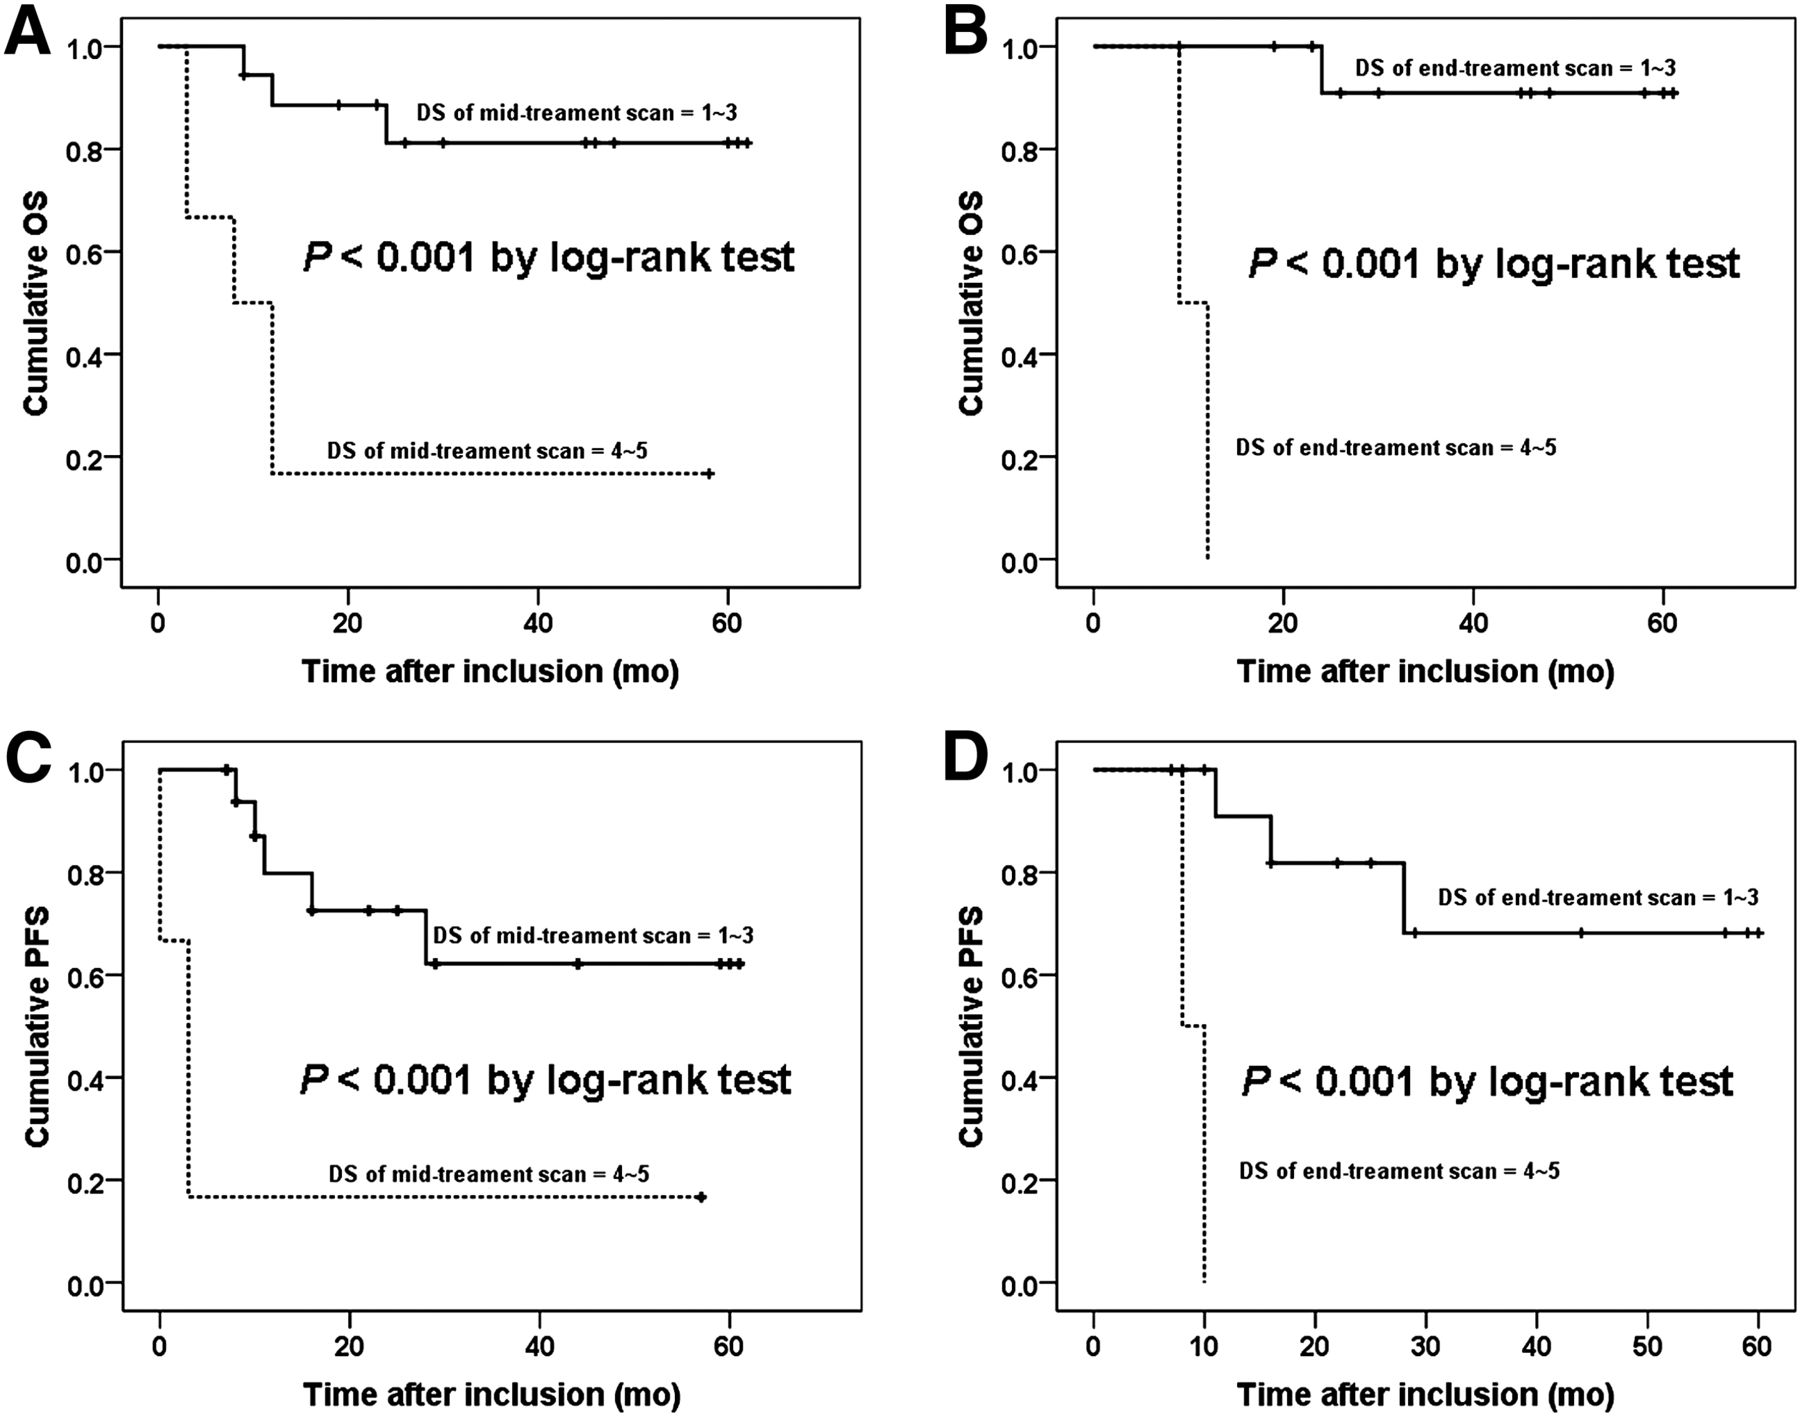
Two-year OS for DS 1–3 versus DS 4–5 at midtreatment scan was 81% (SE, 10%) versus 17% (SE, 15% ) (P < 0.001), and 2-y PFS for DS 1–3 versus DS 4–5 was 62% (SE, 14%) versus 17% (SE, 15%) (P = 0.001). Two-year OS for DS 1–3 versus DS 4–5 at end-treatment scan was 91% (SE, 9%) versus 0% (SE, 0%) (P < 0.001), and 2-y PFS for DS 1–3 versus DS 4–5 was 68% (SE, 16%) versus 0% (SE 0%) (P < 0.001) (Tables 3 and 4; Fig. 1).

Kaplan–Meier curves of OS and PFS according to DS after treatment: OS based on DS in midtreatment scan (A), OS based on DS in end-treatment scan (B), PFS based on DS in midtreatment scan (C), and PFS based on DS in end-treatment scan (D).
However, pretreatment SUVmax of the hottest lesion and ΔSUVmax was not predictive of OS or PFS.
DISCUSSION
We found an early midtreatment 18F-FDG PET scan after 2–3 cycles of chemotherapy to be useful in the prediction of therapy response in ENKTL patients. With visual assessment, the DS was found to be the only significant independent predictor of OS and PFS and thus more powerful than IPI, conventionally the most important prognostic scoring system (16). Unlike the 2-point positive and negative score of the International Harmonisation Project (IHP) criteria (17), the DS offers a 5-point scale that provides more continuous criteria to define tumor response, which is pertinent especially for the midtreatment scans, because the DS better reflects the therapy changes in tumors that are ongoing and in continuum. It has been recommended that interim PET scans should be assessed using DS in clinical practice and in trials (18). Treatment response assessment using DS was found to be accurate and reproducible, with good interobserver agreement, ranging from 0.69 to 0.84 measured with the Cohen κ (19). In our cohort, DS using a cutoff of 3 was able to predict OS and PFS with an accuracy of 83%, and this improved at the end-treatment scan to 94%. Both NPV and PPV at midtreatment scan for OS and PFS were moderately good at 83%. The 2-y estimate for OS of the entire population, patients with a DS of 1–3 and 4–5 at midtreatment scan, was 65%, 81%, and 17%, respectively, and the 2-y estimate for PFS was 52%, 62%, and 17%, respectively. At the end-treatment scan, the DS cutoff of 2 or 3 would have yielded the same results because there were no patients with a DS of 3. Using a DS cutoff of 2 to define complete metabolic response in the negative scans would essentially be equivalent to using the IHP criteria and may be more appropriate at end-treatment to increase the NPV of PET. In a study from Southern China of mature aggressive T-cell and ENKTL, the subset of ENKTL patients with interim PET scans (n = 34) or end-treatment PET scans (n = 17) was evaluated regardless of whether pretreatment baseline scans were obtained. Li et al. found interim and end-treatment PET scans assessed using the visual criteria of the IHP to be predictive of PFS (P = 0.013) but not of OS (12).
We did not find ΔSUVmax to be predictive of OS or PFS, which might be due to limitations with the accuracy of quantification of residual small lesions after treatment, lesions becoming no longer visible, and the effect of partial-volume averaging. Moreover, ΔSUVmax sometimes does not accurately reflect the impact of new disease because the new lesion may be less 18F-FDG–avid than the index lesion, and this was the case in 7 scans with new lesions (DS, 5) in our study. Nevertheless, ΔSUVmax was found to have a higher predictive value than visual analysis in several studies evaluating therapy response in DLBCL patients (20–22). Lin et al. found ΔSUVmax using a cutoff of 66% to be more predictive than visual analysis in predicting outcome after 2 cycles of therapy in DLBCL patients, especially in improving PPV, but a follow-up study by Itti et al. did not show this advantage when patients were assessed after 4 cycles of therapy (20,21). Subsequently, these results were validated by Casasnovas et al. who showed ΔSUVmax to be feasible in a cohort of high-risk DLBCL patients after both 2 cycles and 4 cycles of treatment and better than visual analysis using both IHP and Deauville criteria (22). Finally, in a recent study by Pregno et al., interim PET using ΔSUVmax was not predictive of outcome in a cohort of DLBCL patients treated homogeneously with R-CHOP (rituximab-cyclophosphamide, vincristine, doxorubicin, prednisolone) (23). Thus, this semiquantitative parameter requires further validation in prospective studies (20–23).
We found absolute SUVmax of the hottest lesion in the mid- and end-treatment scans to be predictive of OS by univariate analysis, using a cutoff value of 3 for SUVmax at midtreatment and 2 at end-treatment scans. However, although semiquantitative analysis using SUVmax is a more objective assessment, it did not provide any advantage over visual analysis, because it provided a lower accuracy and did not impact independently on OS.
In our cohort, pretreatment SUVmax of the hottest lesion was not predictive of OS or PFS. Suh et al. in a study of ENKTL limited to the head and neck region found SUVmax of the primary tumor (nasal cavity, oral cavity, and nasopharynx) to be predictive of disease-specific survival and OS. The cohort differed in the location of the primary tumor, and patients were mostly of stage I and II disease (10). Hence, our results are not directly comparable.
Our study has several advantages over the few series of PET for therapy response assessment in ENKTL reported so far. First, patients were treated with currently the most active regimen (SMILE) for this lymphoma (13). Second, patients were managed uniformly with the same protocol. These 2 points are important, because prognosis changes with different regimens, and prognostic indicators established with less-effective treatment protocols might not be applicable when more active regimens are used. Furthermore, prognostic indicators could be meaningfully established only when a uniform protocol is used. Finally, our study was prospective, so that PET scans were obtained at predetermined time points during treatment. Results of the interim scan did not affect the planned treatment, so that results of the end-treatment scan were fully interpretable. Although the number of patients involved was relatively small and thus a limitation of the study, this is a rare tumor, even in countries in which it is considered to be more prevalent.
As previously noted, SMILE appears to date to be the most active regimen for treatment of ENKTL (1). However, there is still a paucity of data for risk factors that may predict disease relapse after treatment with SMILE. Prognostication is especially important for early-stage ENKTL, because some patients may be curable with radiotherapy and conventional chemotherapy, whereas others may require additional or innovative therapy. Although there is no evidence to date that altering therapy based on interim PET findings will improve patient outcome, our findings support the use of 18F-FDG PET as a tool for early midtreatment response assessment in clinical trials of ENKTL to evaluate its usefulness in prediction of response and future relapses when other novel regimens are tested.
CONCLUSION
In this prospective study of ENKTL patients who underwent serial 18F-FDG PET scans at pretreatment and midtreatment after 2–3 cycles of SMILE chemotherapy in a single center, we found the use of 18F-FDG PET to be a useful tool for early midtreatment therapy response assessment, supporting its use in clinical trials.
DISCLOSURE
The costs of publication of this article were defrayed in part by the payment of page charges. Therefore, and solely to indicate this fact, this article is hereby marked “advertisement” in accordance with 18 USC section 1734. The study was supported by RGC GRF grant HKU 766408M from The University of Hong Kong, Hong Kong S.A.R., China. No other potential conflict of interest relevant to this article was reported.
Acknowledgments
We thank Dr. Lasse Krug (research assistant in the Department of Diagnostic Radiology, The University of Hong Kong) and all the radiographers in the PET/CT scan unit of The University of Hong Kong for their help in this study.
Footnotes
Published online May 12, 2014.
- © 2014 by the Society of Nuclear Medicine and Molecular Imaging, Inc.
REFERENCES
- Received for publication August 30, 2013.
- Accepted for publication December 16, 2013.


