


Abstract
Lung cancer often coexists with acute and chronic lung diseases such as chronic obstructive pulmonary disease. Therefore, mediastinal lymph nodes may be false-positive on 18F-FDG PET because of the inflammatory disease alone. Nevertheless, 18F-FDG PET/CT is the primary imaging modality used for staging patients with lung cancer, including nodal status. The purpose of this study was to evaluate whether volumetric CT histogram analysis can improve the characterization of lymph nodes on PET/CT staging of patients with lung cancer. Methods: Sixty histologically proven lymph nodes of 45 patients aged 43–76 y diagnosed with lung cancer were investigated. 18F-FDG PET/CT, contrast-enhanced CT, and nonenhanced CT were performed before surgery or biopsy as part of the clinical staging procedure. Lymph nodes were analyzed on the basis of the 18F-FDG standardized uptake value and volumetric CT histogram analysis. These findings were correlated to the gold standard of histopathology. Results: Histologic examination revealed 36 positive and 24 negative lymph nodes, which were also successfully analyzed by volumetric CT histogram. Median CT density was significantly higher for histologically positive lymph nodes (33.2 Hounsfield units [HU]; range, −29.8 to 59.1) than for histologically negative lymph nodes (10.1 HU; range, −21.0 to 87.4; P = 0.002). The incidence of malignancy was 88% above a cutoff value of 20 HU in the ten 18F-FDG–equivocal lymph nodes; the incidence of benign findings was 100% in the interval between −20 and +20 HU. Visual- and density-based analysis on contrast-enhanced CT failed to differentiate affected from nonaffected lymph nodes. Conclusion: Three-dimensional histogram analysis is a promising and potentially valuable imaging surrogate for N-stage stratification in patients with lung cancer with unclear glucose uptake during 18F-FDG PET imaging. In cases of equivocal 18F-FDG PET status, this technique might potentially bridge the diagnostic gap between noninvasive techniques and invasive lymph node sampling and could help improve the yield of core biopsies.
In patients with lung cancer, 18F-FDG PET/CT is considered the standard imaging methodology for noninvasive evaluation of mediastinal and hilar lymph nodes (1,2). However, in current PET/CT techniques, assessment of moving structures is limited by the time resolution of PET. In structures close to the heart and lungs, vessel pulsation and breathing may lead to a misestimation of 18F-FDG uptake translating into equivocal findings. Accurate mediastinal N-staging is essential, because involvement of contralateral or multiregional mediastinal lymph nodes might exclude the patient from primary surgery and is often associated with a poor prognosis (3,4). Because patients with lung cancer often have comorbid diseases such as acute or chronic lung diseases (i.e., postobstructive pneumonia or chronic obstructive pulmonary disease), mediastinal lymph nodes will show positive 18F-FDG uptake on PET/CT due to inflammation. Consequently, transbronchial biopsies or the more invasive mediastinoscopy are necessary for the acquisition of lymph node tissue for histologic analysis in patients with potentially resectable non–small cell lung cancer and the absence of extrathoracic, contralateral lung, or pleural cavity metastases. However, not all mediastinal lymph node positions can be reached by the respective techniques (i.e., 3A, 5, 6, 8, 9, and some of 2L). To confirm the state of mediastinal lymph node involvement more precisely in patients with an unclear 18F-FDG PET status, we evaluated the use of a new technique for volumetric CT histogram analysis. The technique was used to identify metastatic lymph node involvement in lung cancer patients in correlation to 18F-FDG PET/CT and histologic findings.
The hypothesis of this multicenter investigation was based on lymph node density: in affected lymph nodes, a higher density is expected because of the loss of the fatty lymph node hilus in contrast to nonaffected lymph nodes (Fig. 1). Therefore, lymph node density was defined as the primary endpoint; secondary endpoints were the metric parameters short-axis diameter (SAD) and volume of mediastinal lymph nodes and the functional parameter maximum standardized uptake value (SUVmax).
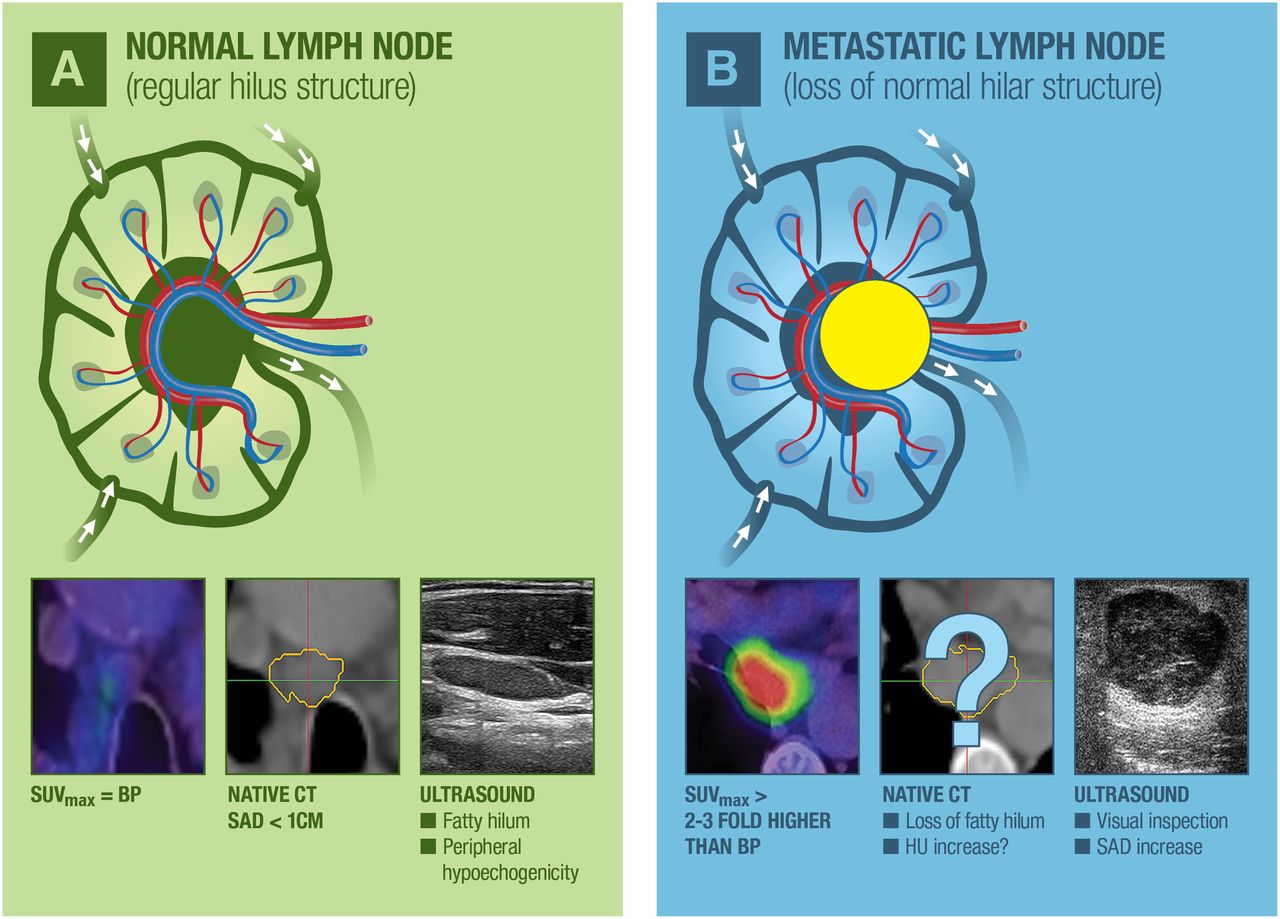
Normal and metastatic lymph nodes with specific characteristics on ultrasound, PET, and CT. (A) Schematic illustration of normal lymph node with corresponding findings on PET/CT (18F-FDG–negative), ultrasound (slim shape with peripheral halo sign), and exemplary nonenhanced CT. (B) Schematic picture of lymph nodes with metastatic infiltration, showing positive 18F-FDG uptake on PET/CT. Exemplary round metastatic lymph node on ultrasound with loss of hilar architecture and rare calcifications. BP = blood pool.
MATERIALS AND METHODS
Study Design and Patients
In this retrospective multicenter investigation, mean density, SAD, and volume of mediastinal and hilar lymph nodes were evaluated on unenhanced and contrast-enhanced CT using the new volumetric CT histogram analysis software for semiautomated lymph node segmentation (5). In total, 60 lymph nodes in 45 patients (22 men and 23 women; median age, 58 y; range, 43–76 y) diagnosed with lung cancer were examined. All 18F-FDG PET/CT, including unenhanced and contrast-enhanced CT scans, was performed according to the clinical schedule before surgery or biopsy. The study was approved by the institutional review board and conducted in agreement with the board’s guidelines and good clinical practice according to the ethical principles originating in the Declaration of Helsinki. In this retrospective study, the requirement for informed consent was waived by the institutional review board.
Image Acquisition and Volumetric CT Histogram Analysis
Imaging was performed before surgery or biopsy for therapeutic planning and TNM staging according to the clinical schedule.
18F-FDG PET/CT was performed after at least 8 h of fasting. After a blood glucose level below 150 mg/dL had been confirmed, 18F-FDG (4 MBq/kg of body weight) was administered intravenously 1 h before the 18F-FDG PET/CT scan. In this multicenter study, patients were examined using either a Biograph 6 PET/CT scanner (Siemens Medical Solutions) or a Discovery LS scanner (GE Healthcare) with comparable examination protocols and reconstruction parameters. Lymph nodes were assessed using 18F-FDG uptake (SUVmax) and 3-dimensional (3D) CT histogram analysis on the basis of nonenhanced CT scans. Both PET and CT datasets were reconstructed at a slice thickness of 5.0 mm and a reconstruction increment of 2.5 mm. A standard soft-tissue reconstruction kernel B30 was used for CT images. Imaging findings were considered positive if the SUVmax of the lymph nodes was more than 3-fold higher than that of the blood pool; negative, if less than that of the blood pool; and equivocal, if between 1-fold and 3-fold higher than that of the blood pool.
For better spatial orientation in the hilar and mediastinal lymph node areas, contrast-enhanced CT was performed in a preoperative setting at 120 kV, using CARE Dose with a 16 × 0.6 mm collimation in inspiration (Somatom Emotion [Siemens Medical Solution]; 6 slices, pitch of 1.8; Somatom Definition AS [Siemens Medical Solution]; 64 slices, pitch of 1.4). After intravenous injection of 100 mL of iopromide (Ultravist 300 [Bayer]; injection rate of 4 mL/s), the CT scan was started with a fixed delay of 45 s. CT datasets were reconstructed at a slice thickness of 1.0 mm and an increment of 0.5 mm using a standard soft-tissue kernel B30.
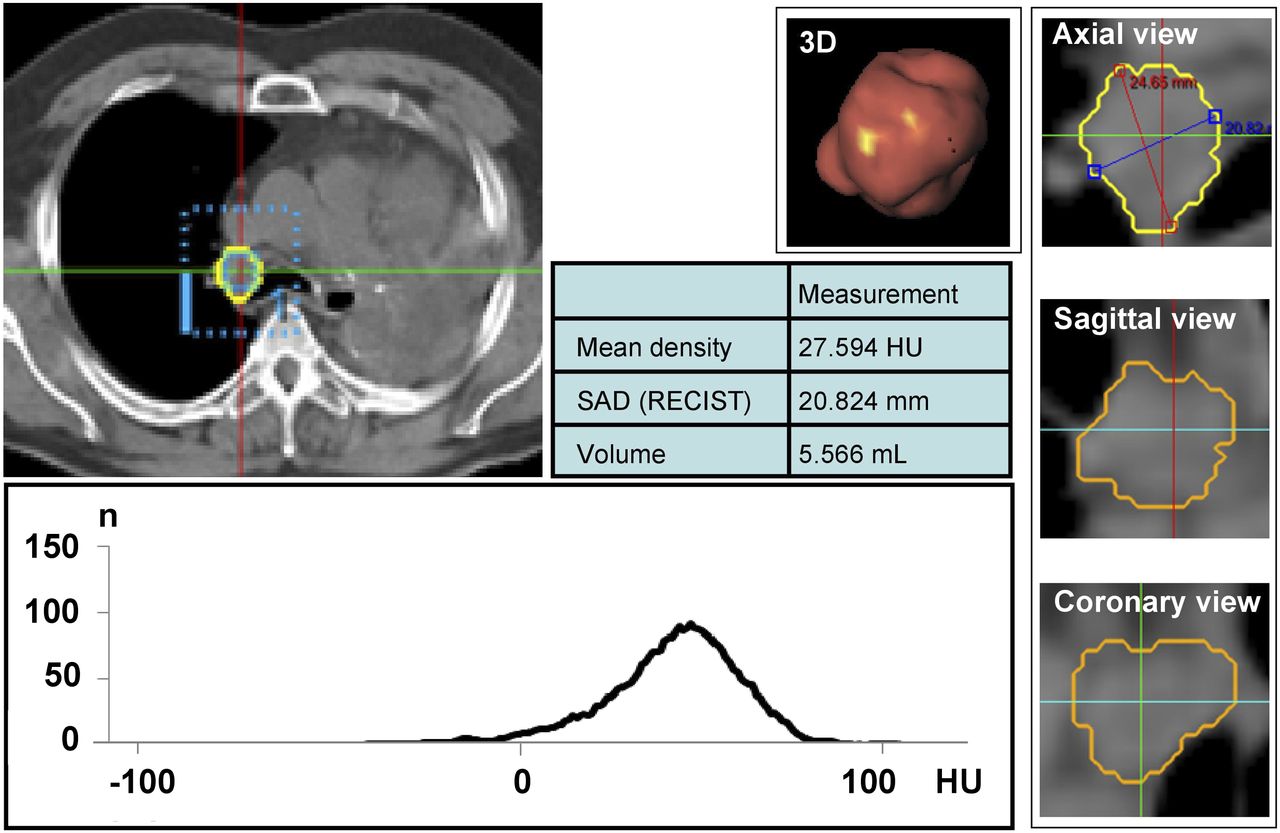
For computing the histograms, a radiologist with 4 y of experience in oncologic radiology segmented the lymph nodes using a semiautomatic method (Fraunhofer MEVIS (5)) while masked to clinical information. Lymph nodes were identified on nonenhanced CT (the attenuation correction scan of 18F-FDG PET/CT) in side-by-side correlation with the preoperative contrast-enhanced CT. Only lymph nodes with a clearly allocated histologic correlation were examined. Semiautomated 3D histogram analysis was initiated by providing a seed point in the lymph node. Within an estimated region of interest, thresholds were generated automatically by the segmentation software. Spatial parameters were extracted, and histogram analysis was performed. For validation, semiautomated results were verified by the conducting physician, who visually went through all 3 dimensions of each segmented lymph node by following lymph node boundaries on a 3D viewer for multiplanar reconstruction (Fig. 2). If necessary, segmentation results were corrected manually in all 3 dimensions. All correction steps were documented. Both imaging findings were correlated to the histologic gold standard.

3D evaluation of mediastinal lymph node metastasis. For computing histograms, semiautomatic method was used (Fraunhofer MEVIS). Within estimated region of interest, thresholds were generated automatically by segmentation software. For validation, semiautomated results were verified using implemented 3D viewer for multiplanar reconstruction (images on right). Spatial parameters were extracted, and histogram of all voxels in segmented lymph node was generated (graph at lower left). RECIST = Response Evaluation Criteria in Solid Tumors.
Statistical Analysis
Statistical analysis was performed using SPSS (version 17; IBM) for Windows (Microsoft), SAS (version 9.2; SAS Institute Inc.) for Windows, and SigmaPlot (Systat Software GmbH). Median values for density, SAD, and volume (with or without range) were calculated and are illustrated as box-and-whisker plots (Fig. 3). Differences were considered significant at a P level of less than 0.05 and highly significant at a P level of less than 0.01 in paired-sample t testing.

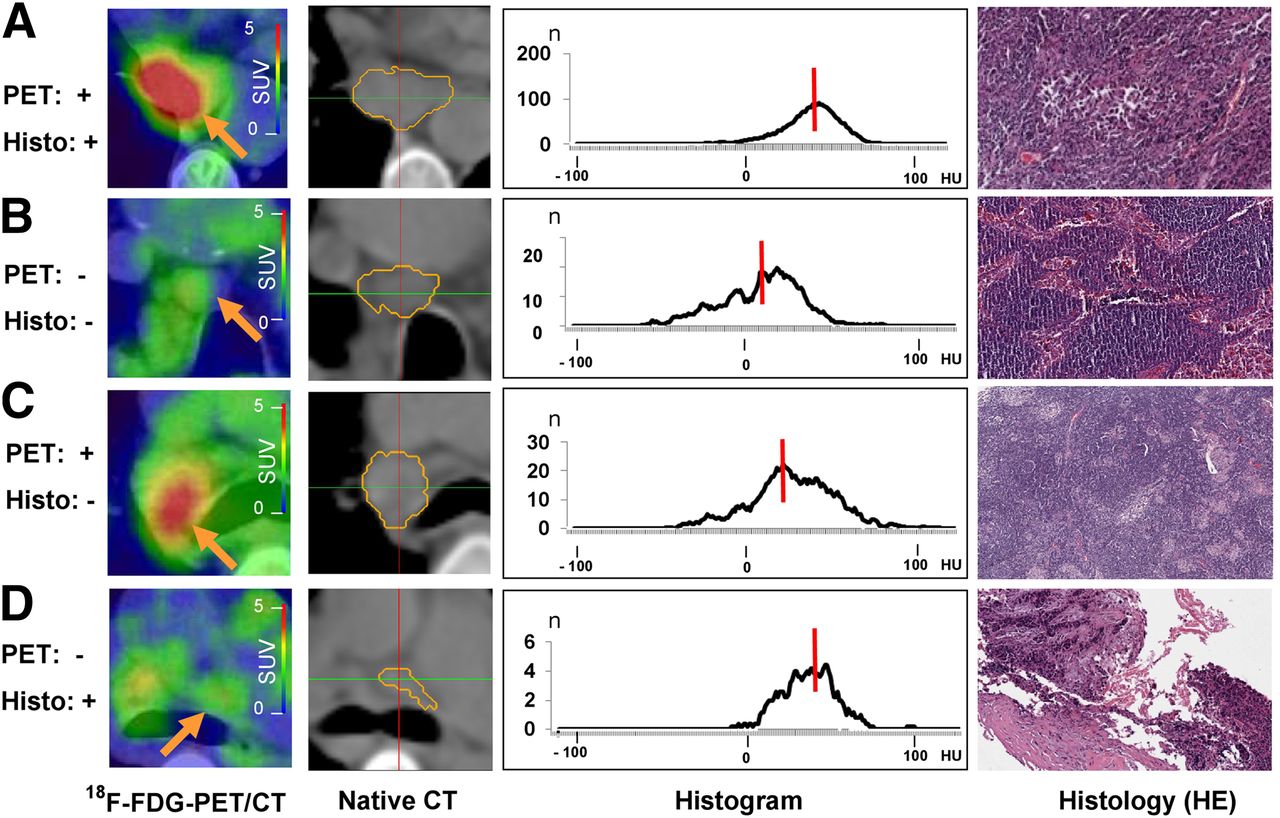
Comparison of 18F-FDG PET/CT, nonenhanced CT, 3D CT histogram analysis with median density values (red lines), and histologic cross sections (hematoxylin and eosin [HE], ×40). (A) Patient with adenocarcinoma. PET-positive malignant lymph node is at position 7 (SAD, 19 mm; volume, 1.6 cm3). Median density of 31 HU in related CT histogram is beyond possible cutoff of 20 HU. Histologic cross section shows lymph node tissue with sparse infiltrates of atypical epithelial cells. (B) Patient with adenocarcinoma. PET-negative benign lymph node is at position 4R (SAD, 11 mm; volume, 0.9 cm3). Corresponding CT histogram has median density of 12 HU. Histologic cross section shows prominent sinus histiocytosis and no evidence of malignancy. (C) Patient with adenocarcinoma. PET-positive benign lymph node is at position 10R (SAD, 20 mm; volume, 1.5 mL). Corresponding CT histogram has median density of 21 HU. Histologic cross section shows regular lymph node tissue, few sarcoidlike lesions, and slight lymphofollicular hyperplasia. (D) Patient with large cell neuroendocrine tumor. PET-negative lymph node is at position 4L (SAD, 7 mm; volume, 1 mL). Corresponding CT histogram has median density of 28 HU. Histologic cross section shows sparse lymph node tissue and desmoplastic stroma with focal non–small cell lung cancer (upper left corner).
RESULTS
Histologic Findings and Lymph Node Localization
From 45 patients, a total of 60 histologically sampled lymph nodes could clearly be allocated to 1 specific lymph node on 18F-FDG PET/CT and contrast-enhanced CT. Among the 60 clearly allocated lymph nodes, 36 were histologically positive (metastatic) and 24 were negative (no metastatic involvement). Ten lymph nodes showed equivocal 18F-FDG uptake.
The tumor types found on histologic analysis are shown in Table 1 (per-patient basis). Localization of lymph nodes according to the classification of the American Joint Cancer Committee and the International Union Against Cancer (6) is shown in Table 2 (per–lymph node basis).
Tumor Types
Lymph Node Classification
Findings of Semiautomated Lymph Node Assessment
Lymph nodes were analyzed via a semiautomated segmentation algorithm. Semiautomated segmentation prolonged reading time by only a few minutes, which is feasible in daily clinical diagnostic routine, and enabled derivation of several additional important parameters: lymph node size (short and long axis), volume, and median density.
Regarding nonenhanced CT, 36 histologically positive lymph nodes had a median CT density of 33.2 HU on semiautomated evaluation (range, −29.8 to 59.1; Figs. 3A and 4; Table 3), irrespective of SUVmax. Among them, 27 lymph nodes showed uptake on 18F-FDG PET/CT (median SUVmax, 7.4; range, 5 to 22.4), with a median CT density of 34.2 HU (range, −29.8 to 42.3). Nine lymph nodes had equivocal uptake or were negative for uptake (median SUVmax, 2.8; range, 1.4 to 4.1), with a median CT density of 36.3 HU (range, 19.6 to 59.1).
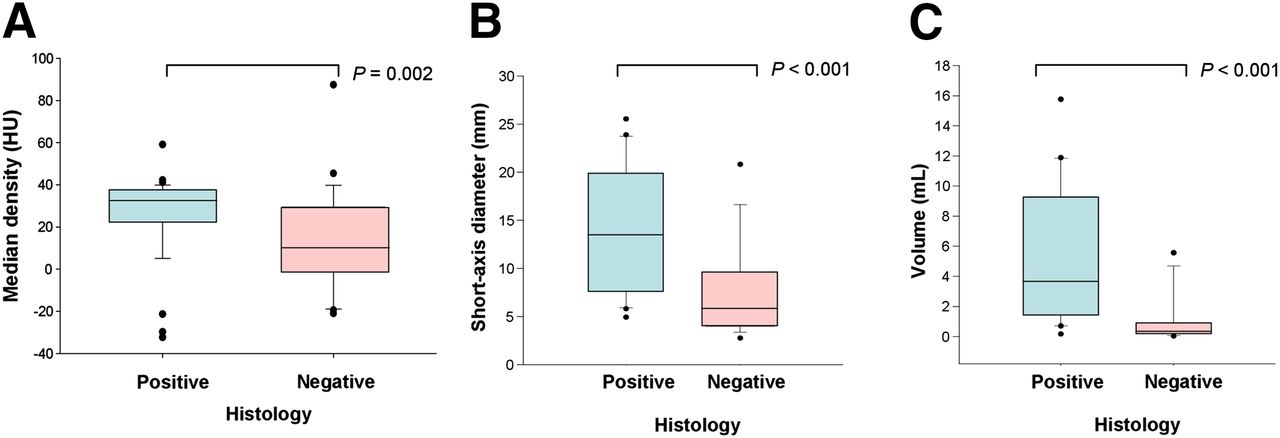
Box-and-whisker-plot analysis. (A) CT density of lymph node on nonenhanced CT. On the basis of CT density, affected and nonaffected lymph nodes presented significantly different density values on CT imaging. Histologically positive (affected) lymph nodes had median CT density of 33.2 HU, whereas histologically negative (nonaffected) lymph nodes had median CT density of 10.1 HU (P = 0.002). (B) SAD of lymph node. On nonenhanced CT scans, positive lymph nodes had median SAD of 13.5 mm. SAD was significantly smaller in negative lymph nodes, which had median SAD of 5.8 mm (P < 0.001). (C) Volume of lymph node. Affected lymph nodes (positive) had higher volume than nonaffected lymph nodes (negative) (P < 0.001).
Lymph Node Data
Histologically negative lymph nodes (n = 24) had a median CT density of 10.1 HU (range, −21.0 to 87.4; Figs. 3A and 4; Table 3), also independent from SUVmax. Of them, 14 were negative for 18F-FDG uptake (median SUVmax, 1.1; range, 0.9 to 1.3), with a median CT density of 11.7 HU (range, −21 to 87.4). Another 10 lymph nodes were equivocal or positive for uptake (median SUVmax, 1.9; range, 1.4 to 3.7), with a median CT density of 2.8 HU (range, −6.6 to 27.6).
Using the Student t test, the comparison of median CT densities on native CT images between affected and nonaffected lymph nodes was highly statistically significant (P = 0.002).
Regarding contrast-enhanced examinations, histologically proven metastatic lymph nodes had a median CT density of 64.2 HU (range, −16.7 to 90.2; Table 3). Concerning the group of lymph nodes positive for 18F-FDG uptake (n = 27), their median CT density measured 64.5 HU (range, 42.4 to 78.1). Lymph nodes equivocal or negative for uptake had a median CT density of 62.3 HU (range, −16.7 to 90.2).
Histologically proven nonmetastatic lymph nodes had a median CT density of 46.3 HU (range, 1.7 to 91.1; Table 3). Within this group, lymph nodes negative for 18F-FDG uptake (n = 14) had a median CT density of 33.4 HU (range, 16.7 to 87.4). Lymph nodes equivocal or positive for uptake (n = 10) had a median density of 61.5 HU (range, 1.7 to 91.1).
To summarize the statistical analysis of contrast-enhanced lymph node assessment, CT densities did not significantly differ between affected and nonaffected lymph nodes (P = 0.062). In addition, lymph node density did not significantly differ between 18F-FDG–positive and 18F-FDG–equivocal lymph nodes in the subgroup of histologically positive lymph nodes (P = 0.82). The change in density between the native phase and the contrast-enhanced phase did not significantly differ when affected lymph nodes were compared with nonaffected lymph nodes (P = 0.72).
Regarding metric and volumetric parameters, histologically proven metastatic lymph nodes had a significantly higher SAD than histologically negative ones. In nonenhanced CT scans, positive lymph nodes had a median SAD of 13.5 mm (range, 4.9 to 25.5 mm; Fig. 3B; Table 3), compared with 5.8 mm in negative ones (range, 3.5 to 20.8 mm; P < 0.001; Fig. 3B; Table 3). The median volume was 3.7 mL (range, 0.17 to 15.8 mL) for affected lymph nodes and 0.38 mL (range, 0.15 to 5.56 mL) for lymph nodes free of tumor tissue (Fig. 3C; Table 3; P < 0.001).
Cumulated Histogram and Density Spread
Regarding the spread of mean densities, 92% of the affected lymph nodes had a mean density of more than 20 HU (Fig. 5A). In the synopsis of all 60 examined lymph nodes, we found a possible cutoff value of 20 HU: 77% of the lymph nodes with a density of more than 20 HU were malignant, whereas 82% of lymph nodes with a density of less than 20 HU were benign. In the interval between −20 HU and +20 HU, 86% of the lymph nodes were benign (Figs. 5A and 5B).
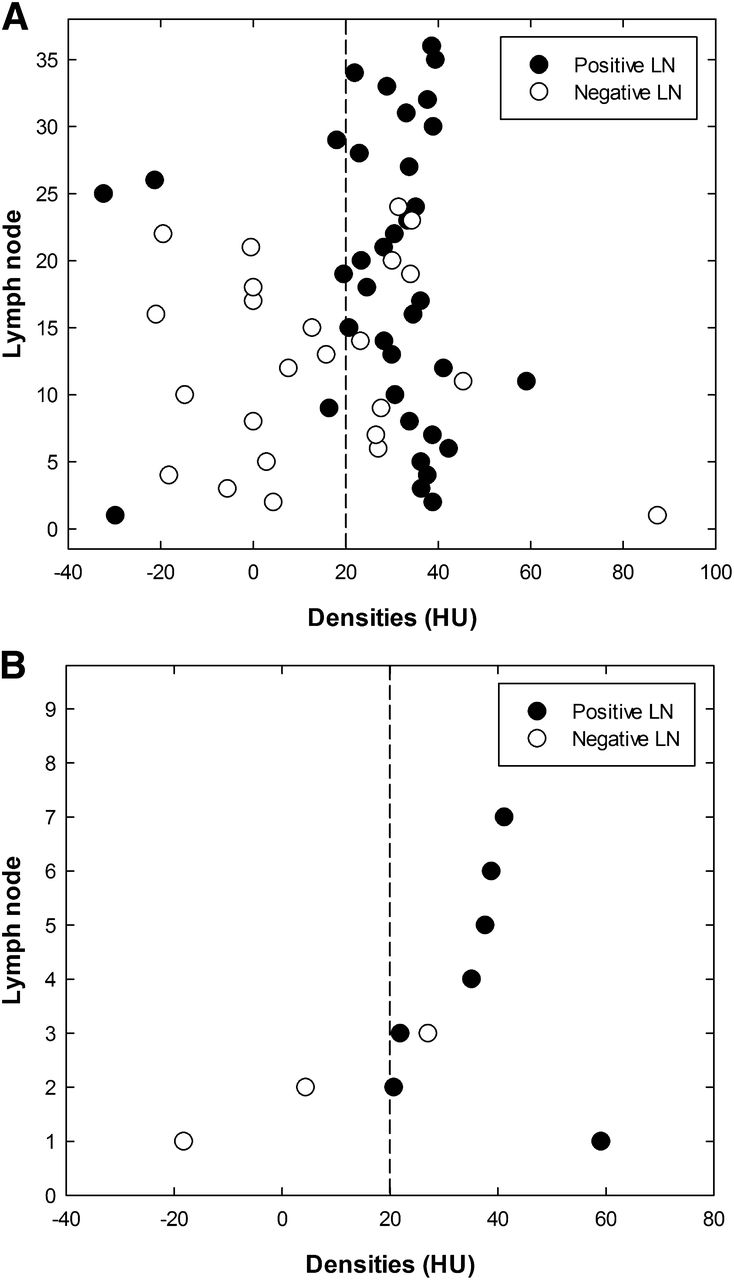
Mean histogram and density spread. (A) Density spread of affected lymph nodes (positive) vs. nonaffected lymph nodes (negative). Seventy-seven percent of lymph nodes with density higher than 20 HU were malignant; 82% of lymph nodes with density below 20 HU were benign. (B) Density spread in subgroup of 18F-FDG–equivocal lymph nodes: 100% of lymph nodes below 20 HU cutoff were benign (negative); 88% of lymph nodes with density above 20 HU were malignant (positive). LN = lymph node
Regarding the ten 18F-FDG–equivocal lymph nodes, all below the 20-HU cutoff were benign, whereas 88% with a density above 20 HU were malignant (Fig. 5B).
DISCUSSION
We confirmed the hypothesis of this study by performing a histogram analysis of the CT density values of histologically proven metastatic versus nonmetastatic lymph nodes in lung cancer patients. The findings from semiautomated volumetric CT histogram analysis were independent of 18F-FDG uptake on PET/CT and correlated with metric and volumetric lymph node parameters. Moreover, a possible cutoff of 20 HU was found, with 88% of the 18F-FDG–equivocal lymph nodes above this value being malignant.
Lymph node evaluation is crucial in diagnostic tumor staging, therapeutic planning, and even postsurgical prognostic assessment. 18F-FDG PET/CT is the gold standard for noninvasive lymph node staging in patients with non–small cell lung cancer because of the high accuracy that has been proven in many studies (7–13). One advantage of integrated 18F-FDG PET/CT is the coregistration of functional 18F-FDG PET and high-resolution CT, which allows for detailed analysis of relatively small structures such as mediastinal lymph nodes (14). According to version 1.1 of the Response Evaluation Criteria in Solid Tumors, metric parameters, especially SAD, are of interest in the evaluation of response to therapy (15). A study by Buerke et al. showed low slice thicknesses to be beneficial in the analysis of metric parameters in semiautomated lymph node segmentation, and the investigators therefore recommended that thicknesses not exceed 3 mm, especially in follow-up settings with different radiologists (16). A study by Fabel et al. also recommended a slice thickness of 3 mm or less but suggested a soft-tissue kernel for mediastinal lymph node evaluation (17). A preclinical work by Jensen et al. found that density changes of malignant lymph node in breast cancer patients could accurately be detected using x-ray phase contrast microtomography (18). Therefore, they see high potential for this technique in noninvasive axillary staging of breast cancer patients. The promise of this trend toward a future noninvasive method of lymph node classification via density measurements seems to be supported by the results of our study, which found an incidence of 88% for malignant findings in lymph nodes above the cutoff of 20 HU in the group of 18F-FDG–equivocal lymph nodes.
Our study showed that when SUVmax fell into the interval between 1- and 3-fold the level of the blood pool, lymph node density provided additive criteria in the evaluation of mediastinal and hilar lymph node status. In general, several studies found a higher SUVmax regarding the primary tumor in T2–T4 tumors than in T1 tumors (19), but reliable discrimination of different tumor entities is still not possible by the measurement of SUV alone (14). Nevertheless, recent studies proved that 18F-FDG uptake varied between histologic tumor types, with adenocarcinomas generally being less 18F-FDG–avid than squamous cell carcinomas (20). Besides the advantages of an integrated 18F-FDG PET/CT study, an additional tissue-based lymph node staging for the initial tumor classification is recommended in most cases, because a sensitivity of 84% and specificity of 85% in 18F-FDG PET/CT is still below the threshold of 95% needed to clearly rule in or out lymph node invasion (14).
In daily routine, lymph node staging is performed with 18F-FDG uptake and short-axis anatomic measurements (15,21,22). As an additional determinant of initial tumor stage and therapy response, volumetric lymph node analysis is reported to be promising (17,23,24). In patients with lymph node manifestations of malignant lymphomas, volumetric lymph node analysis is reported to be significantly superior to the established measurement of long-axis diameter (25). Nevertheless, the use of lymph node volumetry seems to be dependent on the tumor entity, since semiautomated lymph node volumetry did not have added value for the characterization of lymph nodes in patients with malignant melanomas (26). Especially for metric analysis, the role of semiautomated measurement is under current discussion, since a huge amount of data will have to be evaluated in the field of oncologic imaging (27). Regarding the assessment of SAD, long-axis diameter, and volume in patients with non–small cell lung cancer, Beyer et al. showed no benefit to the use of semiautomated 3D measurements for differentiating between benign and malignant lymph node infiltration (13).
Because lung cancer patients can present with nonspecific findings in 18F-FDG PET/CT, noninvasive staging is often complemented by transbronchial ultrasound, transbronchial biopsy, and mediastinoscopy. Mediastinoscopy is reported to be the most dependable of the invasive staging methods, whereas a complete endosonographic assessment of the mediastinum is reported to improve on invasive staging by serving as a first and minimally invasive staging procedure (3). However, not all lymph node regions can be sampled by transbronchial biopsy or mediastinoscopy, making video-assisted thoracoscopy or even thoracotomy sometimes necessary. Because noninvasive staging techniques do not always reach the threshold of 95% to classify a tumor entity and clearly rule in or out lymph node invasion, invasive staging procedures are still essential. In this context, volumetric CT histogram analysis may help find high-yield targets for precise core biopsies and potentially reduce the number of futile thoracotomies.
Relevant limitations of this study are its retrospective approach and the relatively small number (60) of histologically proven lymph nodes in decided lymph node areas on PET/CT. The latter limitation is due to the fact that histologic reports usually state the patient’s TNM status but do not always clearly identify the locations of the affected or nonaffected lymph nodes. Therefore, future work in this field should include prospective trials of larger numbers of patients, including dedicated per–lymph node analysis. Moreover, one should prospectively evaluate whether histogram and metric lymph node analyses in 18F-FDG PET/CT can lead to treatment changes, including identifying optimal nodes for improving the yield of biopsy. The recent introduction of gated (both respiratory and cardiac) PET may translate into a further improvement of the PET portion of PET/CT and may help to reduce the number of 18F-FDG–equivocal findings once the next generation of PET/CT scanners becomes more broadly available (28). However, unequivocal findings will always remain a topic in imaging, and we believe that the additional evaluation criteria presented in this work will soon prove to be of substantial importance for hybrid imaging.
CONCLUSION
3D histogram analysis in nonenhanced CT seems to be a promising imaging surrogate for N-staging stratification in patients with lung cancer, especially those with equivocal 18F-FDG uptake during metabolic imaging. In cases of doubtful 18F-FDG PET status, this technique might potentially bridge the diagnostic gap between noninvasive techniques and the first step of invasive techniques.
DISCLOSURE
The costs of publication of this article were defrayed in part by the payment of page charges. Therefore, and solely to indicate this fact, this article is hereby marked “advertisement” in accordance with 18 USC section 1734. This work was supported by grants from the Bundesministerium für Bildung und Forschung (82DZL00401 and 82DZL00402). No other potential conflict of interest relevant to this article was reported.
Acknowledgments
We thank Dr. Lutz Edler (German Cancer Research Center, Heidelberg, Germany) for statistical support. We thank Jutta Jung (German Cancer Research Center, Heidelberg, Germany) and Mike Reiss for support in graphic design
Footnotes
Published online Feb. 13, 2014.
- © 2014 by the Society of Nuclear Medicine and Molecular Imaging, Inc.
REFERENCES
- Received for publication June 28, 2013.
- Accepted for publication October 28, 2013.


