


Abstract
The steroid hormone estrogen is important for brain functioning and is thought to be involved in brain diseases, such as Alzheimer disease and depression. The action of estrogen is mediated by estrogen receptors (ERs). To understand the role of estrogens in brain functioning, it is important to study ERs in the brain. The aims of the present study were to determine whether ERs could be measured in the rat brain by PET with the ER ligand 16α-18F-fluoro-17β-estradiol (18F-FES) and to evaluate whether tracer uptake was affected by endogenous estrogen. Methods: Small-animal PET was used to determine 18F-FES uptake in female rats in the diestrous phase of the estrous cycle, the proestrous phase, and after ovariectomy. Coinjection of 18F-FES with 17β-estradiol was performed to determine whether tracer binding was specific for ERs. Additionally, 18F-FES uptake was quantified with kinetic modeling in female rats in the proestrous phase and after ovariectomy and in male rats. Results: The highest levels of uptake of 18F-FES were found (in descending order) in the pituitary, hypothalamus, bed nucleus of the stria terminalis, and amygdala. Other brain regions showed low levels of brain uptake. The level of 18F-FES uptake was higher in the pituitary and hypothalamus in rats after ovariectomy than in rats in the proestrous phase. Coinjection with 17β-estradiol resulted in a decrease in 18F-FES uptake in the pituitary and hypothalamus. The volume of distribution and binding potential determined with kinetic modeling were higher in the pituitary than in the other brain regions in all 3 groups. No differences were found among the groups. Conclusion: 18F-FES PET imaging of ER availability in the rat brain is feasible for brain regions with high ER densities.
Estrogens are a group of steroidal hormones (e.g., estradiol, estrone, and estriol) that play a key role in the development and maintenance of female sexual function. In addition, estrogens are involved in brain processes (1). The actions of estrogens are mediated by specialized hormone receptors, called estrogen receptors (ERs). Two classes of ERs have been identified: the intracellular nuclear receptors ERα and ERβ and the G protein–coupled ER (2,3). Estrogens easily diffuse through the blood–brain barrier to occupy ERs localized in specific brain regions to exert important regulatory effects on neuronal functioning and behavior (1). However, estrogens not only are produced by the ovaries but also can be produced locally inside the brain.
The importance of estrogens for brain functioning is reflected by the changes that can occur in postmenopausal women, in whom levels of circulating estrogens have significantly decreased (4). Postmenopausal women may experience psychologic changes and cognitive deficits and may develop depression (5). A prolonged deficiency of estrogens has also been associated with an increased risk of developing dementia, including Alzheimer disease (5,6). Hormonal treatment with estradiol was found to enhance or facilitate cognition and reduce depression in postmenopausal women and in animal models of reproductive senescence, that is, ovariectomized (OVX) rats (7–9). Estrogen replacement therapy in postmenopausal women was also found to reduce the symptoms of dementia and may even protect against the development of Alzheimer disease (10). In addition to the beneficial effects of estrogen treatment in postmenopausal women, estrogen therapy has been suggested to improve mood in perimenopausal women (8). There is evidence that estrogens have an antidepressant effect, either alone or in combination with classic antidepressants (11,12).
Although estrogens have been suggested to be involved in brain diseases, such as depression and dementia, the exact mechanism of the involvement of estrogens remains unclear. Moreover, the beneficial effect of estrogens in depression and dementia is still a matter of debate (13). The beneficial effects of estrogens have been studied mainly by manipulating circulating estrogen levels in animals and humans. Because ERs mediate the actions of estrogens, it is also important to study ER expression in the brain. Changes in ER expression may be partly responsible for the development of depression and dementia. In addition, insight into the quantity of ERs in the brain may predict the efficacy of estrogen treatment.
PET can play an important role in revealing the role of ERs in the diseased brain because it allows for noninvasive quantification of the receptors. A few PET tracers have been designed for the imaging of ERs in breast cancer (14) for diagnosis and monitoring of treatment efficacy. 16α-18F-fluoro-17β-estradiol (18F-FES) is a selective PET tracer that is widely used for the imaging of ERs in tumors and that has the potential to be used for the imaging of ERs in the brain. The cerebral kinetics of 18F-FES in the female rat brain have been described by Moresco et al. (15), who showed that 18F-FES may be a suitable tracer for the measurement of ERs in central nervous system regions with high receptor densities. In that study, brain uptake of 18F-FES was measured ex vivo. Small-animal PET can be used to measure brain uptake and quantify ER availability in vivo. However, the use of 18F-FES for the quantification of ERs in the rat brain with small-animal PET has not been described yet. Therefore, in the present study we aimed to determine whether 18F-FES could be used to quantify the availability of ERs in the rat brain with small-animal PET. In addition, we investigated how circulating estrogens affect the binding of 18F-FES to brain ERs.
MATERIALS AND METHODS
Animals
Male (9–12 wk old, 300–370 g) and female (9–12 wk old, 200–250 g) outbred Wistar–Unilever (specific pathogen–free) rats were obtained from Charles River and Harlan, respectively. The rats were group housed in polycarbonate (Makrolon; Bayer) cages on a layer of wood shavings in a room with a constant temperature (21°C ± 2°C) and a fixed 12-h light–dark regimen. Standard laboratory chow and water were available ad libitum. After arrival, the rats were allowed to acclimatize for at least 7 d. During acclimatization and study, all rats were handled daily. The Animal Ethics Committee of the University of Groningen, Groningen, The Netherlands, approved all experiments (protocol number DEC5842A).
Study Design
The study was divided into 2 parts. In the first part, rats underwent a dynamic small-animal 18F-FES PET scan for 90 min, followed by ex vivo biodistribution, to examine the effect of circulating estrogens on 18F-FES uptake and to determine whether 18F-FES uptake is specific for ERs. Female rats were divided into 4 groups: 1, rats in the diestrous phase of the estrous cycle (low levels of circulating estrogen—about 30 pg/mL; n = 5); 2, rats in the proestrous phase of the estrous cycle (high levels of circulating estrogen—about 65 pg/mL; n = 5); 3, OVX rats (no circulating estrogen; n = 4); and 4, OVX rats coinjected with 17β-estradiol (0.3 μg/g; for blocking of the estrogen receptor; n = 4).
In the second part of the study, 18F-FES uptake was quantified with pharmacokinetic modeling. Rats underwent a dynamic small-animal 18F-FES PET scan for 90 min, during which blood samples were taken for measurements of plasma input and radioactive metabolites. This part was performed with 3 groups of rats: 1, OVX rats (n = 5); 2, rats in the proestrous phase of the estrous cycle (n = 4); and 3, male rats (n = 4).
Vaginal Smearing and Cytology
The phase of the estrous cycle was assessed from vaginal smears collected once daily for 7 consecutive days at the same time point, that is, between 9:00 and 12:00 am. To obtain vaginal smears, researchers used one hand to hold rats behind the shoulder blades in a supine position and the other hand to hold a micropipette and restrain the tail. Approximately 200 μL of saline was inserted gently into the entrance of the vagina to a depth of 2–5 mm with a micropipette. Saline was flushed into the vagina and drawn back into the micropipette 2 or 3 times. Care was taken not to insert the micropipette too deeply into the vagina because stimulation of the cervix can cause pseudopregnancy.
A wet vaginal smear was made of the saline containing the cells. The saline was placed on an untreated glass slide and viewed under a microscope at a low magnification to determine the phase of the estrous cycle on the basis of vaginal cytology. Vaginal cytology images were taken with a SPOT insight camera on an Olympus PROVIS AX70 fluorescence microscope at ×10 magnification.
Ovariectomy
Female rats were anesthetized with isoflurane mixed with oxygen (5% induction and 2.5% maintenance) at a flow rate of 2 mL/min. After the induction of anesthesia, the rats were shaved on both sides of the abdomen, and the skin was sterilized with ethanol. A small incision (∼1 cm) was made on the right side through the skin, connective tissue, and muscle layer. The ovary, associated fat pad, fallopian tube, and upper uterine horn were exteriorized. A suture knot (3-0 silk) was tied around the blood vessels supplying the ovary, after which the ovary and a small part of the uterus were removed and discarded. The muscle layer and the skin were closed with 3-0 chromic sutures. The same procedure was performed on the left side. Rats received a subcutaneous injection of finadyne (Flunixin; Schering-Plough NV/SA; 2.5 mg/kg) for pain relief immediately after surgery and at 24 h after surgery. Rats were allowed to recover for 12 d before they were subjected to small-animal PET.
18F-FES Synthesis
18F-FES was produced according to the 2-step method described by Römer et al. (16). The process for manufacturing 18F-FES was fully automated (Zymark robotic system). 18F-FES was purified by high-performance liquid chromatography, formulated in 10% ethanol in water for injection, and sterilized by filtration over a 0.22-μm filter into a sterile multidose vial. The radiochemical yield of 18F-FES was 28% ± 15%, and the radiochemical purity was greater than 99%. The specific activity of 18F-FES was 0.34 ± 0.35 GBq/nmol. The required amount of radioactivity was aspirated in a syringe and diluted with 0.9% sodium chloride solution before injection.
Small-Animal PET Studies
On day 12 after ovariectomy, when rats were in the appropriate estrous phase (i.e., female rats in the proestrous or diestrous phase) or were acclimatized (i.e., male rats), they were subjected to a small-animal PET scan. The rats were anesthetized with isoflurane mixed with medical air (5% induction and 2.5% maintenance), and a catheter (0.8-mm outer diameter; 0.4-mm inner diameter) was inserted into the femoral vein for the injection of 18F-FES. After cannulation, rats were positioned in the small-animal PET scanner (Focus 220; Siemens Medical Solutions) in a transaxial position with their heads in the field of view. A transmission scan of 515 s with a 57Co point source was obtained for the correction of attenuation and scatter by tissue. After the transmission scan was complete, 18F-FES was injected via the cannula into the femoral vein (injected dose, 27 ± 16 MBq; 18F-FES concentration, 0.37 ± 0.25 mg/L; amount of 18F-FES injected, 637 ± 430 pmol). Simultaneously with the injection of 18F-FES, an emission scan of 90 min was started. For blocking of 18F-FES uptake in OVX rats, 17β-estradiol (Sigma-Aldrich; 0.3 μg/g of rat) was coinjected with 18F-FES.
The list-mode data of the emission scan were separated into 23-frame sinograms (8 × 30, 2 × 60, 2 × 120, 2 × 150, 3 × 300, and 6 × 600 s), which were iteratively reconstructed (2-dimensional ordered-subset expectation maximization; 4 iterations; 16 subsets) after being normalized and corrected for attenuation, scatter, randoms, and decay.
Ex Vivo Biodistribution
After the PET scan, rats from the first part of the study were sacrificed by extirpation of the heart under deep anesthesia. The brain and peripheral tissues were isolated, and blood was centrifuged (6,000g for 5 min) to collect a plasma sample. The brain, peripheral organs, and plasma were weighed and analyzed for the amount of radioactivity with a γ counter (LKB-Wallac). Tracer uptake was expressed as the standardized uptake value (SUV), which was defined as tissue activity concentration (cpm/g)/[injected dose (counts per minute)/body weight (grams)].
Arterial Blood Sampling
Arterial blood sampling was performed in the second part of the study to generate a plasma input curve and for metabolite analysis. In addition to the insertion of a catheter into the femoral vein, a catheter (0.8-mm outer diameter; 0.4-mm inner diameter) was inserted into the femoral artery. During the scan, blood samples of approximately 100 μL were taken at 15, 30, 45, 60, 75, 90, 120, 180, 300, 450, 600, 900, 1,800, 3,600, and 5,400 s after 18F-FES injection. After each blood sample was drawn, 0.1 mL of heparinized saline was injected to prevent large changes in blood pressure. During sampling, the amount of blood taken was about 7.8%–11.7% of the total blood volume; this amount was, in most cases, within the 10% that is considered to be safe for the health of rats. The replacement of blood with heparinized saline at each time point had only a minimal effect on the concentration of 18F-FES. Collected blood was centrifuged at 13,000 rpm for 5 min, and the radioactivity in 50 μL of the plasma sample was measured with a γ counter (LKB-Wallace). After the radioactivity measurement, 100 μL of acetonitrile were added to the plasma sample to precipitate proteins. Next, the mixture was stirred in a vortex mixer and centrifuged at 13,000 rpm for 5 min. A total of 2.5 μL of the supernatant were applied to a silica gel thin-layer chromatography plate. The plate was dried and run with an elution medium consisting of ethyl acetate and n-hexane (30:70) (the Rf of 18F-FES was 0.5–0.6; the Rf of radiometabolites was 0). The plate was placed on a phosphor storage screen for overnight exposure, after which the screen was examined with a Cyclone reader (Leica Geosystems) and analyzed with OptiQuant software (OptiQuant, version 3.00; Packard Instrument Co.) to calculate the percentages of intact parent compound and metabolites.
PET Image Analysis
PET image analysis was performed with Inveon 3.0 software (Siemens Medical Solutions). Regions of interest were drawn around the amygdala, bed nucleus of the stria terminalis (BNST), brain stem, cerebellum, frontal cortex, hippocampus, hypothalamus, midbrain, parietal/temporal/occipital cortex, prefrontal cortex, pituitary gland, striatum, and thalamus on a T2-weighted MR imaging template. The PET scan was manually coregistered with the MR imaging template. Time–activity curves were generated for each region of interest. Tracer uptake was most stable at 80–90 min after injection; therefore, uptake in this time frame was chosen for comparison of groups. Tracer uptake was expressed as the SUV, which was defined as tissue activity concentration (Bq/cm3)/[injected dose (becquerels)/body weight (grams)]. It was assumed that 1 cm3 of brain tissue equaled 1 g.
Kinetic modeling was used to quantify the brain uptake of 18F-FES with a metabolite-corrected plasma-derived input function. The Akaike information criterion (AIC) was used to determine which model fitted the data best. The reversible 2-tissue compartment model with a fixed blood volume (i.e., 4%) provided the best fit and was therefore used to calculate the volume of distribution (VT) and binding potential (BPND):

Statistical Analysis
All data are expressed as mean ± SD. Statistical analysis was performed with PASW for Windows, version 18.0 (SPSS Inc.). Data were analyzed with 1-way ANOVA or general linear model repeated measures and then a Bonferroni post hoc test. General linear model repeated measures were used for statistical analysis of time–activity curves; 18F-FES uptake (SUV) at various time points was used as the within-subject factor. Significance was reached when the P value was less than 0.05.
RESULTS
Vaginal Smearing and Cytology
The phases of the estrous cycle were clearly differentiated by cytology. Round nucleated cells of a uniform size characterized the proestrous phase; the estrous phase was characterized by irregularly shaped, nonnucleated cornified cells; the metestrous phase was characterized by many leukocytes and cornified cells; and the diestrous phase was characterized by both nucleated cells and leukocytes (Fig. 1). Vaginal smearing revealed a 4-d estrous cycle in 11 of the 18 female rats, but 7 rats had a 5-d estrous cycle, with either an extra day in the estrous (2 rats) or diestrous (5 rats) phase.
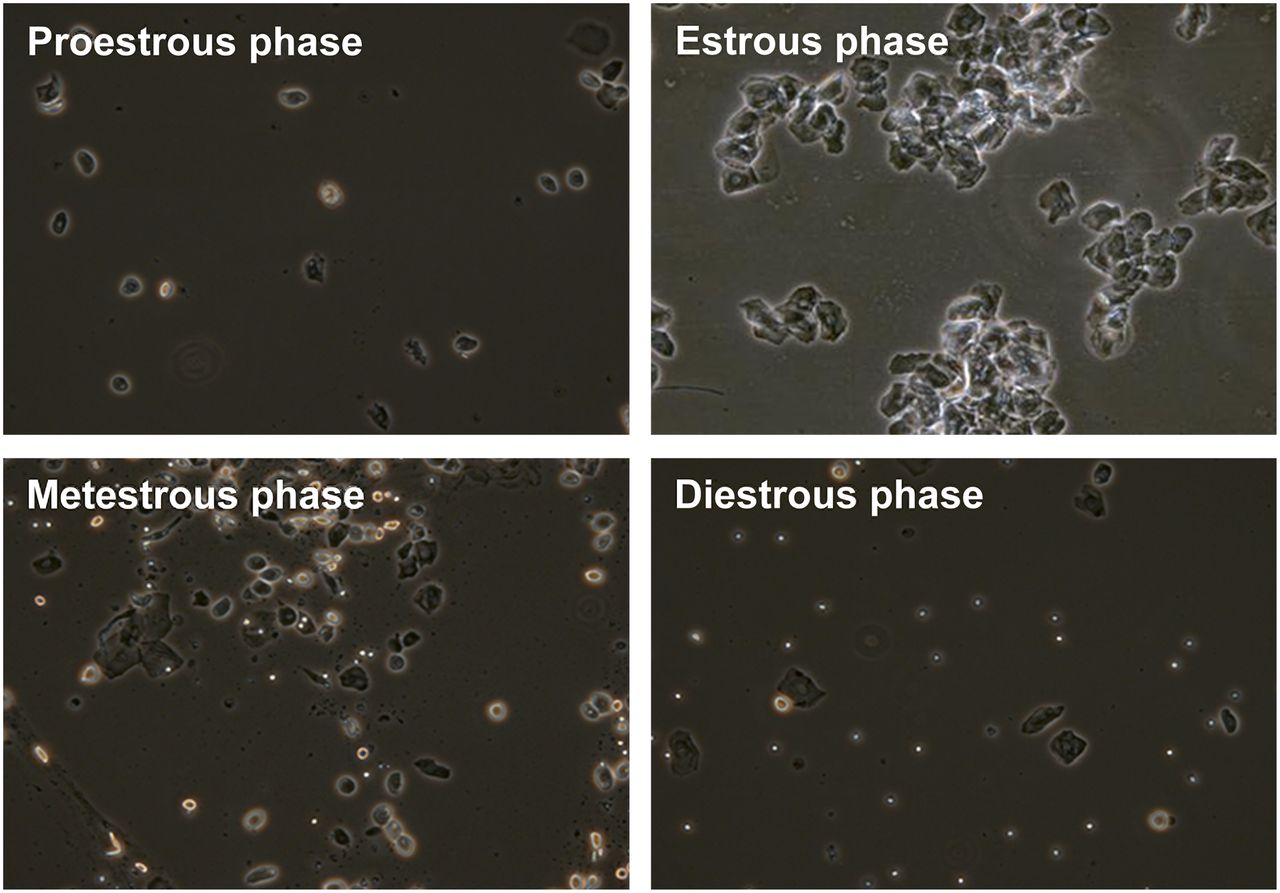
Vaginal cytology of rats during different stages of estrous cycle (×10).
Ex Vivo Biodistribution of 18F-FES
The total brain uptake of 18F-FES in OVX rats was 0.065 ± 0.016. In comparison, total brain uptake was lower in rats in the diestrous phase (0.059 ± 0.015) and the proestrous phase (0.045 ± 0.015) but higher in OVX rats pretreated with 17-β-estradiol (0.081 ± 0.035). However, these differences among the groups were not statistically significant (P > 0.05).
In peripheral organs, the highest levels of uptake were observed in the duodenum, kidneys, liver, and pancreas in all groups. Statistical analysis of the 4 groups revealed a significant main effect in the heart, lungs, pancreas, thymus, and fat tissue (P < 0.05) and in the spleen (P < 0.001). Post hoc analysis revealed significantly lower levels of uptake in the heart, lungs, and spleen of rats in the proestrous phase than in those of OVX rats (49%–51%; P > 0.05). Coinjection with 17β-estradiol resulted in significantly lower levels of uptake in the spleen and thymus of OVX rats than in those of rats in the diestrous phase and OVX rats not given 17β-estradiol (61%–73%; P < 0.05), and coinjection with 17β-estradiol resulted in higher levels of uptake in the pancreas and fat tissue of OVX rats than in those of rats in the proestrous phase (47%–67%; P < 0.05).
Small-Animal PET with 18F-FES
Small-animal PET data were acquired for 90 min after 18F-FES injection. PET images and time–activity curves of brain regions with low (striatum) and high (pituitary) levels of uptake are shown in Figures 2 and 3, respectively. The time–activity curves showed that uptake reached a maximum at about 1 min after the injection of 18F-FES, followed by a rapid washout. From about 30 min after the injection of 18F-FES, uptake remained relatively stable over time, although a small decrease could still be observed. Statistical analysis of the time–activity curves did not reveal differences among rats in the diestrous phase, rats in the proestrous phase, and OVX rats. Coinjection of 18F-FES with 17β-estradiol resulted in a significantly lower level of 18F-FES uptake over time in the pituitary of OVX rats than in that of rats in the diestrous phase (P < 0.05) and OVX rats (P < 0.05); coinjection of 18F-FES with 17β-estradiol in OVX rats resulted in higher levels of 18F-FES uptake over time in the brain stem, cerebellum, frontal cortex, and parietal cortex than in those of OVX rats not given 17β-estradiol (P < 0.05) and rats in the diestrous phase (brain stem and cerebellum only; P < 0.05).
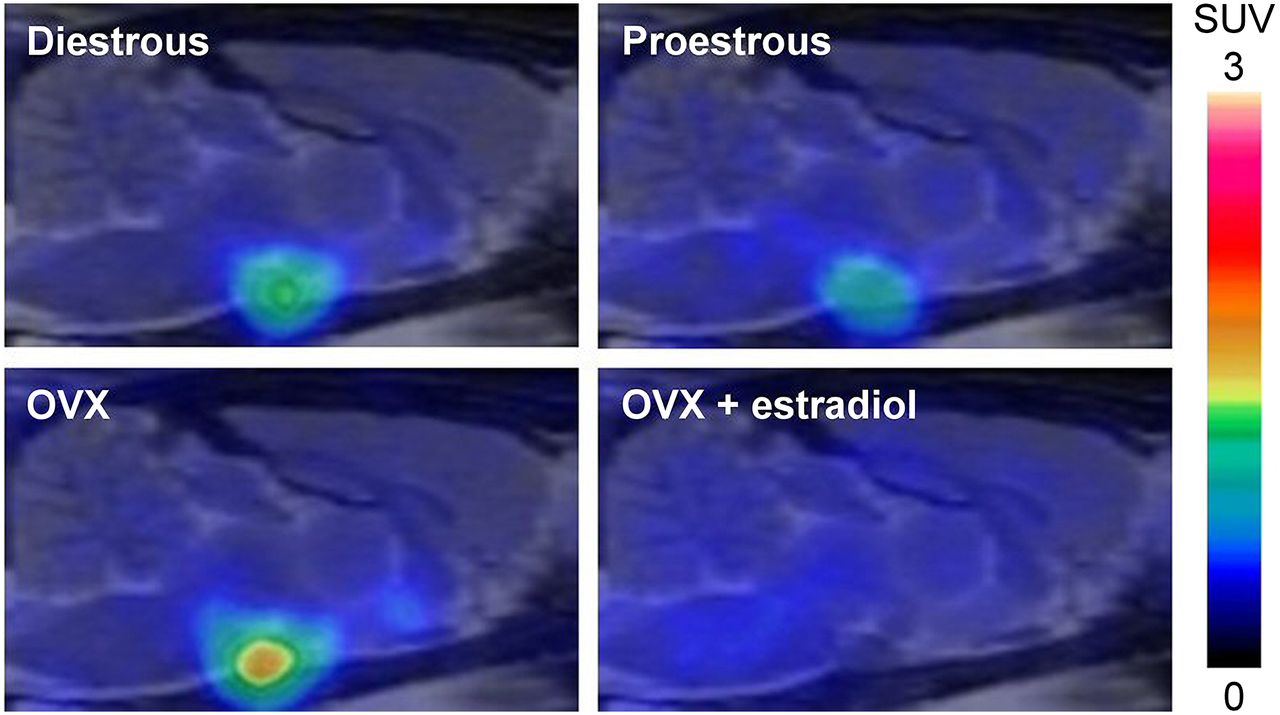
Small-animal 18F-FES PET images of rats in diestrous phase of estrous cycle (diestrous) and proestrous phase of estrous cycle (proestrous), OVX rats (OVX), and OVX rats that were pretreated with 17β-estradiol (OVX + estradiol). Sagittal images, coregistered with MR imaging template for anatomic reference, show 18F-FES uptake (SUV) at level of pituitary from 60 to 90 min after injection.

Time–activity curves for 18F-FES (SUV) in striatum (A) and pituitary (B) of rats in diestrous phase of estrous cycle (diestrous) and proestrous phase of estrous cycle (proestrous), OVX rats (OVX), and OVX rats that were pretreated with 17β-estradiol (OVX + estradiol). *P < 0.05 compared with value for OVX rats given estradiol.
18F-FES uptake (SUV) at 80–90 min after injection was used to determine the distribution of 18F-FES in the brain and whether this distribution was affected by differences in the levels of circulating estrogens (Table 1). Between-brain-area analysis revealed that in rats in the diestrous phase, rats in the proestrous phase, and OVX rats, the highest level of uptake was observed in the pituitary (4.4–18.9 times higher than that in other brain regions; P < 0.001). Higher levels of uptake that were statistically significant were also observed in the hypothalamus of rats in the diestrous phase (2.4–3.7 times higher than those in all other areas, except for the BNST, midbrain, and pituitary; P < 0.01) and OVX rats (3.3–4.1 times higher than those in the brain stem, cerebellum, striatum, and cortical areas; P < 0.05). Comparison of the SUVs of 18F-FES among the groups revealed significantly higher levels of uptake in the hypothalamus and pituitary of OVX rats than in those of rats in the proestrous phase (P < 0.05).
Brain Uptake of 18F-FES 80–90 Minutes After Injection
In OVX rats in which 18F-FES was coinjected with 17β-estradiol, no significant differences were found among the various brain regions. In comparisons among groups, significantly lower levels of uptake were seen in the pituitary of OVX rats in which 18F-FES was coinjected with 17β-estradiol than in all other groups (P < 0.01) and in the hypothalamus of OVX rats in which 18F-FES was coinjected with 17β-estradiol than in OVX rats not given 17β-estradiol (P < 0.01). In contrast, coinjection of 18F-FES with 17β-estradiol in OVX rats resulted in higher levels of uptake in the cerebellum, brain stem, hippocampus, and striatum of OVX rats than in those of rats in the diestrous and proestrous phases (P < 0.05).
Plasma Activity of 18F-FES
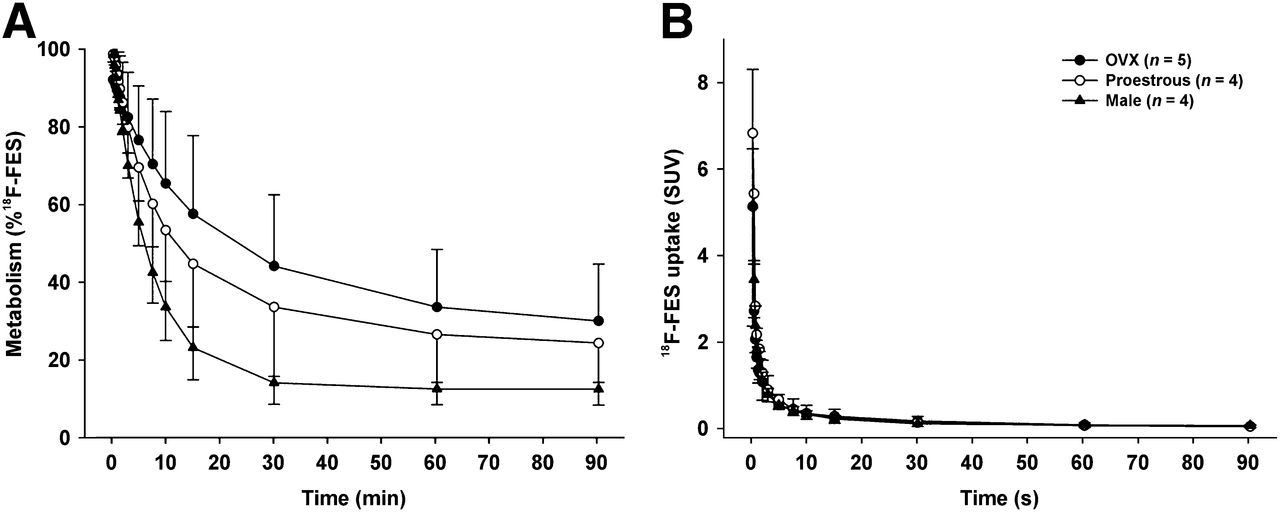
In plasma, 18F-FES was rapidly metabolized into hydrophilic metabolites (Fig. 4A). The rates of metabolism among the groups were different. The fastest rates of metabolism were observed (in descending order) in male rats (50% metabolized at 6 min), rats in the proestrous phase (50% at 12 min), and OVX rats (50% at 24 min). However, these differences in metabolism were not statistically significant.

Metabolism (A) and metabolite-corrected plasma curves (B) for 18F-FES in OVX rats (OVX), rats in proestrous phase of estrous cycle (proestrous), and male rats (male).
Metabolite-corrected time–activity curves for plasma are shown in Figure 4B. Although differences in metabolism were observed, the 18F-FES levels in plasma did not differ among the groups, as was evident from the similarities in the time–activity curves.
Kinetic Modeling of 18F-FES
Given the low levels of uptake of 18F-FES in most of the brain regions, as shown by the PET data analysis, kinetic modeling was performed only for the brain regions with the highest densities of ERα (17): the amygdala, BNST, hypothalamus, and pituitary. These brain regions showed the highest levels of 18F-FES uptake in the first part of the study. The results of kinetic modeling with the reversible 2-tissue compartment model are shown in Table 2.
Kinetic Modeling of 18F-FES by Reversible 2-Tissue Compartment Model with 4% Fixed Blood Volume
The rate constants (i.e., K1, k2, k3, and k4) did not differ among the 3 groups, nor did they differ significantly among the brain areas. In addition, no significant differences in the K1/k2 ratios were found among the brain regions (data not shown). The VT and the BPND were higher in the pituitary (3–12 times; P < 0.05) than in the other brain areas in all 3 groups (except for the hypothalamus in OVX rats); this difference was statistically significant. No differences in the VT or BPND in any brain region were found among the groups.
DISCUSSION
To our knowledge, this is the first study in which the feasibility of small-animal PET with 18F-FES for in vivo quantification of the availability of ERs in the rat brain and the effects of circulating estrogens on 18F-FES binding in rats were examined.
The uptake (SUV) of 18F-FES observed in the present study was consistent with the known density of ERα in the rat brain (17). The highest levels of uptake were found in the amygdala, BNST, hypothalamus, and pituitary, whereas the levels of uptake in the remaining brain regions were low. Similar findings were reported previously by Moresco et al. (15), who observed high levels of uptake of 18F-FES in the pituitary and hypothalamus and low levels of uptake in the striatum and cortex. Although the levels of 18F-FES uptake were highest in the brain regions with the highest ERα densities, the levels of uptake generally (with the exception of that in the pituitary) were lower than those of PET tracers targeting other neuroreceptors. Coinjection of 18F-FES with 17β-estradiol decreased tracer uptake only in the pituitary and hypothalamus. Contrary to what was expected, coinjection with 17β-estradiol resulted in higher levels of uptake in some brain regions. This result could be ascribed to the blocking of 18F-FES uptake in peripheral tissues, leading to an increase in tracer availability in plasma, although the latter was not statistically significant.
The generally low levels of brain uptake of 18F-FES might simply be related to low levels of expression of ERs in the rat brain. The binding of 3H-estradiol (maximum number of binding sites, in fmol/mg of protein) in the brains of female rats after ovariectomy and adrenalectomy were reported by Lieberburg et al. (18) to be 178.2 for the pituitary, 12.07 for the hypothalamus, and 9.64 for the amygdala. Small-animal PET with 18F-FES may not be sensitive enough to detect low ER levels. However, the low levels of tracer uptake in the brain might also be attributable to the fast metabolism and rapid clearance of 18F-FES, resulting in a low level of availability of 18F-FES for binding in brain tissue. In humans, estrogens in blood are bound to albumin and sex hormone–binding globulin (SHBG). SHBG facilitates the transport of estrogens into ER-containing cells in peripheral tissue, whereas estrogens that are transported across the blood–brain barrier are albumin-bound (19). 18F-FES also binds to SHBG (20), and this binding affects its uptake into peripheral tissue. The binding of 18F-FES to SHBG protects the PET tracer from being metabolized. Rats lack SHBG (21); therefore, metabolism is faster in rats than in humans. The low levels of brain uptake of 18F-FES (SUV) in the present study therefore can be related to the low levels of intact 18F-FES in plasma. Despite the low levels of uptake, high VT and BPND were found in areas with high ERα densities, indicating that low levels in plasma rather than low levels of ER expression are responsible for the low levels of uptake.
High VT and BPND of 18F-FES were found especially in the pituitary, indicating that the amount of ER expression in this region was high. Estrogens are known to affect the production of pituitary hormones, such as luteinizing hormone, follicle-stimulating hormone, and thyroid-stimulating hormone, explaining the need for high levels of ER expression. One could argue that the high level of binding of 18F-FES in the pituitary and the low levels of binding in other brain regions are related to the blood–brain barrier, which is absent in the pituitary. The levels of 18F-FES uptake in brain tissue could be low because of poor penetration of the blood–brain barrier, for example, because of drug efflux transporters located in the blood–brain barrier. However, estrogens do easily cross the blood–brain barrier through passive diffusion, and this is likely to be true also for 18F-FES. In addition, the influx constant (K1) values are in the reference range observed for other PET tracers, indicating that the uptake of 18F-FES is not limited by the blood–brain barrier or efflux transporters. Given the high level of binding in the pituitary relative to the levels of binding in surrounding tissues and the limited resolution of the small-animal PET camera, the possibility that the high level of binding of 18F-FES in the pituitary causes spillover to neighboring brain areas, such as the hypothalamus, must be considered. Because differences in hypothalamic uptake were reported previously, we can assume that part of the signal is indeed explained by the uptake of 18F-FES in the hypothalamus.
The levels of uptake (SUV) in the hypothalamus and pituitary were statistically significantly higher in OVX rats than in rats in the proestrous phase, indicating that a higher level of endogenous estrogen reduces the uptake of 18F-FES. Likewise, the uptake of 2 ER-selective radiotracers, 16α-125I-iodoestradiol and 16α-125I-bromoestradiol, in the uterus and tumor of mature cycling rats was also found to be dependent on the levels of endogenous estrogen in blood (22). The highest levels of uterus and tumor uptake were found in rats in the diestrous phase, with low endogenous estrogen levels in blood, and the lowest levels of uptake were found in rats in the estrous phase, with high endogenous estrogen levels in blood. Remarkably, in the present study, no statistically significant differences in the VT and BPND were found among OVX rats, rats in the proestrous phase of the estrous cycle, and male rats. The lack of differences in the quantitative measures VT and BPND, but the significant differences in uptake (SUV), suggest that the delivery of 18F-FES to the brain is affected by circulating estrogens but that the binding to ERs is not. OVX rats exhibited the slowest metabolism of 18F-FES, which could result in increased delivery of intact tracer to the brain and hence could explain the higher SUV. However, the lack of differences could also be explained by the small group sizes and the large variations seen in the kinetic modeling outcomes, especially because the trends for VT and BPND were similar to those for uptake (SUV).
Although not statistically significant, there was a difference in the rate of metabolism, which was highest in male rats. The metabolism of steroid hormones is a rather complex mechanism, mainly involving the cytochrome P450 enzyme (CYP) families CYP1, CYP2, and CYP3. The expression of several CYPs was found to be sexually dimorphic (23,24), and a higher content of hepatic microsomal CYPs was found in male rats than in female rats (25). These findings could explain the faster metabolism found in male rats. In female rats, estrogens regulate hepatic CYPs (23), suggesting that they can influence their own metabolic rates. Although differences in the metabolism of 18F-FES were found, the average time–activity curves for 18F-FES in plasma were similar for male and female rats. The differences stress the importance of measuring radiometabolites in plasma individually.
CONCLUSION
Imaging of ER availability in the rat brain by small-animal PET with 18F-FES is feasible for brain regions with high ER densities, in particular, the pituitary. Quantitative analysis, that is, determining VT and BPND, is preferred over semiquantitative SUV analysis because the latter appears to be more sensitive to endogenous estrogen levels in blood; in addition, larger group sizes should be used to reduce variation. On the basis of the findings in rats, the use of 18F-FES for the imaging of ER availability in regions of the human brain with higher ER densities should be explored. For the imaging of ER availability in regions of the rat brain with lower densities, a tracer with a higher affinity for ERs should be developed. Additionally, the stabilization of 18F-FES with SHBG to yield greater availability of 18F-FES in rats could be explored, because humans have high levels of SHBG in blood; this scenario would allow better translation of findings. If successful, this approach would pave the way to PET imaging of brain regions with low ER densities in small animals and humans.
DISCLOSURE
The costs of publication of this article were defrayed in part by the payment of page charges. Therefore, and solely to indicate this fact, this article is hereby marked “advertisement” in accordance with 18 USC section 1734. No potential conflict of interest relevant to this article was reported.
Footnotes
Published online Jan. 30, 2014.
- © 2014 by the Society of Nuclear Medicine and Molecular Imaging, Inc.
REFERENCES
- Received for publication July 9, 2013.
- Accepted for publication November 1, 2013.


