


Abstract
Most cardiac sympathetic nerve radiotracers are substrates of the norepinephrine transporter (NET). Existing tracers such as 123I-metaiodobenzylguanidine (123I-MIBG) and 11C-(–)-meta-hydroxyephedrine (11C-HED) are flow-limited tracers because of their rapid NET transport rates. This prevents successful application of kinetic analysis techniques and causes semiquantitative measures of tracer retention to be insensitive to mild-to-moderate nerve losses. N-11C-guanyl-(–)-meta-octopamine (11C-GMO) has a much slower NET transport rate and is trapped in storage vesicles. The goal of this study was to determine whether analyses of 11C-GMO kinetics could provide robust and sensitive measures of regional cardiac sympathetic nerve densities. Methods: PET studies were performed in a rhesus macaque monkey under control conditions or after intravenous infusion of the NET inhibitor desipramine (DMI). Five desipramine dose levels were used to establish a range of available cardiac NET levels. Compartmental modeling of 11C-GMO kinetics yielded estimates of the rate constants K1 (mL/min/g), k2 (min−1), and k3 (min−1). These values were used to calculate a net uptake rate constant Ki (mL/min/g) = (K1k3)/(k2 + k3). In addition, Patlak graphical analyses of 11C-GMO kinetics yielded Patlak slopes Kp (mL/min/g), which represent alternative measurements of the net uptake rate constant Ki. 11C-GMO kinetics in isolated rat hearts were also measured for comparison with other tracers. Results: In isolated rat hearts, the neuronal uptake rate of 11C-GMO was 8 times slower than 11C-HED and 12 times slower than 11C-MIBG. 11C-GMO also had a long neuronal retention time (>200 h). Compartmental modeling of 11C-GMO kinetics in the monkey heart proved stable under all conditions. Calculated net uptake rate constants Ki tracked desipramine-induced reductions of available NET in a dose-dependent manner, with a half maximal inhibitory concentration (IC50) of 0.087 ± 0.012 mg of desipramine per kilogram. Patlak analysis provided highly linear Patlak plots, and the Patlak slopes Kp also declined in a dose-dependent manner (IC50 = 0.068 ± 0.010 mg of desipramine per kilogram). Conclusion: Compartmental modeling and Patlak analysis of 11C-GMO kinetics each provided quantitative parameters that accurately tracked changes in cardiac NET levels. These results strongly suggest that PET studies with 11C-GMO can provide robust and sensitive quantitative measures of regional cardiac sympathetic nerve densities in human hearts.
It has been more than 30 y since radioiodinated metaiodobenzylguanidine (MIBG) was first introduced for scintigraphic imaging of cardiac sympathetic innervation (1). Since then, several other radiotracers, including 11C-(–)-meta-hydroxyephedrine (11C-HED) and 11C-(–)-epinephrine (11C-EPI), have been developed to assess cardiac sympathetic nerve integrity with PET (2). Clinical studies with these tracers have made significant contributions to our understanding of cardiac sympathetic dysfunction in many diseases (3). In addition, recent studies point to an emerging role for cardiac neuronal imaging in the identification of heart failure patients at high risk for sudden cardiac death (4).
As structural analogs of the neurotransmitter norepinephrine, these tracers are actively transported into neurons by the norepinephrine transporter (NET) and stored in norepinephrine storage vesicles by the vesicular monoamine transporter 2. Retention of a tracer in vesicles is dependent on its structure—highly polar compounds such as 11C-EPI have long vesicular retention times, whereas more lipophilic compounds such as 11C-HED diffuse out of vesicles fairly quickly (5).
This approach to imaging sympathetic neurons has proven to be effective, providing high-quality cardiac images that roughly map the regional distribution of functional nerve terminals. However, a major limitation of the current generation of tracers is that their neuronal uptake rates, mediated by NET transport, are too rapid to allow accurate quantification of regional nerve densities. Rapid NET transport causes the net neuronal uptake of the tracers to be rate-limited by delivery from plasma to interstitium, rather than by NET-mediated neuronal uptake. Because delivery is governed primarily by perfusion, these are flow-limited tracers. As a result, their myocardial kinetics cannot be successfully analyzed using standard kinetic analysis methodology. The inability to obtain quantitative measures using kinetic analysis methods forces the use of semiquantitative measures of tracer retention as surrogate measures of nerve density, including the heart-to-mediastinum ratio for MIBG and the retention index for 11C-HED. However, because of the flow-limited uptake of the tracers, retention measures are insensitive to low-to-moderate levels of regional denervation and decline only when nerve losses become fairly severe (6).
To overcome these limitations, our laboratory has been developing new tracers with more optimal kinetics for quantifying regional nerve density. Our goal was to develop a tracer with 2 specific kinetic characteristics. First, a slower NET transport rate was needed, making this the rate-limiting step in the neuronal uptake of the tracer. Second, efficient trapping inside storage vesicles was desired, leading to long neuronal retention times (Fig. 1A). We hypothesized that a tracer with these properties could have its myocardial kinetics analyzed with a simple compartmental model in which the neurons act kinetically as a single irreversible compartment (Fig. 1B). In addition, these properties would allow the application of the Patlak graphical method for estimating the tracer’s net neuronal uptake rate (7).

(A) Comprehensive compartmental model of sympathetic nerve radiotracer with optimal kinetic properties. Arrow thicknesses are drawn in approximate proportion to magnitude of rate constants. If NET transport rate of tracer (k3) is less than efflux rate from interstitium back into plasma (k2), this prevents tissue uptake of tracer from being flow-limited. Furthermore, if vesicular storage rate (k5) is rapid relative to efflux from neuronal axoplasm (k4), and tracer is effectively trapped in vesicles (k6 = 0 or small), 2 neuronal compartments kinetically behave as single trapping compartment. This allows use of simplified compartmental model (B) for quantitative analysis of kinetic data from PET studies.
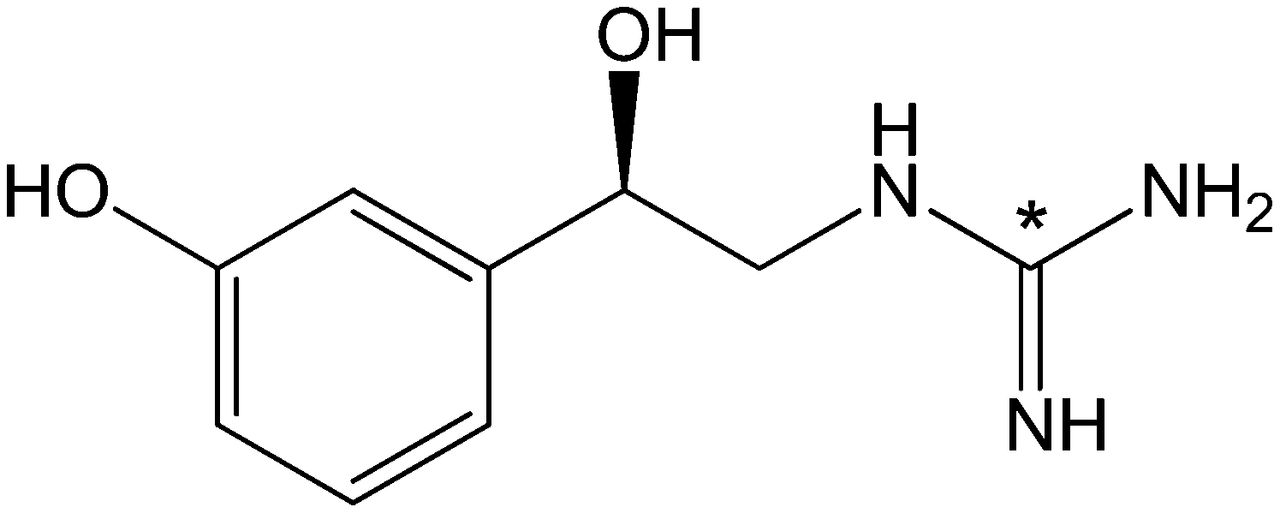
To this end, our studies of a series of 11C-labeled phenethylguanidines identified N-11C-guanyl-(–)-meta-octopamine (11C-GMO, Fig. 2) as a promising tracer exhibiting the 2 targeted properties (8). The goal of the current study was to test our hypothesis that 11C-GMO would exhibit myocardial kinetics that could be successfully analyzed with tracer kinetic techniques. We also evaluated the ability of quantitative measures from analyses of 11C-GMO kinetics to track declines in available NET densities, induced pharmacologically with the potent NET inhibitor desipramine.

Structure of 11C-GMO. 11C label is incorporated into guanidine group (*).
MATERIALS AND METHODS
Radiochemistry
11C-GMO and 11C-MIBG were synthesized as previously described (8). 11C-HED was prepared using previously published methods (9). Specific activities for these compounds were 18.5–55.0 TBq/mmol. 18F-FDG was prepared as previously described (10).
Animal Care
The care of all animals used in this study was done in accordance with the Animal Welfare Act and the National Institutes of Health’s Guide for the Care and Use of Laboratory Animals (11). Animal protocols were approved by the University Committee on Use and Care of Animals at the University of Michigan.
Isolated Rat Heart Studies
Kinetic studies of the neuronal uptake and retention of 11C-GMO, 11C-HED, and 11C-MIBG were performed with an isolated working rat heart system (8,12) under moderate workload conditions (10 cm H2O preload, 100 cm H2O afterload). For comparison, a study with 18F-FDG was performed under identical conditions except that the perfusate glucose concentration was changed from 5 to 10 mM. A 10-min constant infusion of tracer at low concentrations was performed to measure neuronal uptake rates. The heart was then switched to a second perfusion circuit with normal perfusate for 120 min to study tracer clearance from sympathetic nerve terminals. Coincidence counting rate data (cps/heart) from 2 opposing 5.1 × 5.1 cm cesium fluoride detectors were corrected for random coincidences and normalized to the activity concentration in perfusate (cps/mL perfusate) and the heart’s wet mass (g wet/heart) to express heart uptake of tracer as an apparent distribution volume (mL perfusate/g wet). Neuronal uptake rates Kup (mL perfusate/min/g wet) were determined as the linear slope of the apparent distribution volume data between 1 and 4 min of the constant infusion study. Clearance kinetics were fit to multiple exponential decay processes to characterize clearance rates. For the nerve tracers, 54 μM corticosterone was added to perfusate to block extraneuronal uptake (uptake-2) into myocytes (13), which competes with neuronal uptake (uptake-1) in rat hearts but is absent in nonhuman primate and human hearts (6).
PET Imaging
PET imaging was performed using a Concorde Microsystems microPET P4 primate scanner (19-cm field of view, 7.8-cm axial extent, 1.75-mm intrinsic spatial resolution, and 2.25% peak system sensitivity) (14). After the monkey was anesthetized, a percutaneous angiocather was placed in the saphenous vein of each leg (1 for tracer injection, 1 for blood sampling). Heart rate (bpm), blood oxygen saturation levels (SpO2), and body temperature were monitored continuously (V3404P; SurgiVet). A transmission scan was acquired using a rotating 68Ge/68Ga rod source for attenuation corrections. Dynamic PET data were acquired in list-mode for 60 min after 11C-GMO injection (24–44 MBq/kg). List-mode emission data were rebinned into a 24-frame dynamic sequence (12 × 10, 2 × 30, 2 × 60, 2 × 150, 2 × 300, and 4 × 600 s). Rebinned emission data were corrected for attenuation and scatter, and transaxial images were reconstructed using maximum a posteriori reconstruction (15), an iterative method that accounts for the detector point spread function in the model of the system.
Radiometabolite Analyses
Before imaging, a blood sample (1.5–2.0 mL) was drawn, and 3.7 MBq of 11C-GMO were added. This was incubated at 37°C for 60–70 min to determine tracer stability in blood. During the PET scan, 4 venous blood samples (1.5–2.0 mL) were drawn at 5, 15, 30, and 55 min to assess radiometabolites in plasma and partitioning of 11C-GMO between plasma and red blood cells (RBCs). Blood samples were centrifuged for 1 min at 12,000g to separate plasma and RBCs. Plasma was deproteinized by adding perchloric acid (HClO4; final concentration, 0.4N) and centrifuging for 5 min at 12,000g. The supernatant was neutralized with KOH (pH 7.0–7.5), filtered twice (0.22-μm filters; Millipore Millex/GS), and analyzed by high-performance liquid chromatography (HPLC) (10μ Hydro-RP column [Syergi]; 4.6 × 250 mm, 60 mM sodium phosphate buffer, pH 5.4, with 3% ethanol; flow rate, 1.0 mL/min) and radiation detection (905-4 NaI(Tl) detector; Ortec). The sample spiked with 11C-GMO was processed in the same way. Aliquots (0.1 mL) of whole blood, plasma, final supernatant, and pellets were counted in a γ-counter. Count data (decay-corrected) were used to determine the relative concentrations of 11C-GMO in plasma and whole blood (Cp/Cwb). HPLC and radiation detection data (decay-corrected) were processed for peak analysis (ACD/ChromProcessor, version 10; ACD Inc.) to determine the percentage of activity associated with intact 11C-GMO (fintact). A mathematic function describing the time course of the metabolic breakdown of 11C-GMO in plasma, fintact(t), was obtained by nonlinear regression analysis (Prism 3.0; GraphPad Software).
Tracer Kinetic Analyses
Summed images of the final 4 PET frames were used to draw regions of interest on the myocardial wall and on the blood pool in the basal left ventricular chamber to extract time–activity curves for myocardial tissue Ct(t) and whole blood Cwb(t). The plasma concentration of intact 11C-GMO versus time, Cp(t), was estimated by multiplying Cwb(t) by the metabolic breakdown function, fintact(t), and the mean ratio of activity concentrations in plasma and whole blood, Cp/Cwb. Thus, Cp(t) = Cwb(t)∣fintact(t)⋅[Cp/Cwb]. The plasma time–activity curve, Cp(t), was used with the tissue time–activity curve, Ct(t), for compartmental modeling. Nonlinear regression analysis with the simplified compartmental model (Fig. 1B) provided estimates of the rate constants K1 (mL/min/g), k2 (min−1), k3 (min−1), and a blood volume fraction, BV (dimensionless), using in-house analysis software. Rate constant estimates were used to calculate a net uptake rate constant Ki (mL/min/g) = (K1k3)/(k2 + k3), which reflects the rate of 11C-GMO accumulation into nerve terminals. Tissue and plasma kinetics of 11C-GMO were also analyzed using Patlak graphical analysis (7). After construction of a Patlak plot, the last 9 points of the plot were analyzed with linear regression to determine the Patlak slope, Kp (mL/min/g). Under ideal conditions, the Patlak slope, Kp, is a direct measure of the net uptake rate constant, Ki, and thus for the model structure shown in Figure 1B is also equal to (K1k3)/(k2 + k3).
Control and Pharmacologic Blocking Studies
In addition to control conditions (n = 4), NET blocking studies were performed with the NET inhibitor desipramine. The goal of these studies was to assess the ability of the quantitative parameters from kinetic analyses to track progressively lower cardiac NET densities induced pharmacologically by increasing desipramine doses. All studies were performed in the same monkey to minimize biologic variation between studies and to make initial assessments of the reproducibility of quantitative measures of NET density. The desipramine dose (dissolved into 2.0 mL of sterile saline) was infused intravenously over 20 min using an infusion pump. 11C-GMO was injected 10 min after the end of the desipramine infusion. Desipramine doses used were 0.010 mg/kg (n = 2), 0.0316 mg/kg (n = 2), 0.10 mg/kg (n = 2), 0.316 mg/kg (n = 1), and 1.0 mg/kg (n = 1). The measured kinetic parameters Ki from compartmental modeling and Kp values from Patlak analysis, as a function of desipramine dose, were fit to a sigmoidal dose–response model with variable slope using nonlinear regression (Prism 3.0; GraphPad Software).
RESULTS
Isolated Rat Heart Studies
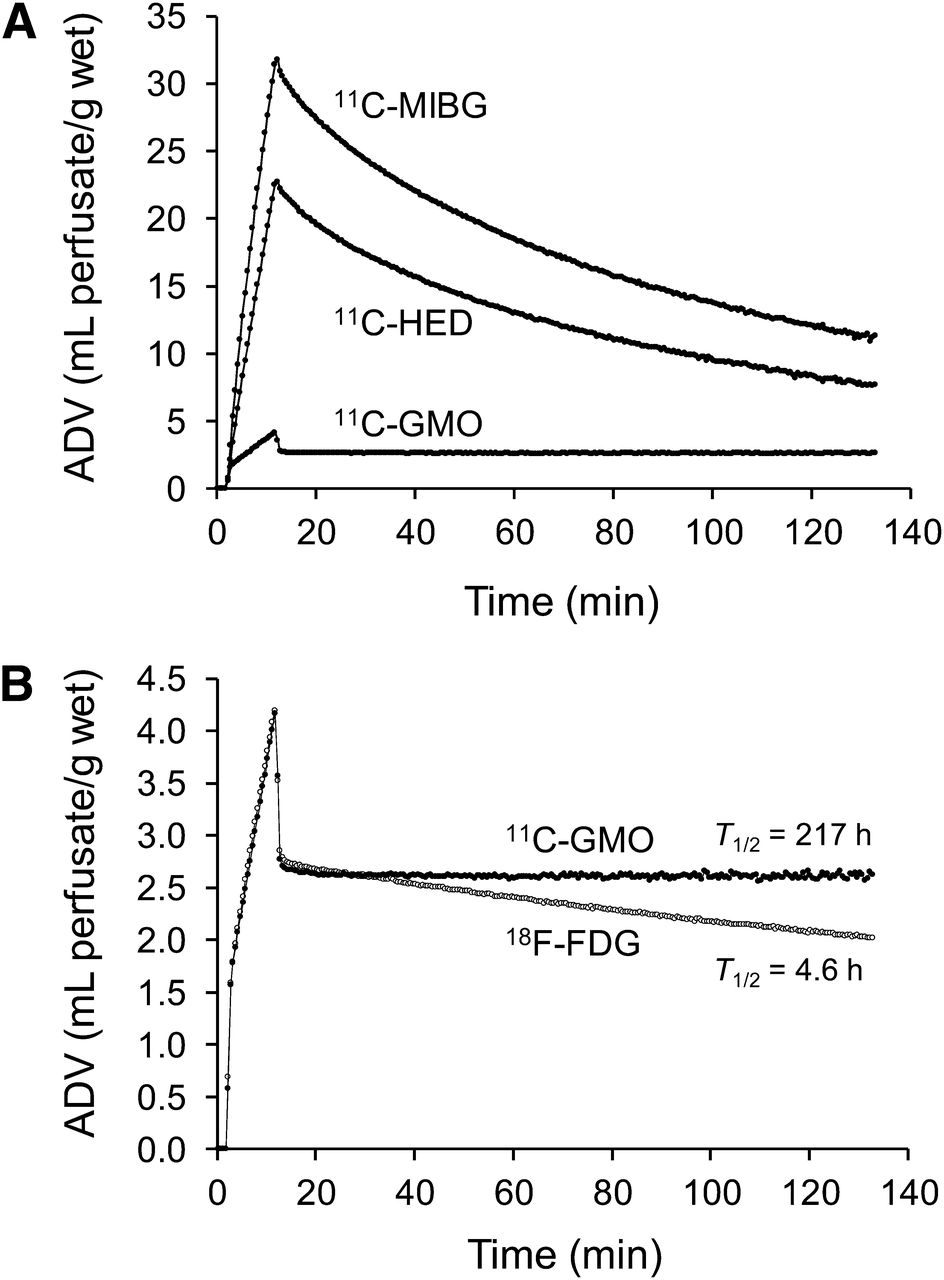
The neuronal uptake and retention kinetics of 11C-GMO in the isolated rat heart are shown in Figure 3A, in comparison to those of 11C-MIBG and 11C-HED. 11C-GMO possesses a much slower neuronal uptake rate (Kup) than the other 2 tracers (Table 1), about 8 times slower than 11C-HED and 12 times slower than 11C-MIBG. 11C-GMO also has a much longer neuronal retention time than 11C-MIBG and 11C-HED (Table 1). A slower neuronal uptake rate and a long retention time are the 2 kinetic properties we hypothesized a nerve tracer would require for its kinetics to be analyzed successfully with tracer kinetic techniques. It is also interesting to compare the kinetics of 11C-GMO with those of the well-established cardiac tracer 18F-FDG (10 mM glucose, no insulin) in this model (Fig. 3B). The uptake kinetics of the 2 tracers are almost identical, whereas 18F-FDG clears from the myocardium with a major half-time of 4.6 h, compared with a neuronal clearance half-time of more than 200 h for 11C-GMO (Table 1). Because coronary flow rates are more than 10 times physiologic levels in this system, tracers diffusing from tissue spaces tend to be cleared from the isolated heart at faster rates than would be seen in vivo. Thus, storage of 11C-GMO inside vesicles is an effective trapping mechanism leading to extremely long neuronal retention times.

(A) Kinetics of 11C-MIBG, 11C-HED, and 11C-GMO in isolated working rat hearts. In each case, 10-min constant infusion of tracer was performed to measure neuronal uptake rates (Kup; mL/min/g wet), then heart switched to normal heart perfusate to study efflux rates from neuronal spaces. (B) For comparison, isolated rat heart kinetics of 11C-GMO are shown along with those of 18F-FDG. Note different y-axis scales used in A and B.
Uptake Rates and Major Clearance Half-Times in Isolated Rat Hearts, as Shown in Figure 3
11C-GMO Metabolism
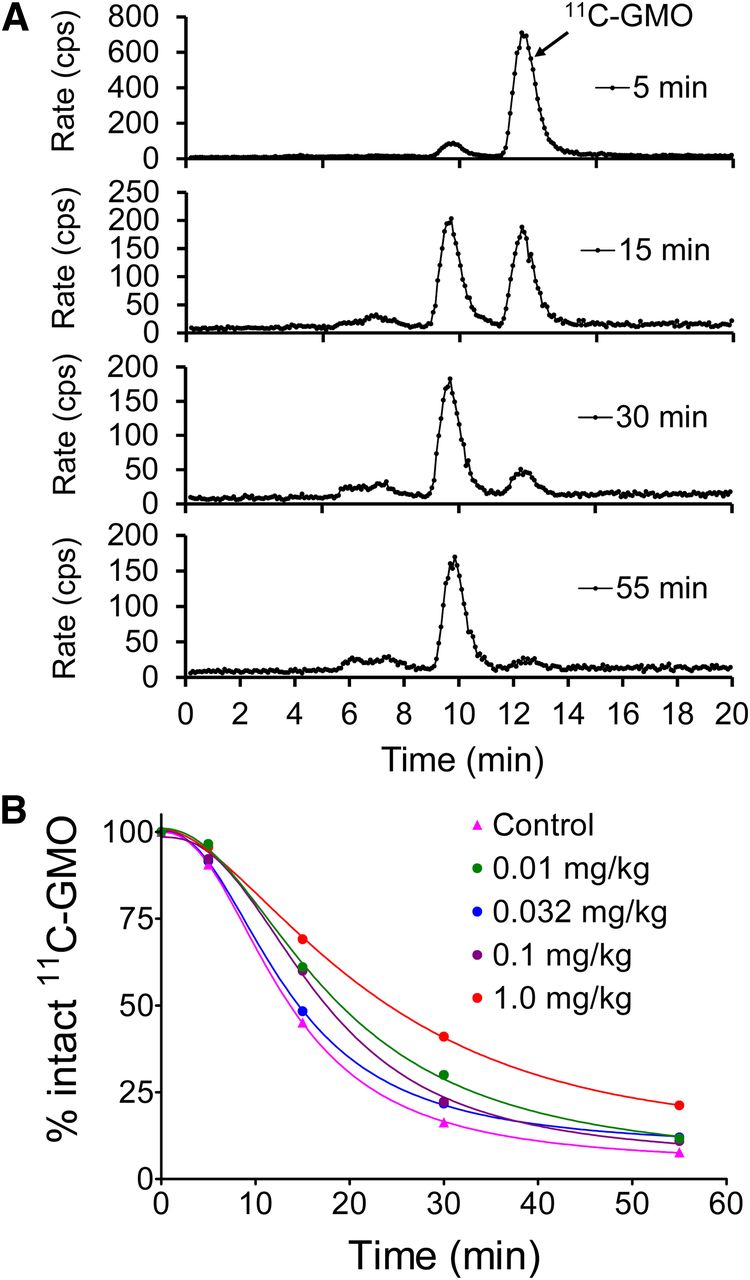
In monkey studies, 11C-GMO was metabolized into 1 major and 2 minor metabolites, all of which were more polar than the parent compound (Fig. 4A). The half-time for the metabolic breakdown of 11C-GMO averaged 16.0 ± 3.0 min (range, 11.0–22.5 min). In most cases, the fraction of plasma activity associated with intact 11C-GMO versus time was fit to the following function (Fig. 4B): Eq. 1
Eq. 1

(A) Reversed-phase HPLC and radiodetection analysis of radiometabolite formation in plasma. (B) Fraction of activity associated with intact 11C-GMO was determined for each sample, and percentage intact vs. time data fit to mathematic function to characterize metabolic breakdown of 11C-GMO.
For the study using a desipramine dose of 1.0 mg/kg, it was necessary to use an alternative function: Eq. 2
Eq. 2
The fitted curve for fintact(t) was used in preparing the input function, Cp(t), for kinetic analyses. HPLC analyses of blood samples spiked with 11C-GMO showed only the parent compound, indicating that it is stable in blood and plasma. Similar to 123I-MIBG and 11C-HED, 11C-GMO is metabolically stable inside neurons. The guanidine group in the side chain of 11C-GMO prevents metabolism by neuronal enzymes such as monoamine oxidase, although some phenethylguanidines are reversible monoamine oxidase inhibitors (16). 11C-GMO lacks the catechol structure of catecholamines such as norepinephrine, so it is not metabolized by catechol-O-methyl-transferase.
11C-GMO Partitioning in Blood
Analysis of 11C-GMO concentrations in whole blood, plasma, and RBCs demonstrated that 11C-GMO stays primarily in plasma, with little uptake into RBCs. The ratio of plasma and whole-blood activity concentrations, Cp(t)/Cwb(t), tended to be constant throughout the PET study. For all of the blood samples drawn during PET scanning, the average ratio was 1.47 ± 0.08. Similarly, for all spiked blood samples, the mean ratio was 1.41 ± 0.07. Desipramine block of cardiac NET had no effect on the blood partitioning of 11C-GMO. Blood partitioning data for each study was used in the preparation of input functions for kinetic analyses.
Effects of Desipramine Infusion and 11C-GMO Injection
Body temperature and SpO2 levels were stable during all studies. For desipramine levels at 0.10 mg/kg and below, desipramine infusion caused no change in heart rate. However, for desipramine doses of 0.316 and 1.0 mg/kg, starting 3 min into the desipramine infusion, heart rate steadily rose from a baseline of around 100 bpm up to 122–125 bpm at 1 min after desipramine infusion. Heart rate then slowly declined 4–8 bpm over the next 60 min. Intravenous injection of 11C-GMO had no effect on heart rate, with only a transient increase of 1–2 bpm for 1 min observed during the desipramine study using a dose of 0.316 mg/kg.
Imaging Properties
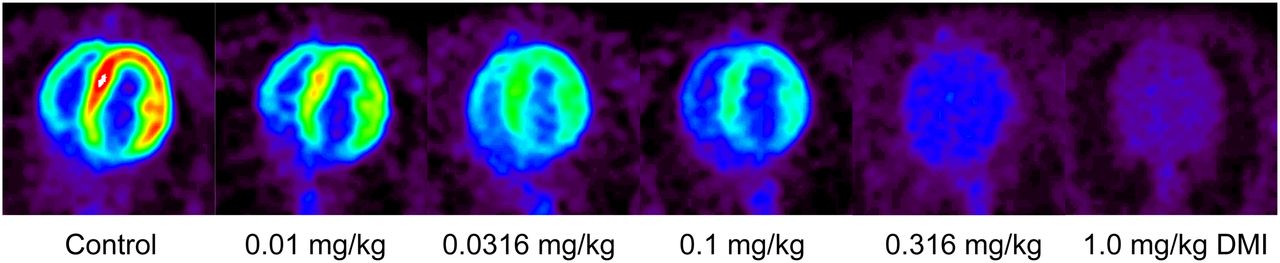
Representative transaxial PET images from a control study and progressively higher desipramine block studies are shown in Figure 5. The images clearly show a desipramine dose–dependent decline in the cardiac retention of 11C-GMO. In controls, heart-to-blood ratios of 3.01 ± 0.18 and heart-to-liver ratios of 0.89 ± 0.24 were seen in the final image (n = 4). If the relatively high liver uptake of 11C-GMO also occurs in human subjects, this could be a minor drawback because the liver is often close to inferior or inferoseptal segments of the left ventricle, leading to some spillover of counts from liver into these segments.

Representative transaxial small-animal PET images of cardiac 11C-GMO retention. Shown are summed images (final 4 dynamic frames) for control study (far left) and for blocking studies with progressively higher doses of NET inhibitor desipramine.
Kinetic Analysis: Compartmental Modeling
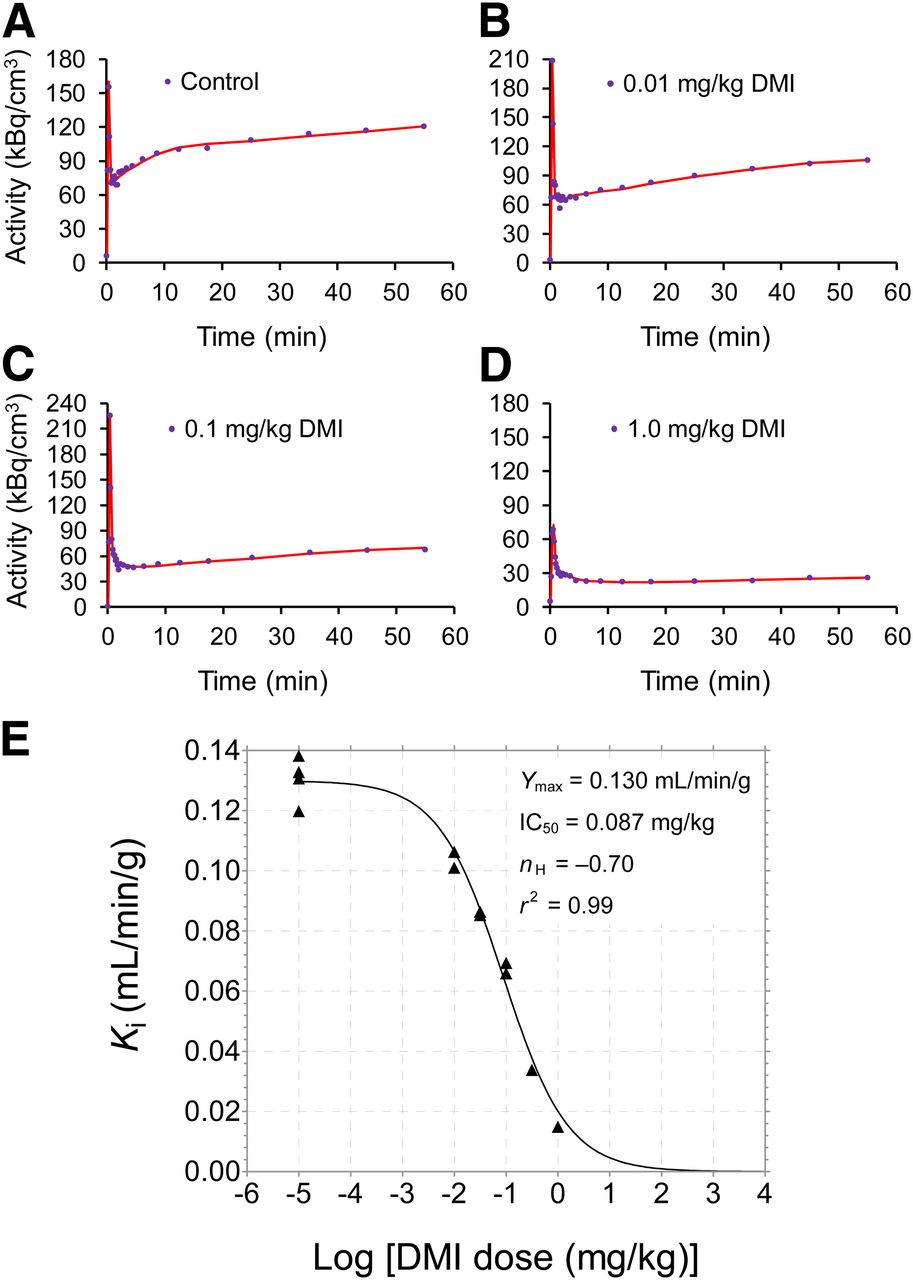
Compartmental modeling of 11C-GMO kinetics proved to be robust in the sense that the nonlinear regression algorithm converged in a few iterations to a single global minimum. Myocardial time–activity curves and corresponding compartmental model fits for a control study and 3 of the desipramine blocking doses are presented in Figures 6A–6D. Model parameter estimates for all studies are given in Table 2. Parameter estimates were fairly consistent within groups, but values of k3, which ideally should reflect cardiac NET density, did not decrease with increasing desipramine doses. However, the net uptake rate constant Ki calculated from the combination of estimated rate constants (K1k3)/(k2 + k3) did provide a quantitative measure that sensitively tracked reductions in available cardiac NET in a desipramine dose–dependent manner (Table 2; Fig. 6E). Declines in Ki values (Y) versus increasing desipramine doses were well described by a sigmoidal dose–response model with variable Hill slope (nH), where X = log [desipramine dose]: Eq. 3
Eq. 3

Compartmental modeling of 11C-GMO kinetics using simplified model shown in Figure 1B. Myocardial 11C-GMO kinetics (blue dots) and corresponding compartmental model fits (red lines) are shown for control study (A) and 3 different desipramine blocking doses (B–D). (E) Relationship between net uptake rate constants Ki (mL/min/g) calculated from compartmental model parameter estimates and log [desipramine dose (mg/kg)]. Decline in Ki values was well described by sigmoidal dose–response curve with variable Hill slope (nH). Estimated parameter values for dose–response curve fit are shown.
Results from Compartmental Modeling and Patlak Analysis of 11C-GMO Kinetics
For the Ki data, nonlinear regression analysis yielded parameter estimates of IC50 = 0.087 ± 0.012 mg/kg desipramine, Hill slope nH = –0.70 ± 0.07, and a maximum net uptake rate constant Ymax = 0.130 ± 0.003 mL/min/g (r2 = 0.99). Because the Hill slope is less than –1.0, this indicates that the dose–response curve is more shallow than the standard 1-site competition dose–response curve used frequently for in vitro competitive displacement assays. The observation that estimates of the individual model parameters K1, k2, k3, and BV were variable and that k3 estimates alone did not serve as the index of NET density was not unexpected, because a similar situation exists for analyses of 18F-FDG kinetics in assessments of cardiac glucose utilization (17).
Kinetic Analysis: Patlak Graphical Analysis
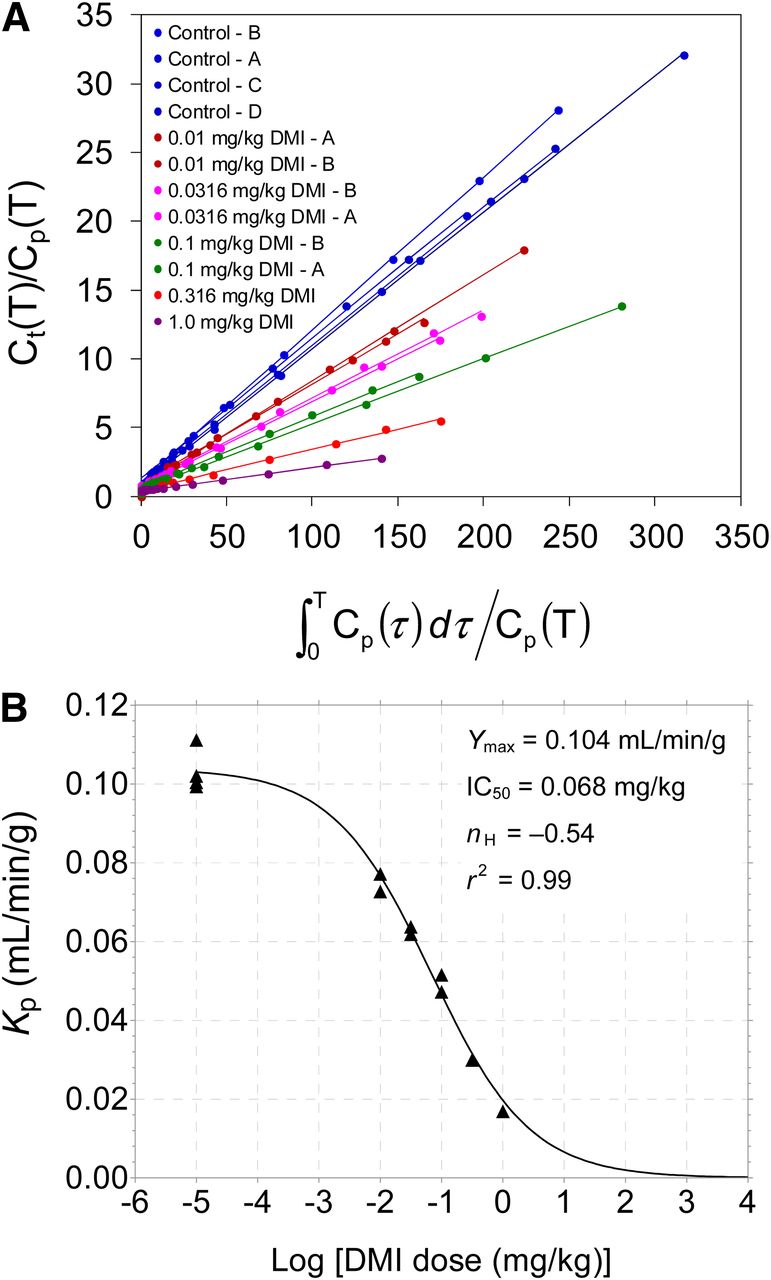
Patlak analysis of 11C-GMO kinetics provided highly linear Patlak plots under all experimental conditions, with linear correlation coefficients r > 0.99 in all cases (Fig. 7A). Measured Patlak slopes Kp (mL/min/g) are shown in Table 2. Similar to the Ki values from compartmental modeling, the measured Patlak slopes Kp declined along a sigmoidal dose–response curve (Fig. 7B) with increasing doses of desipramine: IC50 = 0.068 ± 0.010 mg/kg desipramine, Hill slope nH = –0.54 ± 0.05, and a maximum Patlak slope Ymax = 0.104 ± 0.002 mL/min/g (r2 = 0.99). There was a strong linear correlation between the measured Patlak slopes and the calculated Ki values from compartmental modeling: Kp = (0.757)Ki + 0.001, with linear correlation coefficient r = 0.99 (data not shown).

(A) Patlak plots of 11C-GMO kinetics for all studies. Legend values are listed in order of highest Patlak slope to lowest, corresponding to values given in Table 2. (B) Relationship between Patlak slopes Kp (mL/min/g) and log [desipramine dose (mg/kg)]. Reductions in measured Kp values vs. desipramine dose were again well described by sigmoidal dose–response curve with variable Hill slope (nH). Estimated parameter values for dose–response curve are shown.
DISCUSSION
This study was designed to test whether quantitative measurements derived from analyses of myocardial 11C-GMO kinetics are capable of sensitively tracking cardiac sympathetic nerve densities over the full dynamic range seen in normal subjects and in patients with heart disease. The experimental approach used was to pharmacologically induce varying degrees of cardiac NET inhibition using the NET inhibitor desipramine. Our findings demonstrated that 2 measures of the net uptake rate constant Ki—obtained either by calculation from compartmental modeling results or as the Patlak slope Kp from Patlak graphical analysis—each appear to serve as robust and reproducible measures of regional cardiac sympathetic nerve density. To the best of our knowledge, 11C-GMO is the first sympathetic nerve radiotracer to possess myocardial kinetics that can be analyzed in a straightforward and robust manner using conventional kinetic analysis methods.
Isolated rat heart studies demonstrated that NET transports 11C-GMO at a rate about 8 times slower than 11C-HED (Fig. 3A). Similarly, NET transport assays using a rat C6 glioma cell line stably transfected with the cloned human NET (C6-hNET cells) showed that 11C-GMO was transported at a rate about 9 times slower than 11C-HED (18). We believe that this large reduction in the NET transport rate reduces the rate constant k3 in the compartmental model to a magnitude that is less than k2 (Fig. 1B). When k3 < k2, the tracer’s net tissue uptake is not confounded by flow-limitation effects. As shown in Table 2, for all studies performed, k3 was estimated to be less than k2, which is consistent with the hypothesis that the net neuronal uptake of 11C-GMO is not flow-limited. Thus we believe that the quantitative parameters Ki and Kp are likely to be sensitive measures of regional cardiac nerve density, capable of detecting mild-to-moderate nerve losses earlier in the progression of denervation than is currently possible with flow-limited tracers such as 11C-HED or 123I-MIBG. The dose–response curves shown in Figures 6E and 7B support this contention. Desipramine-induced declines in both Ki and Kp were well described by a sigmoidal dose–response model, with r2 > 0.99 in each case. This means that more than 99% of the total variance in the net influx constants (Ki, Kp) is explained by variation in the desipramine dose (as modeled by the dose–response function), demonstrating the high sensitivity of these measures.
Not surprisingly, there was a high correlation between Ki and Kp, which are essentially 2 measures of the same aggregate combination of the model rate constants, (K1k3)/(k2 + k3). In most cases, Patlak slopes Kp were a little lower than their corresponding Ki values. For Patlak analysis, we did not make any corrections to the tissue kinetics for the presence of radioactivity in blood vessels or for spillover effects between blood pool and myocardium. This resulted in a modest downward bias in the Patlak slopes. The compartmental model’s BV parameter corrects for blood-borne radioactivity in tissue and for spillover effects (19). Although Kp was lower than Ki for most studies, for the highest desipramine concentration (1.0 mg/kg), Kp was higher than Ki (0.17 mL/min/g vs. 0.15 mL/min/g, respectively; Table 2). In this study, tissue activity levels were actually lower than blood activity levels late in the study, leading to a higher than average BV estimate, reflecting net spillover from blood into tissue. It appears that the compartmental modeling approach appropriately accounts for blood volume and spillover effects, and thus the calculated Ki constant should be more accurate than the Patlak slopes. That said, both measures are seen to provide an excellent index of NET transport rate.
We postulated that the main factor causing quantitative analyses of a tracer such as 11C-HED to fail was its rapid NET transport rate, resulting in flow-limited uptake. The present results demonstrate that the slower NET transport rate of 11C-GMO, combined with its efficient trapping in storage vesicles, leads to myocardial kinetics that can be analyzed successfully. However, it is possible that another factor may contribute to successful analysis of 11C-GMO kinetics—the tendency of the tracer to stay in plasma throughout the study, with little trapping in RBCs, allowing intact 11C-GMO molecules in plasma to accumulate slowly into nerve terminals during the entire PET study. 11C-HED on the other hand tends to equilibrate with RBCs, reaching a Cp/Cwb ratio of 1.0 several minutes after tracer injection (20). If 11C-HED molecules associated with RBCs are unavailable for extraction into tissue, preventing further accumulation into neurons, this may explain in part why cardiac 11C-HED levels do not climb significantly after the rapid cardiac uptake seen early in a PET study (21). The uptake of 11C-HED into RBCs may simply be due to passive diffusion, because it is more lipophilic than 11C-GMO. However, the biogenic amines dopamine, norepinephrine, and epinephrine are all actively transported into RBCs (22), so it is possible that this mechanism is also involved.
Measurement of Regional Norepinephrine Uptake Rates
In cardiac PET studies of glucose metabolism with 18F-FDG, it has been shown that regional metabolic rates of glucose utilization rMRglu (μmol/min/g) can be calculated from net uptake rate constants Ki (or measured Patlak slopes Kp) (23). For such calculations, it is necessary to know the value of the lumped constant (LC) in the heart (the correction factor that relates the observed 18F-FDG kinetics to those of glucose) and the subject’s plasma glucose concentration Cglu (μmol/mL). Then rMRglu can be calculated as: Eq. 4
Eq. 4
In a similar fashion, it may be possible to use regional Ki values from compartmental modeling of 11C-GMO kinetics (or Patlak slopes Kp) to noninvasively estimate regional norepinephrine (NE) uptake rates (rURNE) in the heart, in units of pmol NE/min/g. This would require knowledge of the relative NET transport rates of norepinephrine and 11C-GMO, here termed a relative transport constant TC = URGMO/URNE. In addition, the plasma concentration of norepinephrine CNE (pmol NE/mL) would need to be measured for the subject. Then rURNE could be calculated as: Eq. 5
Eq. 5
As a starting point, TC can be approximated from isolated rat heart kinetics. In this system, 11C-GMO has a NET-mediated uptake rate constant Kup equal to 0.30 mL/min/g (8), whereas the value for 3H-norepinephrine is 4.44 mL/min/g (24), so that TC = 0.30/4.44 = 0.068. Plasma norepinephrine levels CNE for female rhesus macaques held in captivity have been reported to be approximately 1.2 pmol/mL (25). Using Ki = 0.130 mL/min/g for 11C-GMO, we can estimate rURNE in the rhesus macaque heart as:
Values for comparison are difficult to find, but Eisenhofer et al. estimated a whole-heart URNE = 819 pmol/min in the human heart using 3H-norepinephrine spillover techniques (26). Taking a nominal mass of 300 g for a normal adult human heart, an estimated regional rURNE value would be (819 pmol/min)/(300 g) = 2.7 pmol/min/g. These 2 estimates of rURNE agree well enough to suggest that this approach may provide a noninvasive method of measuring regional norepinephrine uptake rates in human subjects. Further work is needed to validate this approach. Although such measurements might not find routine clinical use, they may find application in clinical studies of the effects of diseases on regional norepinephrine reuptake rates or on the efficacies of drug therapies designed to improve or otherwise modulate norepinephrine reuptake rates.
CONCLUSION
11C-GMO appears to be the first cardiac sympathetic nerve tracer possessing kinetics that can be analyzed in a straightforward manner to provide robust and sensitive quantitative measures of regional cardiac sympathetic nerve density. These quantitative measures will likely be able to detect mild-to-moderate sympathetic nerve losses that occur early in the course of cardiac denervation, which is not possible with existing tracers such as 11C-HED and 123I-MIBG. In addition, 11C-GMO may find application in monitoring the efficacy of novel drug therapies designed to halt or reverse cardiac denervation in diseases associated with enhanced risk of sudden cardiac death, such as diabetic autonomic neuropathy and heart failure. Finally, it may be possible to noninvasively quantify regional norepinephrine reuptake rates through extension of the methodology currently used for measuring glucose metabolic rates from parameters measured from 18F-FDG kinetics.
DISCLOSURE
The costs of publication of this article were defrayed in part by the payment of page charges. Therefore, and solely to indicate this fact, this article is hereby marked “advertisement” in accordance with 18 USC section 1734. This work was supported by PHS grant R01-HL079540 from the National Heart Lung and Blood Institute, National Institutes of Health, Bethesda, MD. No other potential conflict of interest relevant to this article was reported.
Acknowledgments
We thank the staff of the University of Michigan Cyclotron Facility for preparing 11C-HED and 18F-FDG.
Footnotes
Published online Jul. 25, 2013.
- © 2013 by the Society of Nuclear Medicine and Molecular Imaging, Inc.
REFERENCES
- Received for publication January 28, 2013.
- Accepted for publication April 4, 2013.


